0. Overview
지난 포스팅에서 쿠버네티스의 오토스케일링 기능 중 하나인 HPA(Horizontal Pod AutoScaler)에 대해 다루었었다. (https://velog.io/@yulmwu/kubernetes-hpa)
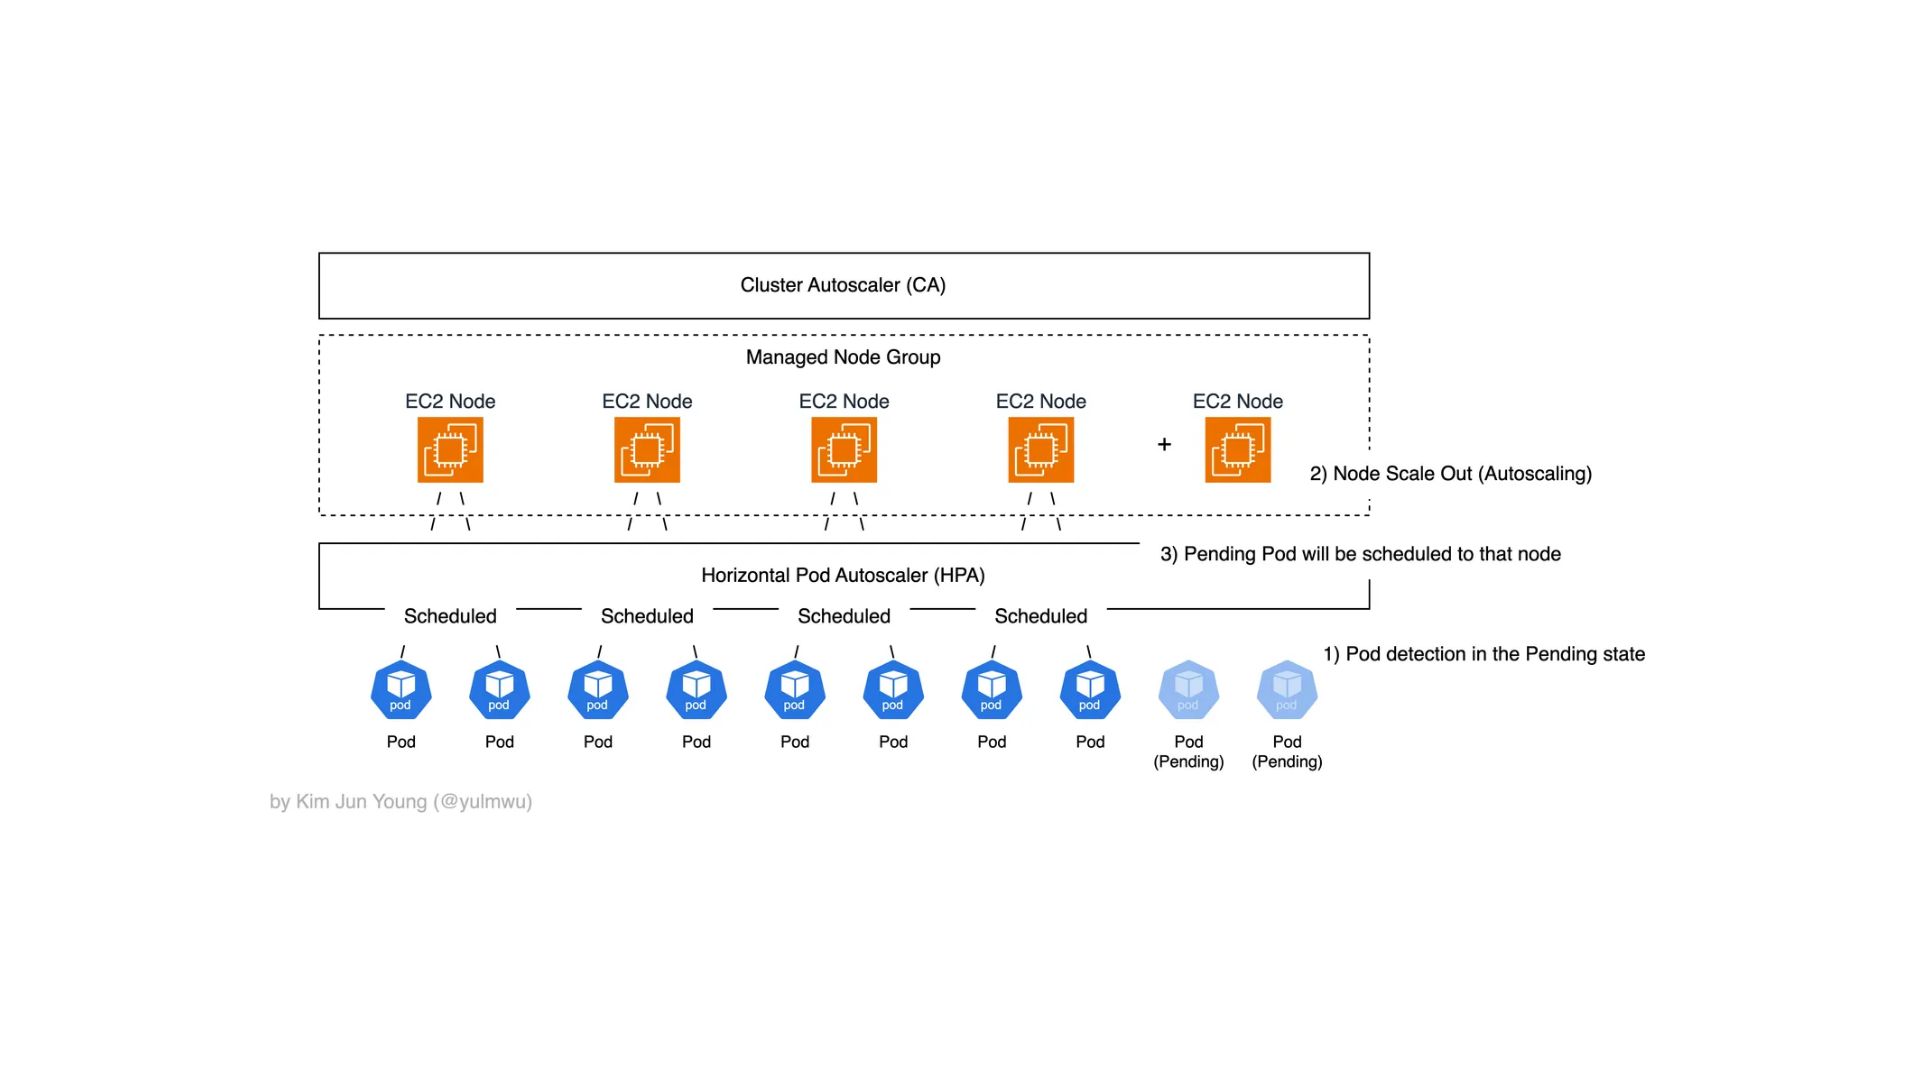
HPA는 위 사진과 같이 파드의 수를 수평적으로 증가시키거나 감소시키는데, HPA를 사용하였을 때 발생하는 근본적인 문제가 있다.
위 포스팅에서도 언급이 있었지만, 노드의 수는 그대로인데 파드의 수만 늘어나고 노드에 더 이상 스케줄링 될 수 없을 경우 그러한 파드는 Pending 상태로 들어가게 된다.
말 그대로 어느 노드에 스케줄링되지 않아 대기 상태에 있다는 것인데, 이때 Cluster Autoscaling을 통해 노드의 수를 수평적으로 증가시킨다.
1. Cluster Autoscaling
Cluster Autoscaling에 대해 정확하게 설명해보자면, 스케줄러가 파드를 노드에 배치하려다가 어느 노드에도 못 올릴 경우 파드는 Pending 상태에 들어선다.
이때 Cluster Autoscaler(이하 CA)는 특정한 노드 그룹의 desired 용량을 증가시키고(Scale Out), 노드 위에 올라간 파드의 배치를 살펴보면서 특정 파드를 다른 노드로 옮겼을 때 수용이 가능하여 불필요한 노드가 발생할 것을 확인했다면 노드를 감소시킨다. (Scale In)
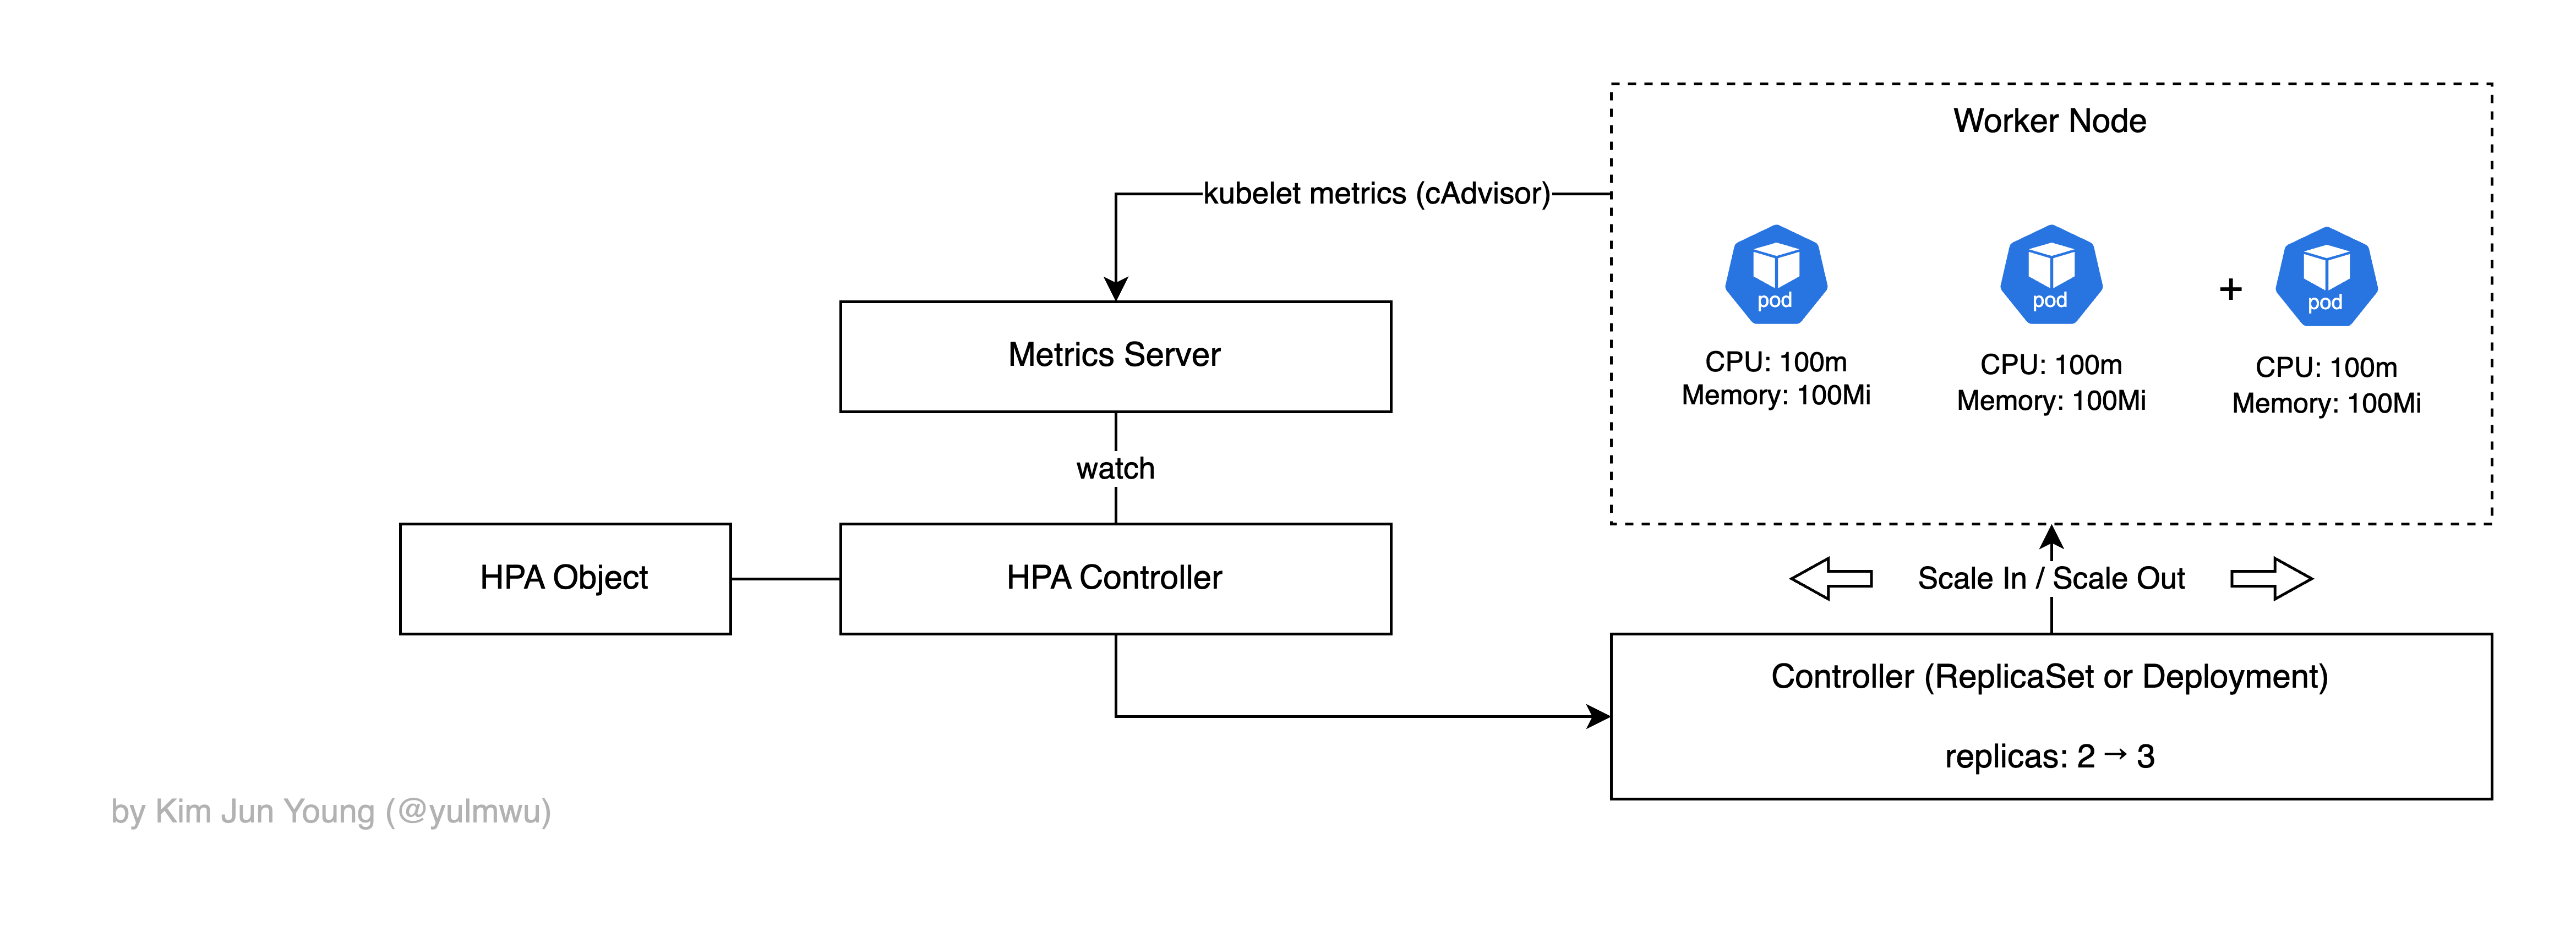
이때 CA는 HPA와는 다르게 실제 CPU/메모리 사용률을 기반으로 하지 않고 리소스 요청량(requests)를 보고 판단한다.
AWS EKS(EC2 인스턴스)에선 EC2 AutoScaling Group 및 Managed Node Group을 통해 API를 호출하여 노드의 수를 스케일링한다. Fargate는 노드를 신경쓰지 않는 서버리스 환경이기 때문에 직접 Cluster Autoscaling을 할 필요가 없다.
일반적으로 CA와 HPA는 함께 사용되는데, 만약 각 요소를 개별적으로 사용할 경우 아래와 같은 문제가 발생하게 된다.
- HPA만 단독으로 사용하였을 경우, 파드의 Replica 수가 늘어나 처리량이 증가하겠지만 최종적으로 노드에 스케줄링될 수 있는 파드 수가 최대치에 도달했을 경우 더 이상 스케줄링되지 않고 Pending 상태가 된다.
- CA만 단독으로 사용하였을 경우 애초에 파드의 수를 스케일링 할 방법이 없기 때문에 Cluster Autoscaling이 발생하지 않는다.
CA는 HPA와는 다르게 빠르게 스케일 인/아웃 될 수 없고, 노드를 프로비저닝 할 시간이 발생하기 때문에 그러한 상황을 적절하게 고려하도록 하자.
2. CA vs Karpenter
방금까지 설명했던 Cluster Autoscaler는 AWS EKS에선 ASG를 조작하여 desired 값을 증가시키거나 TerminateInstance 등의 AWS API를 호출한다.
ASG, 노드 그룹 단위로만 관리되기 때문에 인스턴스 타입이나 보안 그룹 등의 구성 요소가 고정된다. 즉 크게 Pending Pods → CA → ASG desired adjust → EC2 Provisioning → Node join(kubeadm)로 동작한다.
하지만 ASG를 기반으로 하기 때문에 인스턴스 타입이 정적으로 고정되고 ASG를 거쳐 노드를 프로비저닝하기 때문에 사용 가능하기 까지 2~3분 이상 소요된다.
이러한 이유로 AWS에서 ASG를 거치지 않고 클러스터 내에서 직접 EC2 API를 호출하여 노드를 생성하고 삭제할 수 있는 Karpenter를 개발하였다.
Karpenter는 파드의 요구사항에 맞춰 최적의 인스턴스 타입을 실시간으로 선택하고(ASG를 사용하지 않기 때문에 가능함) 노드를 직접 부트스트랩하기 때문에 CA보다 2~3배 이상 빠른 스케일링 속도를 내게 된다.
즉 Pending Pods → Scheduler + Karpenter → EC2 Provisioning (직접 생성) → Node join(kubeadm)과 같이 동작한다.
이 포스팅에선 CA와 Karpenter를 통한 노드 스케일링을 실습해보고, EC2 프로비저닝 속도까지 비교해보도록 하겠다.
3. Example — Cluster Autoscaler
먼저 Cluster Autoscaler 부터 테스트해보겠다. 기본 인스턴스 타입은 CA 및 Karpenter 실습에서 동일하게 t3.medium, Karpenter 실습에선 필요에 따라 large ~ 2xlarge 까지 가능하도록 하였다.
eksctl을 위한 ClusterConfig는 아래와 같다.
# ca/cluster.yaml

apiVersion: eksctl.io/v1alpha5
kind: ClusterConfig
metadata:
  name: ca-lab-eks
  region: ap-northeast-2
  version: "1.33"
iam:
  withOIDC: true
  serviceAccounts:
    - metadata:
        name: cluster-autoscaler
        namespace: kube-system
        labels:
          app.kubernetes.io/name: cluster-autoscaler
      wellKnownPolicies:
        autoScaler: true
managedNodeGroups:
  - name: ca-ng
    instanceType: t3.medium
    desiredCapacity: 1
    minSize: 1
    maxSize: 3
    privateNetworking: false
    ssh:
      enableSsm: true
    iam:
      withAddonPolicies:
        autoScaler: true
    labels:
      role: ca-ng
    tags:
      k8s.io/cluster-autoscaler/enabled: "true"
      k8s.io/cluster-autoscaler/ca-lab-eks: "owned"
eksctl create cluster -f ca/cluster.yaml
aws eks update-kubeconfig --name ca-lab-eks그리고 Helm을 통해 AutoScaler를 설치하도록 한다. 이때 넣어줄 값들은 아래와 같다.
# ca/ca-values.yaml

awsRegion: ap-northeast-2
cloudProvider: aws
autoDiscovery:
  clusterName: ca-lab-eks
  tags:
    - k8s.io/cluster-autoscaler/enabled
    - k8s.io/cluster-autoscaler/ca-lab-eks
rbac:
  serviceAccount:
    create: false
    name: cluster-autoscaler
image:
  repository: registry.k8s.io/autoscaling/cluster-autoscaler
  tag: v1.33.0
extraArgs:
  logtostderr: "true"
  stderrthreshold: info
  v: "4"
  balance-similar-node-groups: "true"
  skip-nodes-with-local-storage: "false"
  skip-nodes-with-system-pods: "false"
  expander: least-waste
helm repo add autoscaler https://kubernetes.github.io/autoscaler
helm repo update
helm upgrade --install cluster-autoscaler autoscaler/cluster-autoscaler \
--namespace kube-system \
-f ca/ca-values.yaml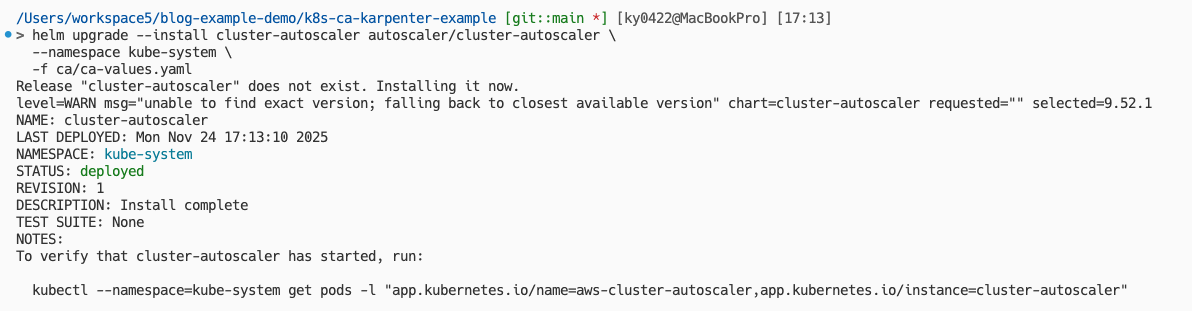
여기까지 클러스터를 만들고 Helm을 통해 AutoScaler를 설치하는 과정이였다. 실제 운영에선 여기에 HPA를 더해 사용하겠지만, 본 포스팅에선 CA와 Karpenter의 EC2 노드 프로비저닝 속도를 비교해보는 것에 중점을 두었기 때문에 수동으로 파드의 수를 조절하여 테스트해보겠다.
CA 실습 및 Karpenter 실습에서 공통적으로 사용할 Deployment는 아래와 같다. replicas는 파드 생성 확인을 위해 1로 설정해두었다.
# common/deployment.yaml

apiVersion: apps/v1
kind: Deployment
metadata:
  name: inflate
  namespace: default
spec:
  replicas: 1
  selector:
    matchLabels:
      app: inflate
  template:
    metadata:
      labels:
        app: inflate
    spec:
      containers:
        - name: nginx
          image: nginx:latest
          resources:
            requests:
              cpu: "500m"
              memory: "256Mi"
            limits:
              cpu: "500m"
              memory: "256Mi"
그리고 프로비저닝 속도 측정을 위한 스크립트를 작성해보자. t3.medium 인스턴스가 가질 수 있는 최대 파드의 수는 17개고, 시스템에 필요한 파드도 있어야 하니 스크립트에서 Deployment의 replicas를 30 정도로 늘린다면 CA가 작동해야 한다.
그럼 새로운 노드가 프로비저닝 될 동안 스케줄링되지 못한 파드는 Pending 상태가 될 것이고, Pending 상태가 없고 전부 Available 상태라면 해당 노드가 프로비저닝되어 정상적으로 스케줄링 되었다는 것을 의미한다.
아래 측정용 스크립트는 이러한 원리를 이용한 것이다.
#!/usr/bin/env bash
# common/measure-provisioning.sh

set -euo pipefail

DEPLOYMENT_NAME="inflate"
TARGET_REPLICAS="30"
NAMESPACE="default"
TIMEOUT="1200s"

start_ts="$(date +%s)"

kubectl -n "${NAMESPACE}" scale deployment "${DEPLOYMENT_NAME}" --replicas="${TARGET_REPLICAS}"

kubectl -n "${NAMESPACE}" wait deployment "${DEPLOYMENT_NAME}" \
  --for=condition=Available \
  --timeout="${TIMEOUT}"

end_ts="$(date +%s)"
elapsed="$(( end_ts - start_ts ))"

echo "Elapsed time: ${elapsed} seconds"
kubectl apply -f common/deployment.yaml을 통해 replicas가 1인 상태의 Deployment를 적용해보자.
> kubectl get pods,nodes
NAME                           READY   STATUS    RESTARTS   AGE
pod/inflate-6fb97b9cf5-xtg6d   1/1     Running   0          2m12s

NAME                                                     STATUS   ROLES    AGE     VERSION
node/ip-192-168-19-145.ap-northeast-2.compute.internal   Ready    <none>   5m49s   v1.33.5-eks-ecaa3a6
그러면 현재는 하나의 파드가 Running 상태인데, source common/measure-provisioning.sh를 통해 스크립트를 실행해보자. 스크립트를 실행하고, 새로운 터미널을 열어 곧바로 kubectl get pods,nodes를 실행해보자.
> kubectl get pods,nodes
NAME READY STATUS RESTARTS AGE
pod/inflate-6fb97b9cf5-2v4z2 0/1 Pending 0 19s
pod/inflate-6fb97b9cf5-4m7sf 0/1 Pending 0 19s
pod/inflate-6fb97b9cf5-6b655 0/1 Pending 0 19s
pod/inflate-6fb97b9cf5-7slc2 0/1 Pending 0 19s
pod/inflate-6fb97b9cf5-8cf2t 0/1 Pending 0 19s
pod/inflate-6fb97b9cf5-8vndk 0/1 Pending 0 19s
pod/inflate-6fb97b9cf5-8wk5h 0/1 Pending 0 19s
pod/inflate-6fb97b9cf5-9bljx 0/1 Pending 0 19s
pod/inflate-6fb97b9cf5-9c9kr 0/1 Pending 0 19s
pod/inflate-6fb97b9cf5-9xpzz 0/1 Pending 0 19s
pod/inflate-6fb97b9cf5-c6w68 0/1 Pending 0 19s
pod/inflate-6fb97b9cf5-grgpg 0/1 Pending 0 19s
pod/inflate-6fb97b9cf5-htptc 0/1 Pending 0 19s
pod/inflate-6fb97b9cf5-jwtl9 0/1 Pending 0 19s
pod/inflate-6fb97b9cf5-kp5kc 0/1 Pending 0 19s
pod/inflate-6fb97b9cf5-kpq6z 0/1 Pending 0 19s
pod/inflate-6fb97b9cf5-mdvjf 0/1 Pending 0 19s
pod/inflate-6fb97b9cf5-mllwb 0/1 Pending 0 19s
pod/inflate-6fb97b9cf5-n9jn2 0/1 Pending 0 19s
pod/inflate-6fb97b9cf5-p4928 1/1 Running 0 19s
pod/inflate-6fb97b9cf5-pcctb 0/1 Pending 0 19s
pod/inflate-6fb97b9cf5-prps9 0/1 Pending 0 19s
pod/inflate-6fb97b9cf5-qr75j 0/1 Pending 0 19s
pod/inflate-6fb97b9cf5-rpd6q 0/1 Pending 0 19s
pod/inflate-6fb97b9cf5-w7bq8 0/1 Pending 0 19s
pod/inflate-6fb97b9cf5-x7chq 0/1 Pending 0 19s
pod/inflate-6fb97b9cf5-xtg6d 1/1 Running 0 2m53s
pod/inflate-6fb97b9cf5-zd5zr 0/1 Pending 0 19s
pod/inflate-6fb97b9cf5-zh9fq 0/1 Pending 0 19s
pod/inflate-6fb97b9cf5-zwcnr 0/1 Pending 0 19s
NAME STATUS ROLES AGE VERSION
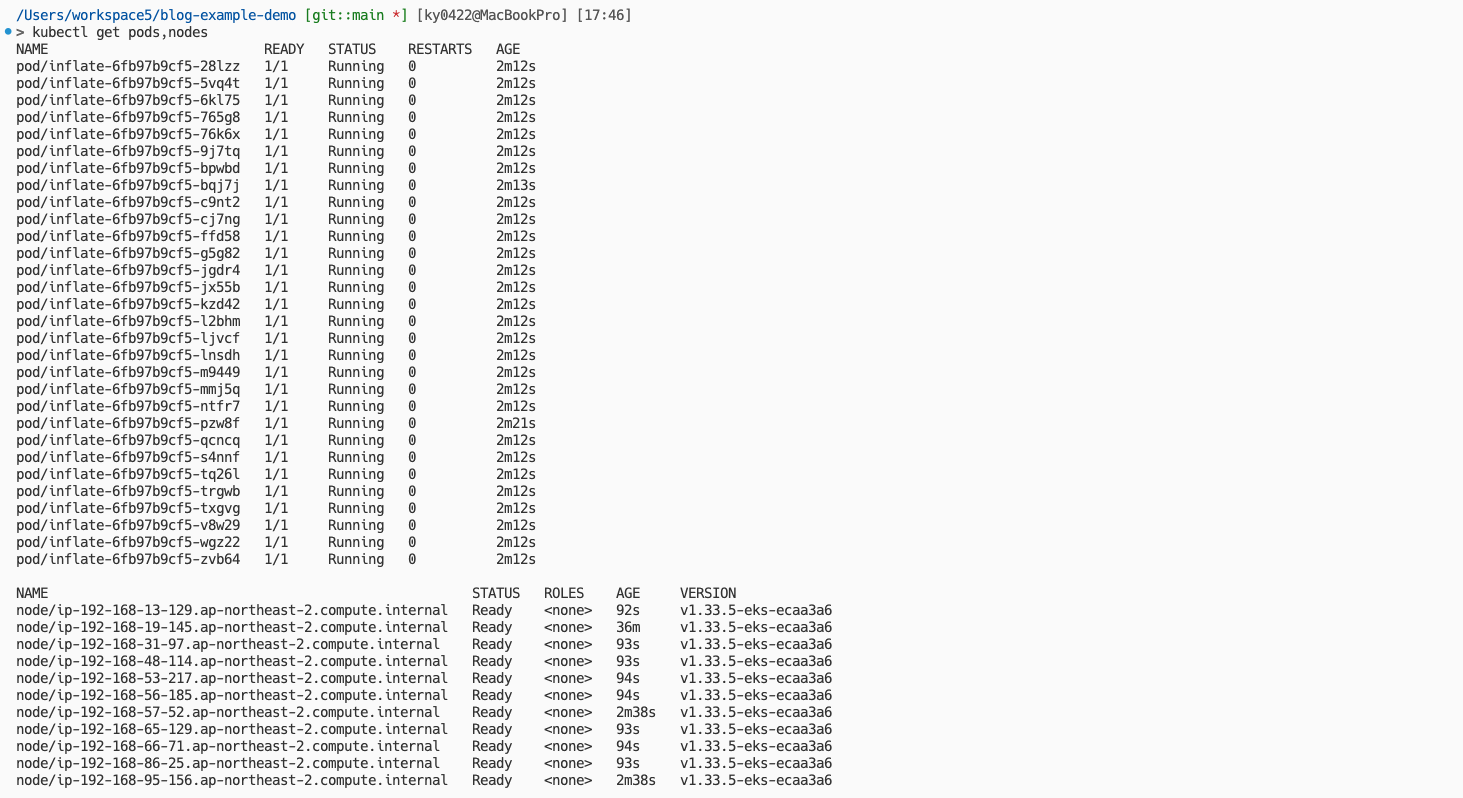
node/ip-192-168-19-145.ap-northeast-2.compute.internal Ready <none> 6m30s v1.33.5-eks-ecaa3a6그러면 몇개의 파드는 Running 상태이지만, 대부분의 파드가 Pending, 즉 아직 노드에 스케줄링이 되지 않은 모습이다. 이제 5분 정도 기다려서 새로운 인스턴스가 만들어질 때 까지 기다려보자.
참고로 kubectl -n kube-system logs -f deploy/cluster-autoscaler-aws-cluster-autoscaler를 통해 CA 로그를 확인해볼 수 있다.
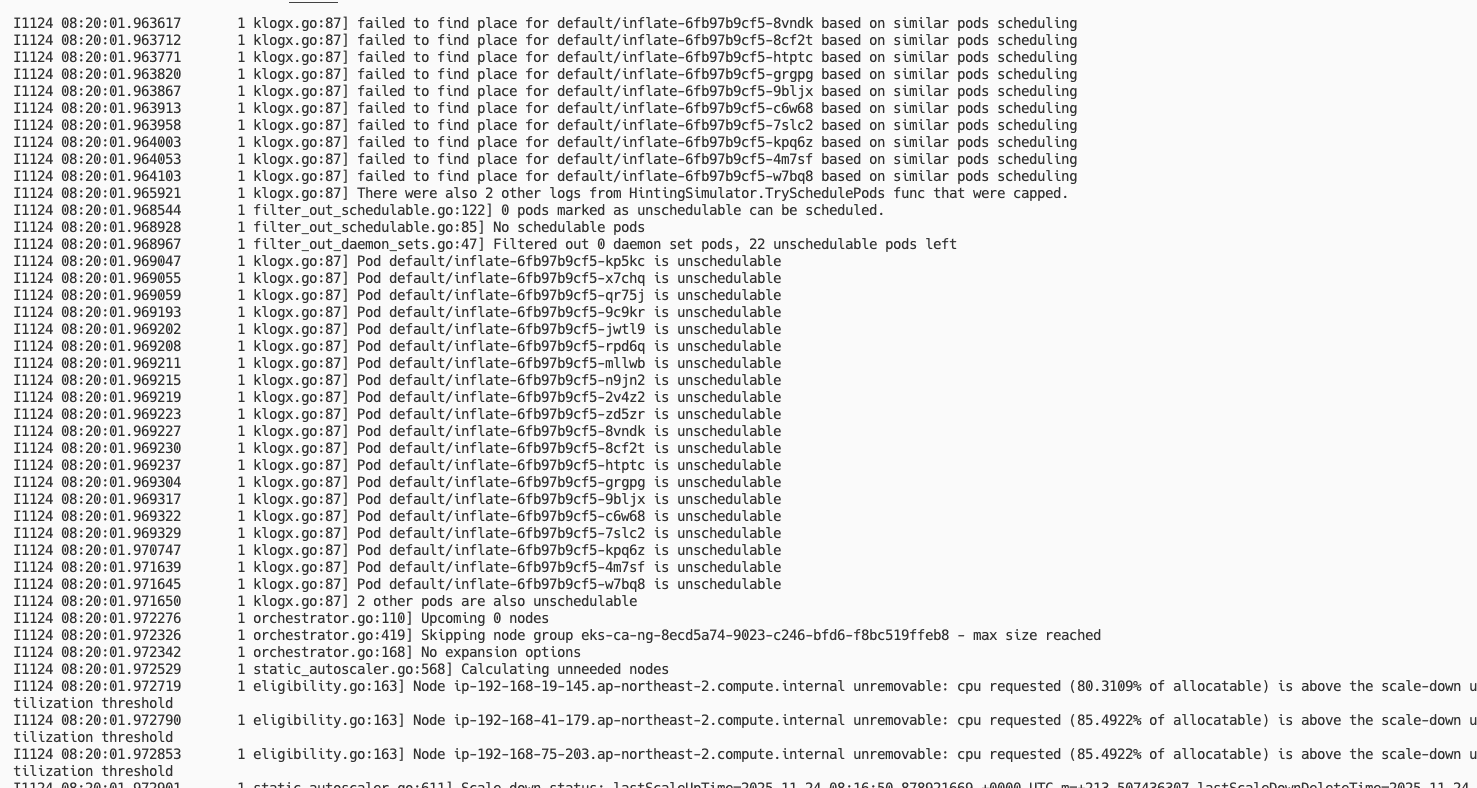
시간이 지나 확인해보면 아래와 같이 모두 Running 상태로 잘 스케줄링이 된 것을 볼 수 있고, 또한 노드가 증가된 것을 볼 수 있다.
Elapsed time: 93.2 seconds약 1분 30초 정도가 소요된 것을 확인할 수 있었다.
노드가 저렇게 많이 생성된 이유는 우리가 CPU 500m, 메모리 256Mi로 고정해두었기 때문에 t3.medium의 vCPU는 2, 실질적으로 사용가능한 vCPU를 1.5 정도로 생각한다면 하나의 노드 당 약 3개의 파드, 그래서 10개 내외의 노드가 생성된 것은 정상이라 볼 수 있다.
이제 kubectl delete -f common/deployment.yaml을 통해 파드를 내려보자. 노드가 곧바로 삭제되진 않을텐데, --scale-down-unneeded-time 등의 옵션으로 스케일 인(다운)의 쿨타임이 설정되어 있기 때문이다. 이는 CA 로그를 통해 확인해볼 수 있다.
...
I1124 08:58:03.920418       1 nodes.go:85] ip-192-168-66-71.ap-northeast-2.compute.internal is unneeded since 2025-11-24 08:49:11.071400201 +0000 UTC m=+2153.699914834 duration 8m52.847191769s
I1124 08:58:03.920421       1 nodes.go:85] ip-192-168-86-25.ap-northeast-2.compute.internal is unneeded since 2025-11-24 08:49:11.071400201 +0000 UTC m=+2153.699914834 duration 8m52.847191769s
I1124 08:58:03.920465       1 static_autoscaler.go:611] Scale down status: lastScaleUpTime=2025-11-24 08:45:19.828403315 +0000 UTC m=+1922.456917952 lastScaleDownDeleteTime=2025-11-24 08:41:18.660916467 +0000 UTC m=+1681.289431100 lastScaleDownFailTime=2025-11-24 07:13:18.496070405 +0000 UTC m=-3598.875414948 scaleDownForbidden=false scaleDownInCooldown=false
I1124 08:58:03.920490       1 static_autoscaler.go:638] Starting scale down
I1124 08:58:03.920513       1 nodes.go:126] ip-192-168-13-129.ap-northeast-2.compute.internal was unneeded for 6m31.766522575s
I1124 08:58:03.920520       1 nodes.go:126] ip-192-168-65-129.ap-northeast-2.compute.internal was unneeded for 8m52.847191769s
I1124 08:58:03.920545       1 nodes.go:126] ip-192-168-95-156.ap-northeast-2.compute.internal was unneeded for 8m52.847191769s
I1124 08:58:03.920562       1 nodes.go:126] ip-192-168-31-97.ap-northeast-2.compute.internal was unneeded for 8m52.847191769s
...
10분이 지날 때 까지 기다려보고 다시 확인해보자.
> kubectl get pods,nodes
NAME                                                     STATUS   ROLES    AGE     VERSION
node/ip-192-168-13-129.ap-northeast-2.compute.internal   Ready    <none>   17m     v1.33.5-eks-ecaa3a6
시간이 지나면 하나의 노드로 돌아오는 것을 확인할 수 있다.
4. Example — Karpenter
TODO