Name of the file : Data Analysis of Coca-Cola 2023 & 2024 USA Sales Performance
Data source : kaggle
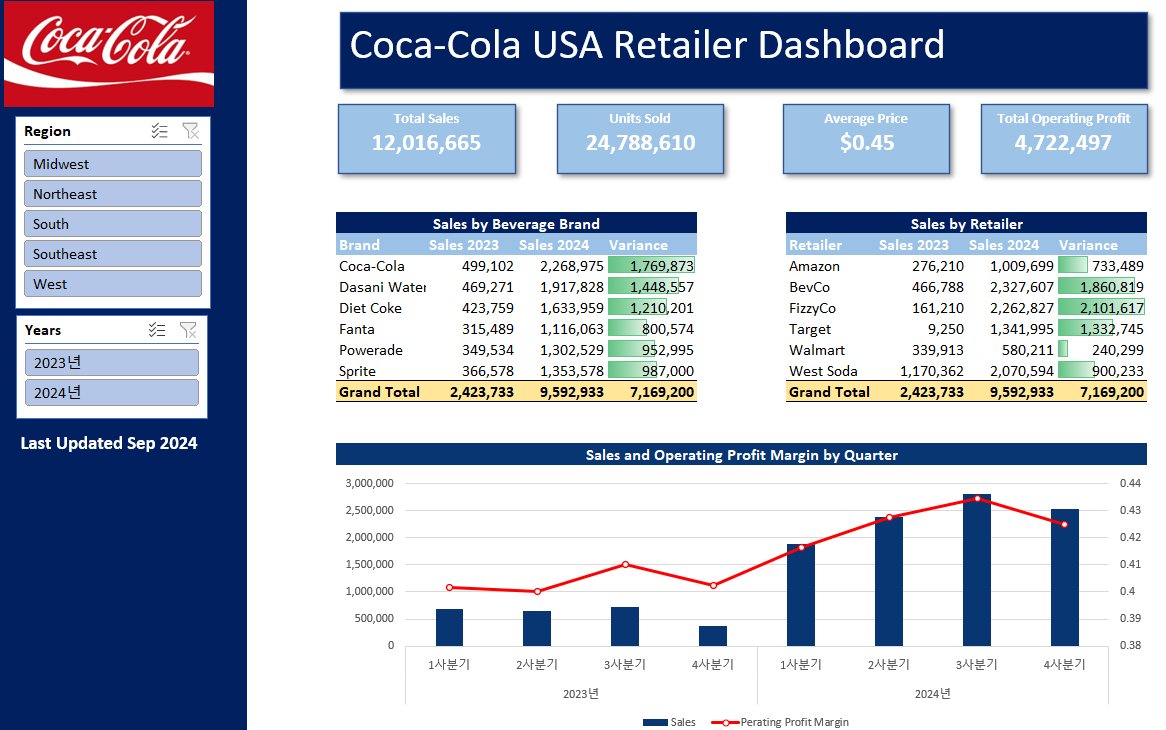
Data analysis dashboard practice using Excel
- Structure
- Analysis
- Visuals
- Slicers
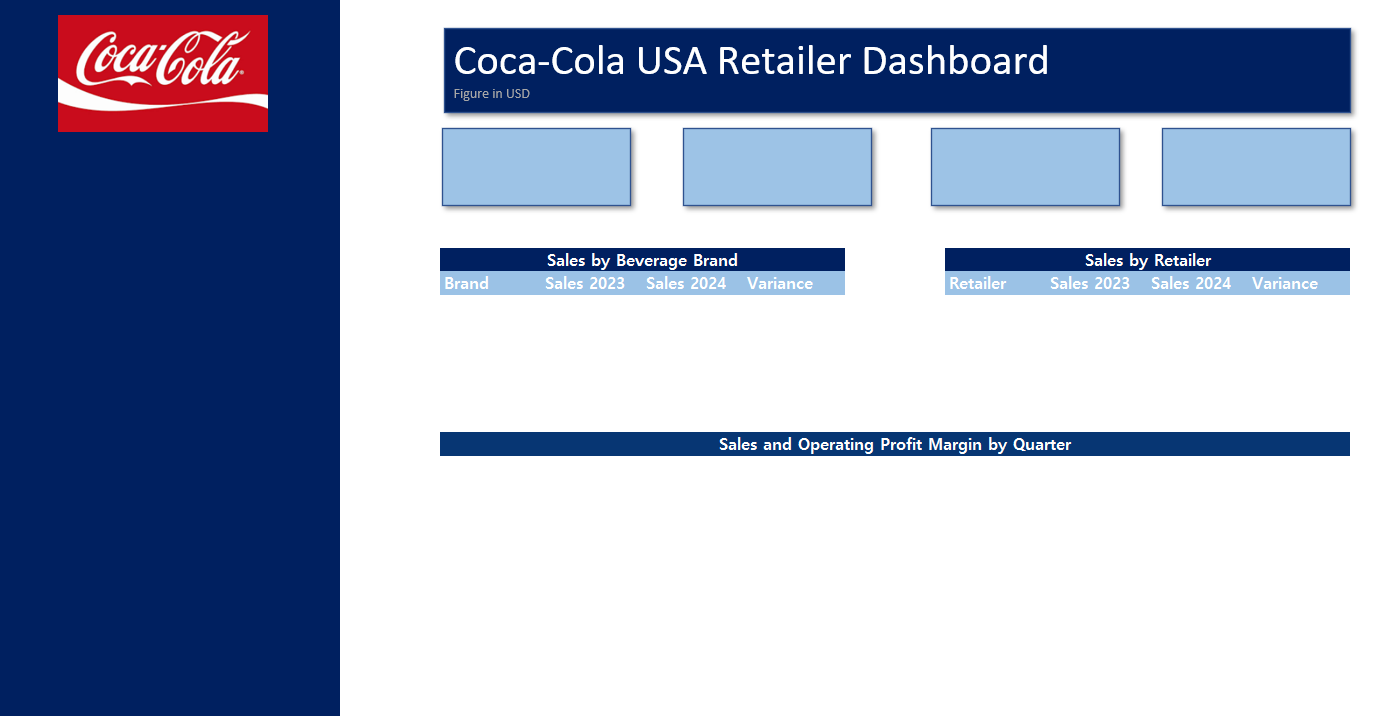
1. Structure
Setup the basic structure for dashboard
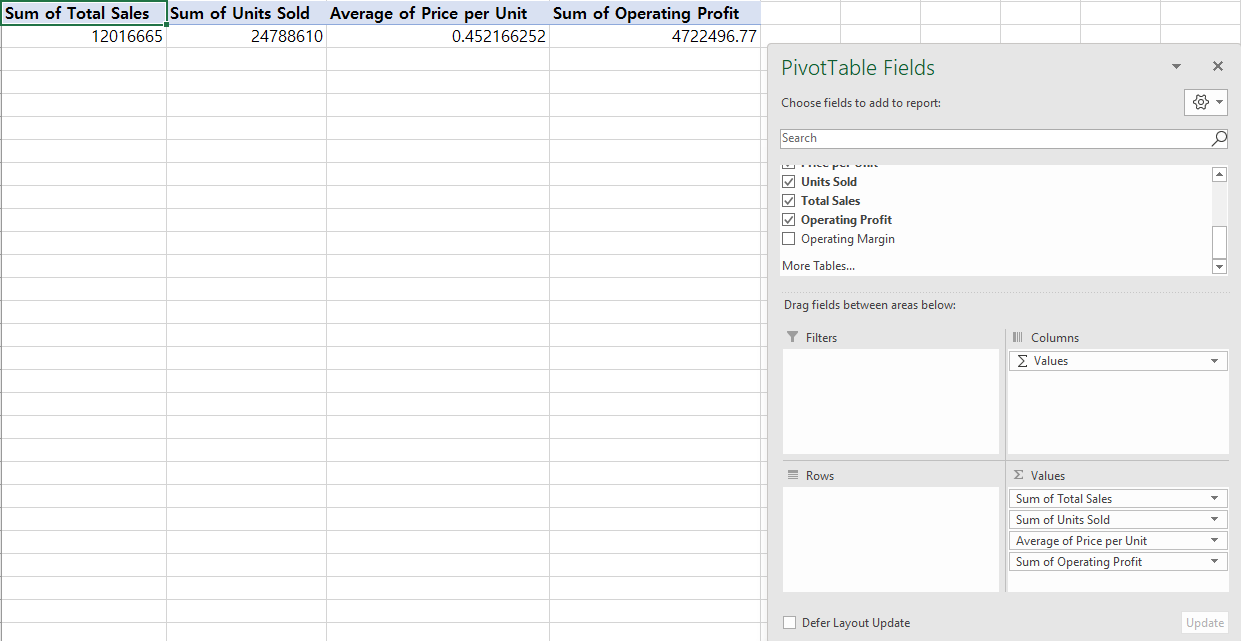
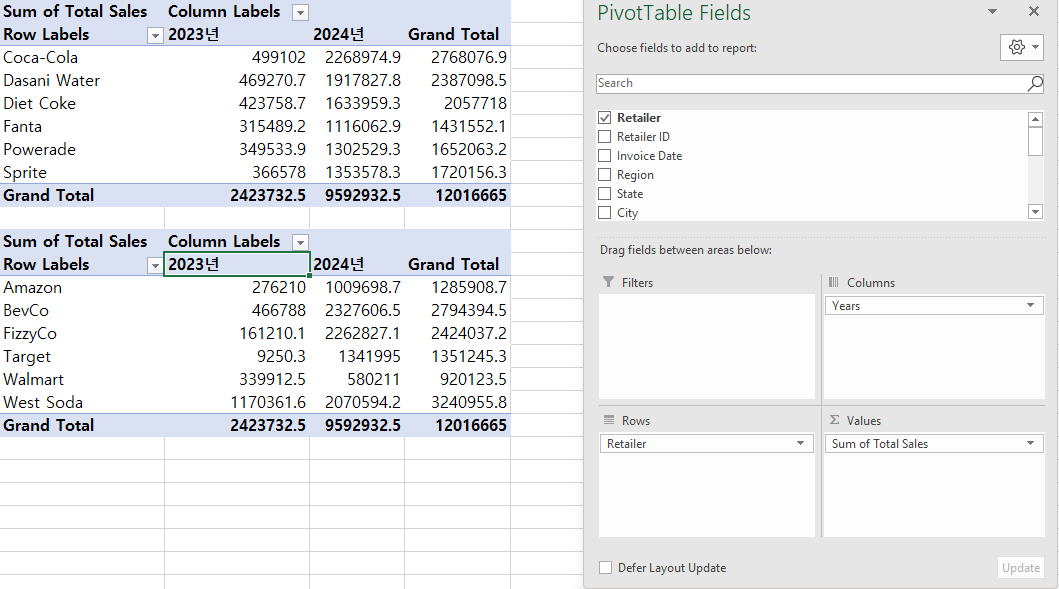
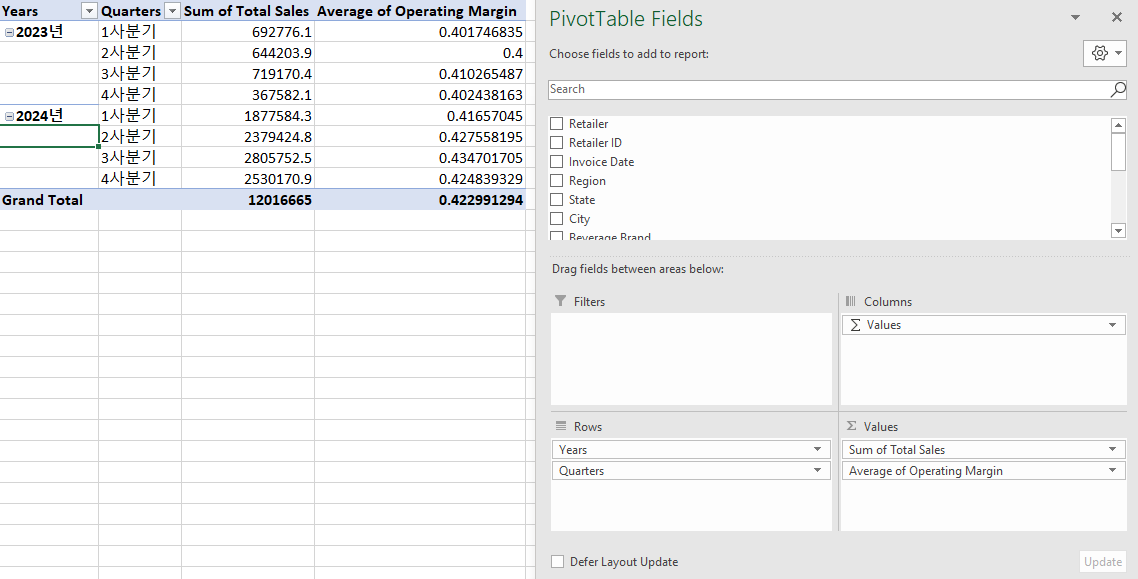
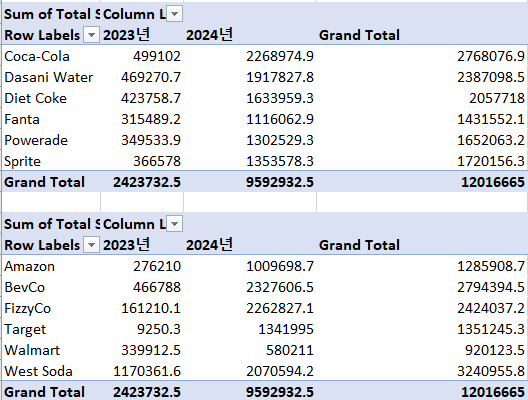
2. Analysis
Analysis with pivot table
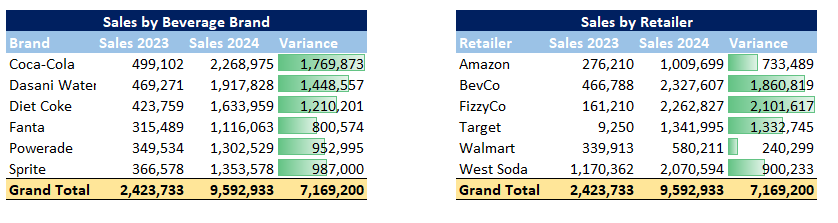
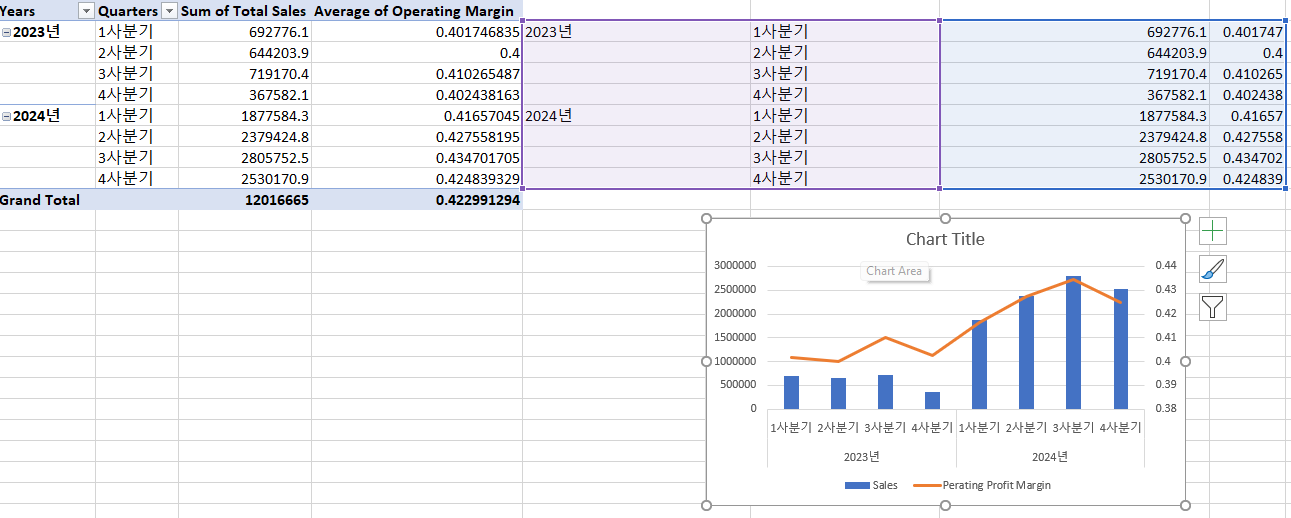
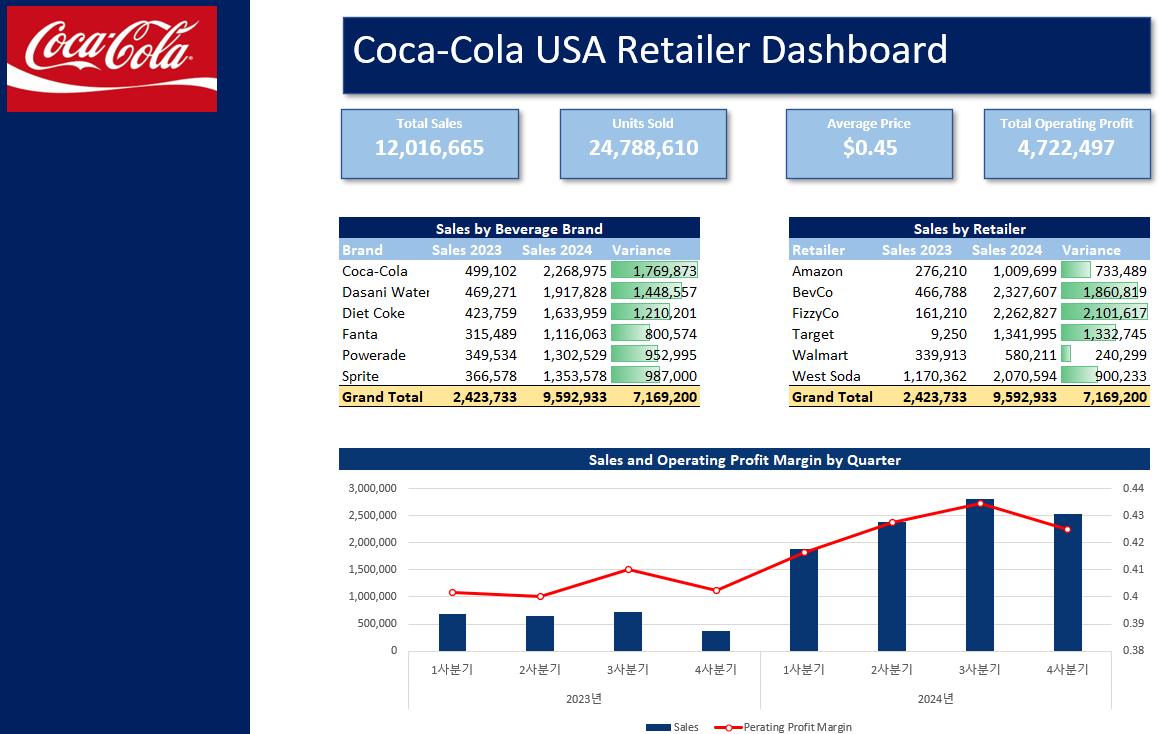
3. Visuals
Visual representation through charts and tables
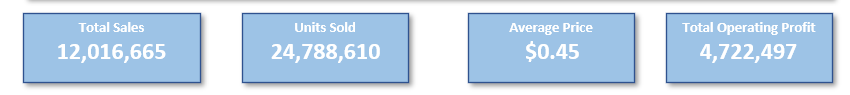
1.Sales
- KPI's

- Sales and margin chart
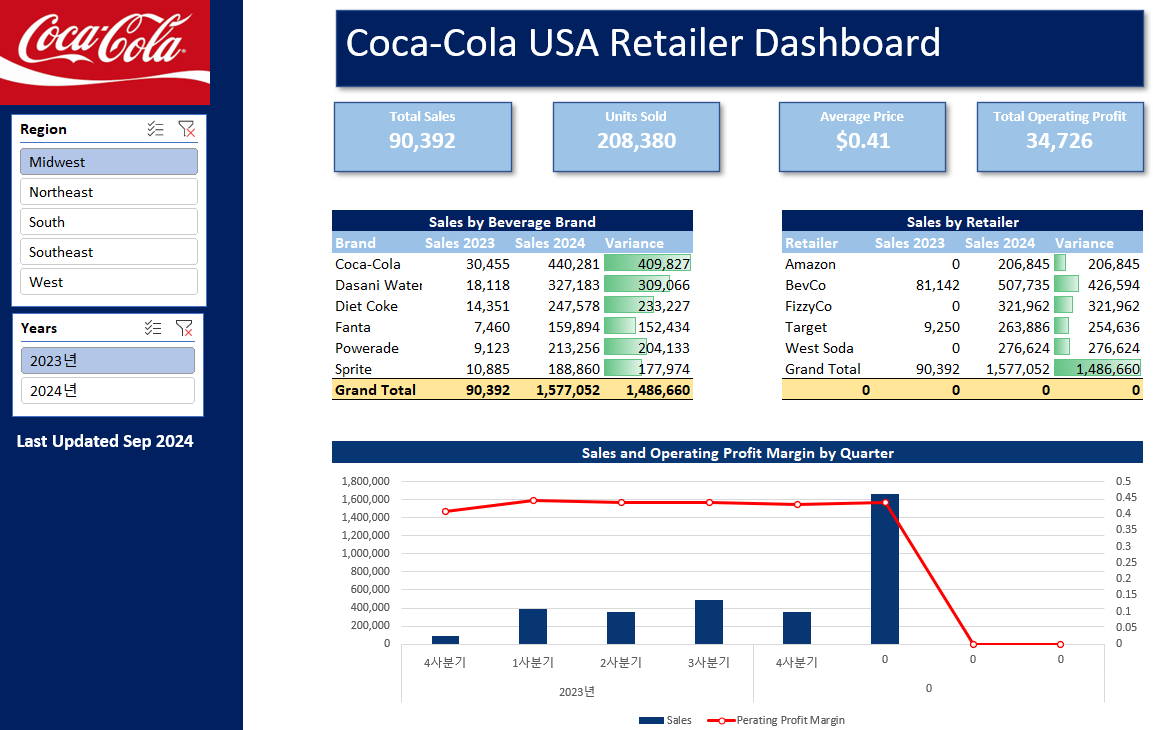
4. Adding slicers
Make dashboard more dynamic
Region - Midwest
Region - South
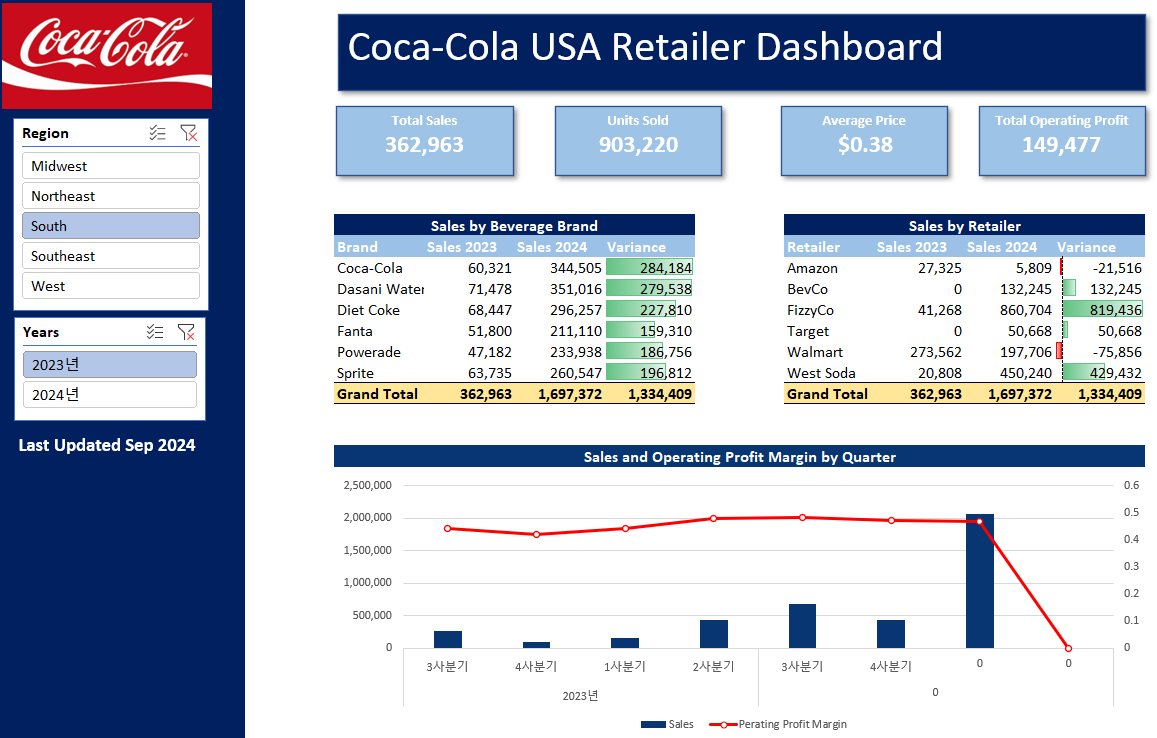
Region - South
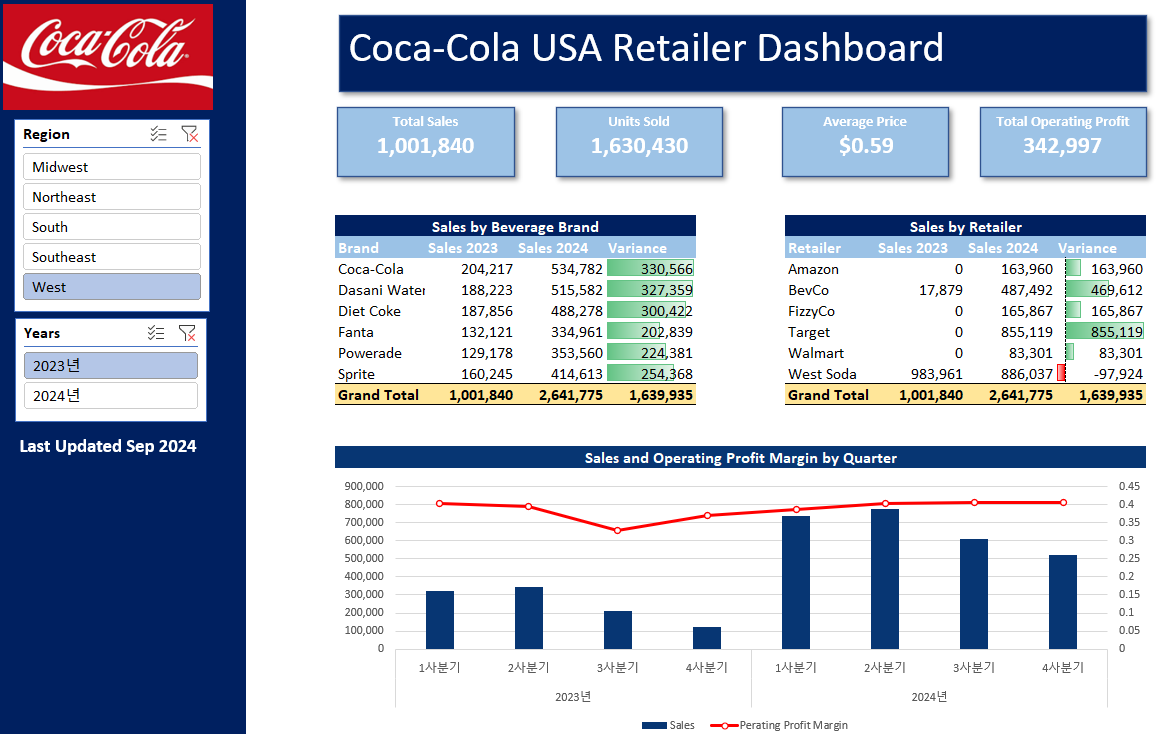
default (all regions and all years)

Full of adventure