1. 데이터 정리
- 수집한 데이터들을 pandas 데이터 프레임으로 정리해주세요.
- 부가 정보 데이터는 셀프 여부와 마찬가지로 Y 또는 N 으로 저장해주세요
- 최종적으로 데이터 프레임에 들어가야할 컬럼은 총 14개로 아래와 같습니다
주유소명, 주소, 브랜드, 휘발유 가격, 경유 가격, 셀프 여부, 세차장 여부, 충전소 여부, 경정비 여부, 편의점 여부, 24시간 운영 여부, 구, 위도, 경도
1.페이지 접근
모듈 호출
from selenium.webdriver import ActionChains
from selenium.webdriver.common.by import By
from selenium import webdriver
페이지 접근
url = 'https://www.opinet.co.kr/searRgSelect.do'
driver = webdriver.Chrome()
driver.get(url)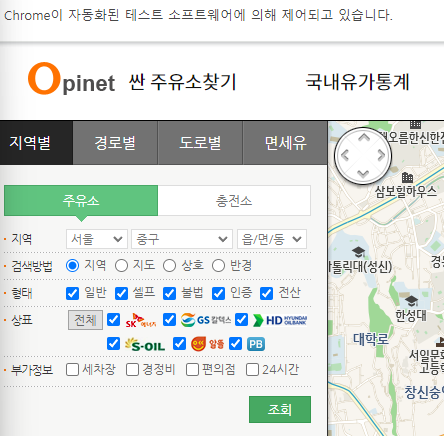
지역 - 서울 고정
sido_list_raw = driver.find_element(By.ID, 'SIDO_NM0')
sido_list_raw.send_keys('서울')
지역 - 구 데이터 가져오기
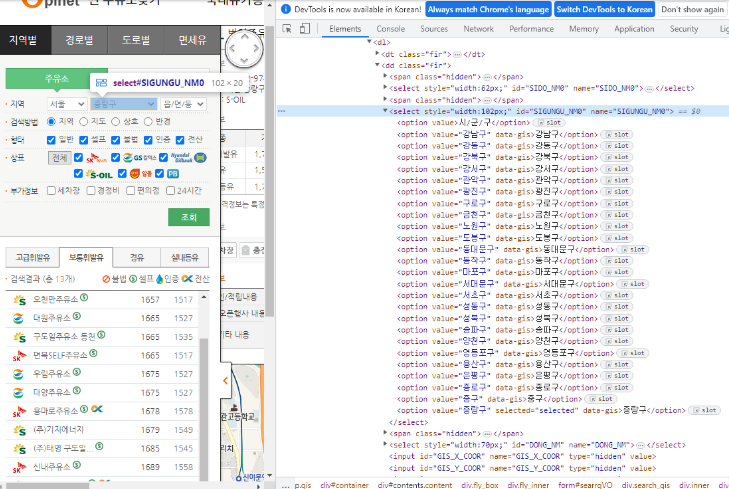
# 부모 태그 먼저 가져오기
gu_list_raw = driver.find_element(By.CSS_SELECTOR, '#SIGUNGU_NM0')
# 자식 태그 가져오기
gu_list = gu_list_raw.find_elements(By.TAG_NAME, 'option')
# for() : 하나씩 정보 가져오기
gu_names = [option.get_attribute('value')for option in gu_list]
gu_names = gu_names[1:] # 맨 앞 공백 1개 빼기 위해
gu_names구 검색
gu_list_raw = driver.find_element(By.ID, 'SIGUNGU_NM0')
gu_list_raw.send_keys(gu_names[0])
2.DataFrame으로 만들기
필요 모듈 호출
import pandas as pd
import time
import googlemaps
import warnings
from bs4 import BeautifulSoup

from tqdm import tqdm_notebook
from selenium.webdriver.common.by import By

warnings.simplefilter(action='ignore', category=FutureWarning)

gmaps_key = '할당받은 개인 키'
gmaps = googlemaps.Client(key = gmaps_key)
저장 공간 만들기
# (1) 브랜드
brandList =[]

# (2) 주유소명
nameList =[]

# (3) 구
gu_locationList =[]

# (4) 주소
addressList =[]

# (5) 휘발유 가격
gasoline_priceList =[]

# (6) 경유 가격
diesel_priceList =[]

# (7) 셀프 여부
selfList =[]

# (8) 세차장 여부
car_washList =[]

# (9) 충전소 여부
chargingList =[]

# (10) 경정비 여부
maintenanceList =[]

# (11) 편의점 여부
storeList =[]

# (12) 24시간 운영 여부
hours24List =[]
데이터 수집
for gu in tqdm_notebook(gu_names):
    # 구 검색
    element = driver.find_element(By.ID, 'SIGUNGU_NM0')
    element.send_keys(gu)
    time.sleep(3)

    html = driver.page_source
    soup = BeautifulSoup(html, 'html.parser')

    # 검색할 주유소 개수
    cnt = int(driver.find_element(By.ID, 'totCnt').text)

    for i in range(1, cnt+1):

        # 각 주유소 클릭
        station = driver.find_element(By.CSS_SELECTOR, f'#body1 > tr:nth-child({i}) > td.rlist > a')
        station.click()
        # time.sleep(1)

        html = driver.page_source
        soup = BeautifulSoup(html, 'html.parser')

        data = soup.select('#os_dtail_info')[0]

        # 브랜드
        brandList.append(data.select_one('#poll_div_nm').text)

        # 주유소명
        nameList.append(data.select_one('.header').text.strip())

        # 구
        gu_locationList.append(gu)

        # 주소
        addressList.append(data.select_one('#rd_addr').text)

        # 휘발유 가격
        gasoline_priceList.append(data.select_one('#b027_p').text)

        # 경유 가격
        diesel_priceList.append(data.select_one('#d047_p').text)

        # 셀프
        slf = data.select_one('#SPAN_SELF_VLT_YN_ID')
        if type(slf.find('img')) == type(None):
            selfList.append('N')
        else:
            selfList.append('Y')

        # 세차
        cswh = data.select_one('#cwsh_yn')['src']
        if 'off' in cswh:
            car_washList.append('N')
        else:
            car_washList.append('Y')

        # 충전소
        charge = data.select_one('#lpg_yn')['src']
        if 'off' in charge:
            chargingList.append('N')
        else:
            chargingList.append('Y')

        # 경정비
        maint = data.select_one('#maint_yn')['src']
        if 'off' in maint:
            maintenanceList.append('N')
        else:
            maintenanceList.append('Y')

        # 편의점
        cvs = data.select_one('#cvs_yn')['src']
        if 'off' in cvs:
            storeList.append('N')
        else:
            storeList.append('Y')

        # 24시 영업
        sel24 = data.select_one('#sel24_yn')['src']
        if 'off' in sel24:
            hours24List.append('N')
        else:
            hours24List.append('Y')

data = {
        "brand" : brandList,
        "name" : nameList,
        "location(gu)" : gu_locationList,
        "address" : addressList,
        "gasoline_price" : gasoline_priceList,
        "diesel_price" : diesel_priceList,
        "self" : selfList,
        "car_wash" : car_washList,
        "charging" : chargingList,
        "maintenance" : maintenanceList,
        "store" : storeList,
        "hours24" : hours24List
}
df = pd.DataFrame(data)
df.head()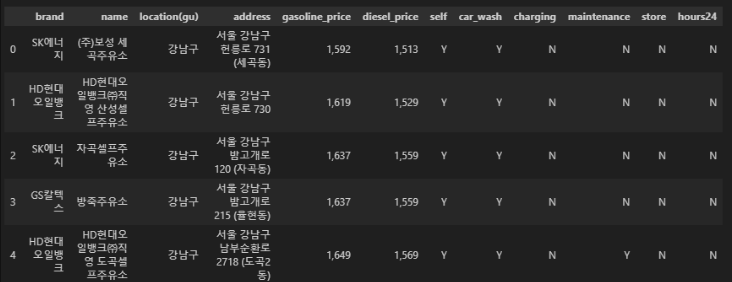
위도와 경도 추가
latList = []
lngList = []

for idx, row in df.iterrows():
    address = row["address"]
    gmaps_output = gmaps.geocode(address)
    temp_lat = gmaps_output[0]["geometry"]["location"]["lat"]
    temp_lng = gmaps_output[0]["geometry"]["location"]["lng"]

    latList.append(temp_lat)
    lngList.append(temp_lng)

df["lat"] = latList
df["lng"] = lngList
df.head()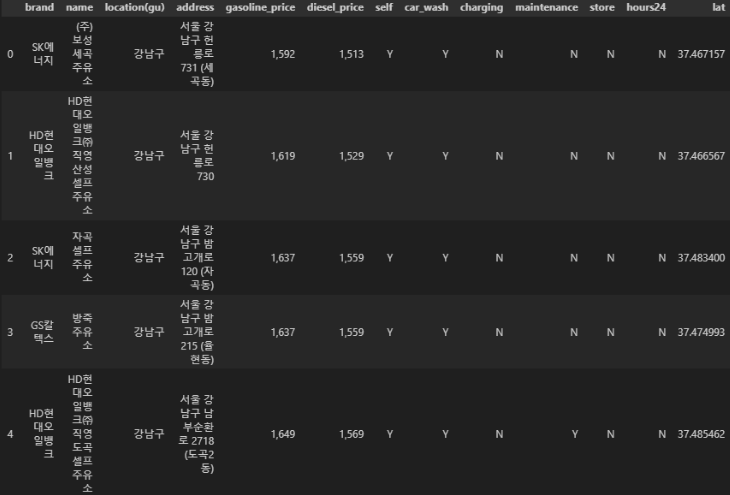
가격 데이터 타입 변환 (object타입 -> float)
def price_float(price):
price = price.replace(',', '')
price = float(price)
return price
df['gasoline_price'] = df['gasoline_price'].apply(price_float)
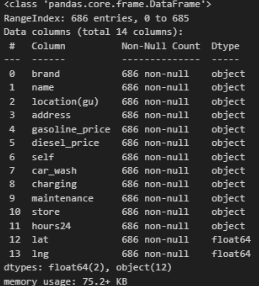
df['diesel_price'] = df['diesel_price'].apply(price_float)확인
df.info()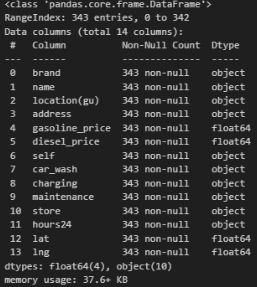
인덱스 재정렬 그리고 컬럼 삭제
df.reset_index(inplace=True)
df.tail(1)
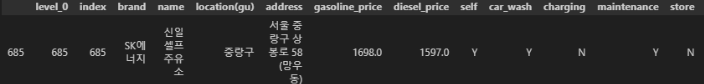
del df['index']
del df['level_0']
df.tail(1)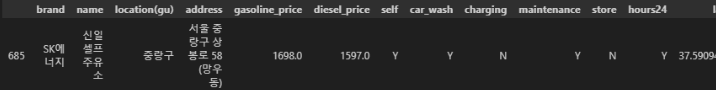
저장
gas_station = pd.DataFrame(df)
gas_station.to_csv('gas_station.csv', index = False, encoding='utf-8')
드라이브 종료
driver.quit()2. 시각화 후 비교 및 분석
- 휘발유와 경유 가격이 셀프 주유소에서 정말 저렴한지 분석 결과를 작성.
필요한 모듈 호출
import matplotlib.pyplot as plt
import seaborn as sns
import platform
from matplotlib import font_manager, rc

get_ipython().run_line_magic("matplotlib", "inline")
%matplotlib inline

path = "C:/Windows/Fonts/malgun.ttf"

rc("font", family="Malgun Gothic")
시각화 - 휘발유 가격 비교 (gasoline_price)
boxplot
휘발유 가격 단순 비교 - 셀프가 더 저렴한 것 확이 가능
  plt.figure(figsize=(7,7))
  sns.boxplot(x='self', y='gasoline_price', data=df, palette='Set2')
  plt.grid(True)
  plt.title("셀프 - 휘발유 가격 단순 비교")
  plt.show()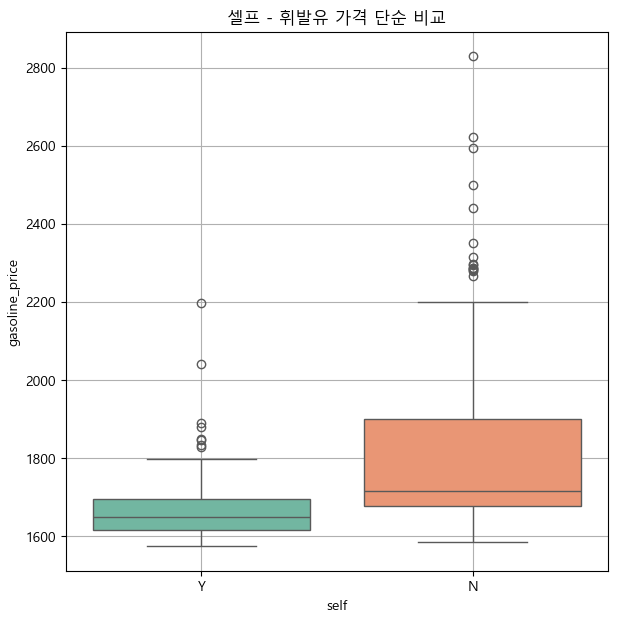
브랜드별 비교 - 모든 브랜드에서 겔프가 더 저렴한 것을 확인 가능
plt.figure(figsize=(7,4))
sns.boxplot(x='brand', y='gasoline_price',  hue='self',data=df, palette='Set3')
plt.grid(True)
plt.title("셀프 여부에 따른 브랜드별 휘발유 가격")
plt.show()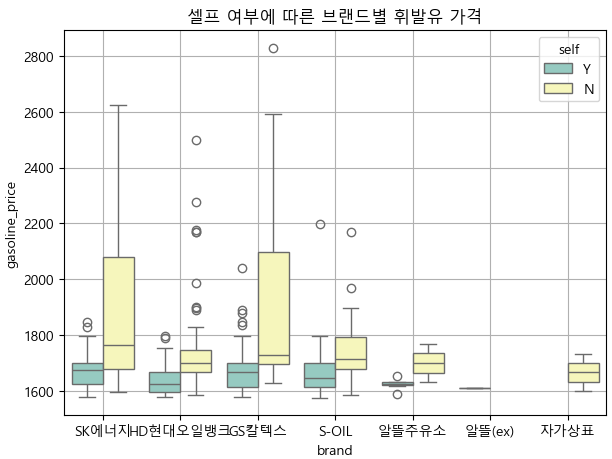
지역별 비교 - 특정 지역 몇 지역(금천,서대문,서초)는 휘발유의 중간가격이 비슷했지만 그 외지역은 셀프가 더 저렴한 것 확인 가능
plt.figure(figsize=(12,4))
sns.boxplot(x='location(gu)', y='gasoline_price',  hue='self',data=df, palette='Set3')
plt.grid(True)
plt.title("셀프 여부에 따른 지역(구)별 휘발유 가격")
plt.xticks(rotation=90) # 이름이 겹치지 않고 세로로 세워지게 하는 기능
plt.show()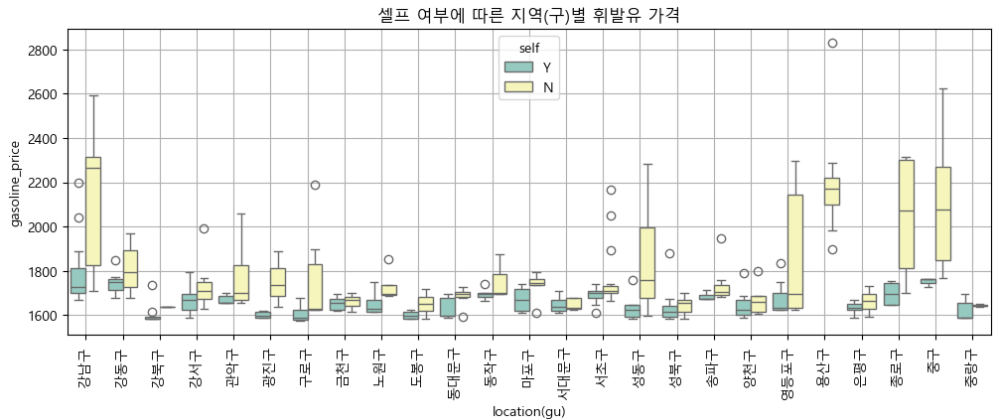
시각화 - 경유 가격 비교 (diesel_price)
boxplot
경유 가격 단순 비교 - 셀프가 더 저렴한 것 확이 가능
plt.figure(figsize=(5,5))
sns.boxplot(x='self', y='diesel_price', data=df, palette='Set1')
plt.grid(True)
plt.title("셀프 - 경유 가격 단순 비교")
plt.show()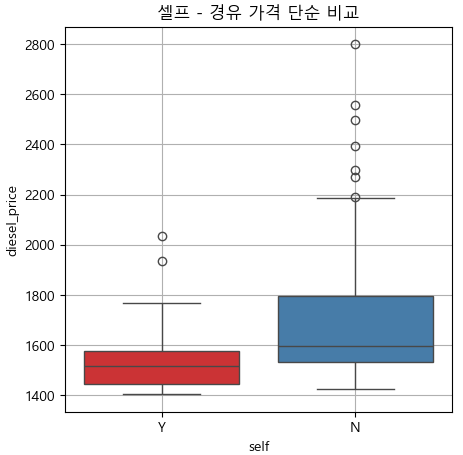
브랜드별 비교 - 모든 브랜드에서 셀프가 더 저렴한 것 확인 가능
plt.figure(figsize=(7,5))
sns.boxplot(x='brand', y='diesel_price',  hue='self',data=df, palette='Set1')
plt.grid(True)
plt.title("셀프 여부에 따른 브랜드별 경유 가격")
plt.show()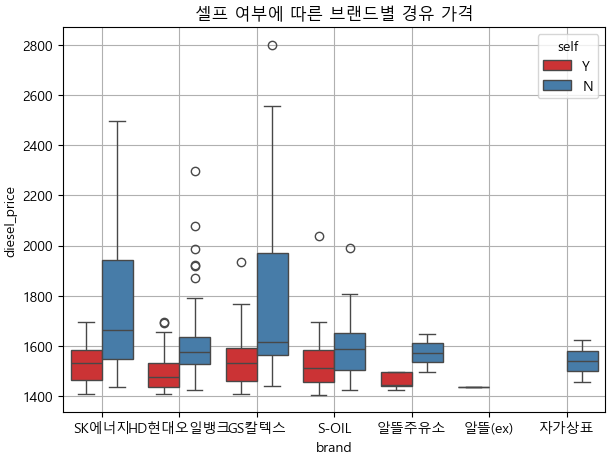
지역별 비교 - 특정 지역(서대문,성북,양천,은평)의 경유 중간 가격이 비슷하고 나머지 지역은 셀프가 더 저렴한 것 확인 가능
plt.figure(figsize=(12,4))
sns.boxplot(x='location(gu)', y='diesel_price',  hue='self',data=df, palette='Set1')
plt.grid(True)
plt.title("셀프 여부에 따른 지역(구)별 경유 가격")
plt.xticks(rotation=90) # 이름이 겹치지 않고 세로로 세워지게 하는 기능
plt.show()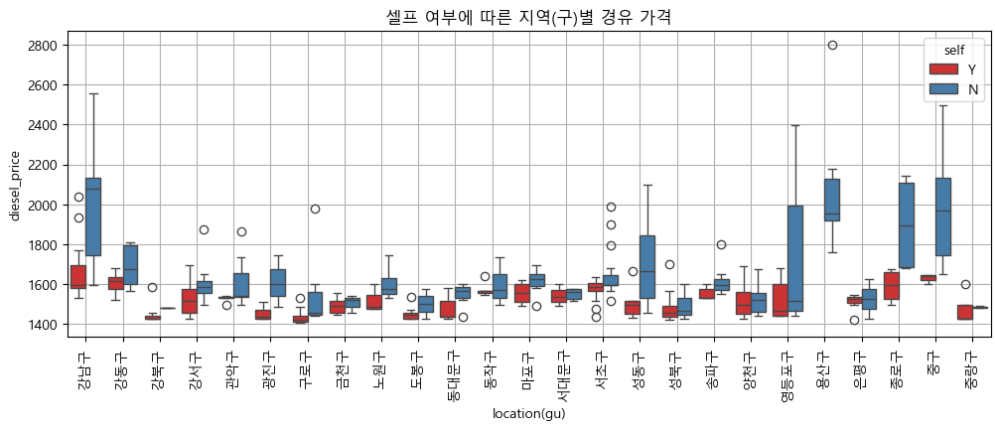
지역구별 평균 셀프 주유(휘발유와 경유)
필요 모듈 호출
import json
import folium
import numpy as np
셀프 주유 평균 가격 단순 비교 - 평균 가격도 셀프가 더 저렴한 것 확인 가능
df['gu_oil_self_avg'] = (df['gasoline_price'] + df['diesel_price']) / 2 sns.boxplot(x='self', y='gu_oil_self_avg', data=df, palette='Set1')
plt.grid(True)
plt.show()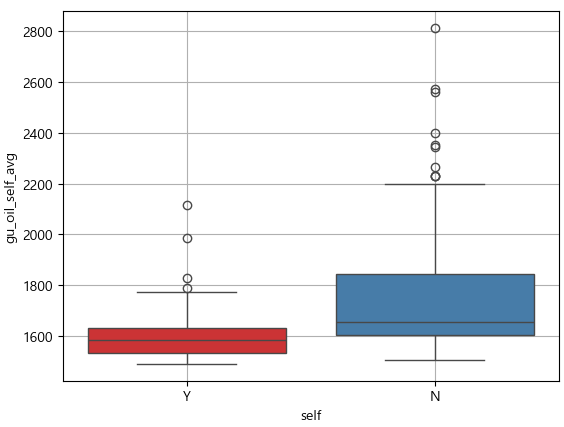
셀프 주유 매장수 단순 비교 - 셀프주유소 매장수(빨강)가 비교적 더 많은 것 확인 가능
geo_path = '../data/02. skorea_municipalities_geo_simple.json'
geo_str = json.load(open(geo_path, encoding='utf-8'))

my_map = folium.Map(location=[37.5502, 126.982], zoom_start=12, tiles='CartoDB positron')

for idx, rows in df.sort_values(by='gu_oil_self_avg', ascending=False).iterrows():
    if rows['self'] == 'Y':
        osColor = 'red'

    elif rows['self'] == 'N':
        osColor = 'black'

    folium.Circle(
        location = [rows['lat'], rows['lng']],
        radius=1,
        color=osColor,
    ).add_to(my_map)
my_map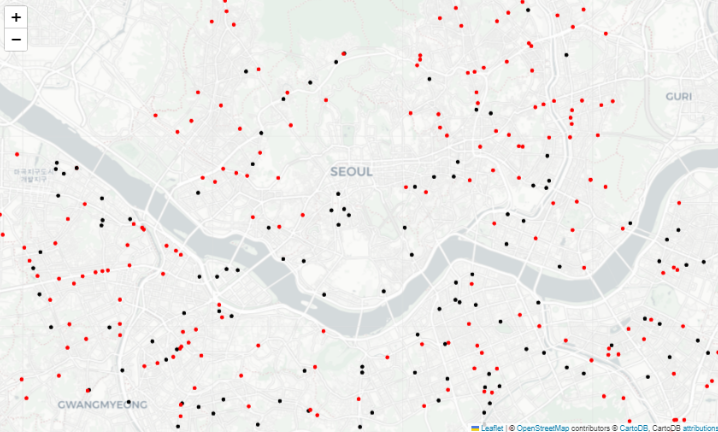

Full of adventure