다양한 형태의 그래프를 통해서 데이터 시각화를 할 수 있는 라이브러리
설정
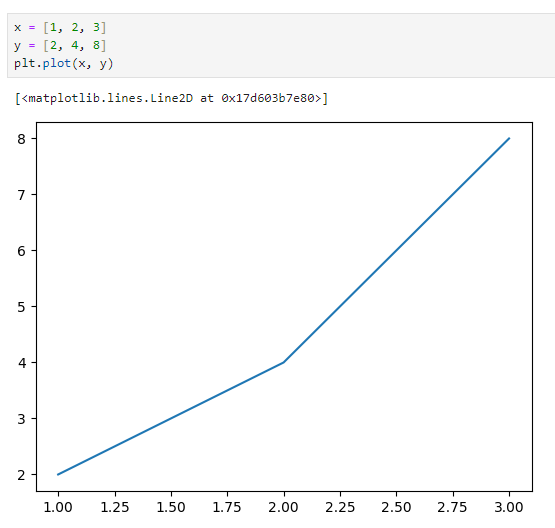
import matplotlib.pyplot as plt
# import matplotlib.font_manager as fm
# fm.fontManager.ttflist # 사용 가능한 폰트 목록
import matplotlib
matplotlib.rcParams["font.family"] = "Malgun Gothic"
matplotlib.rcParams["font.size"] = 15
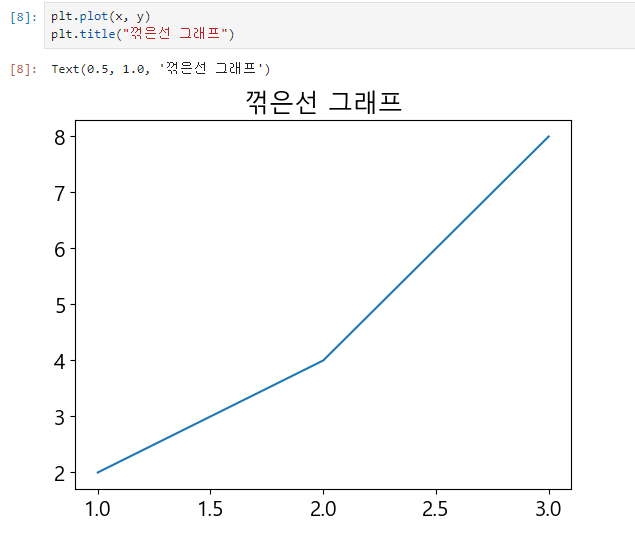
matplotlib.rcParams["axes.unicode_minus"] = False기본 그래프

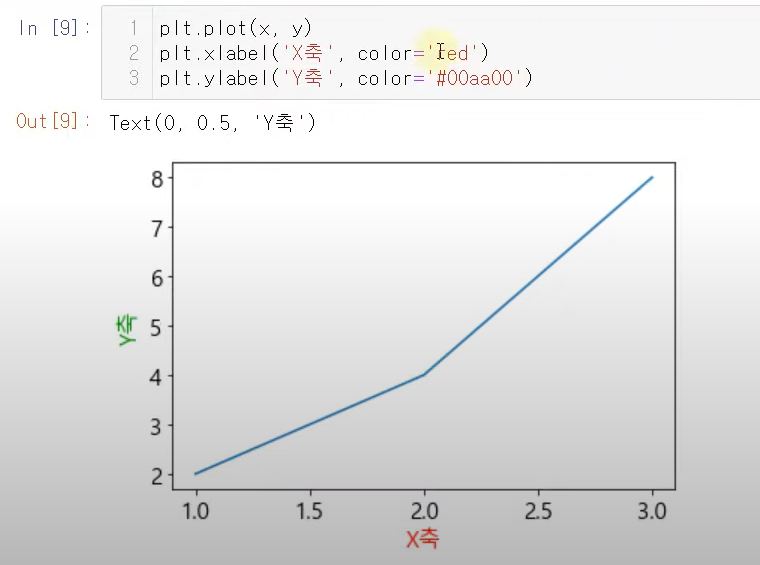
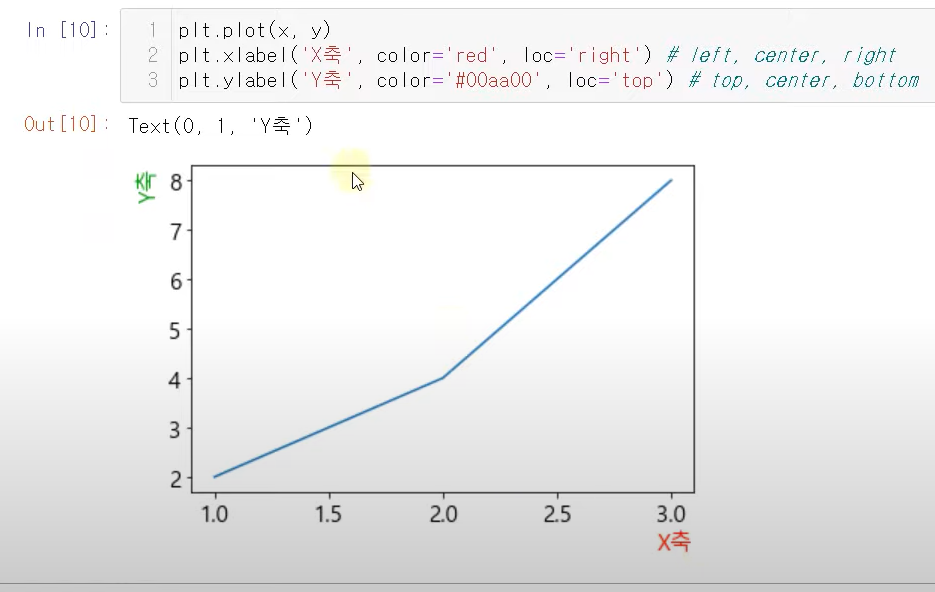
축
xlabel/ ylabel
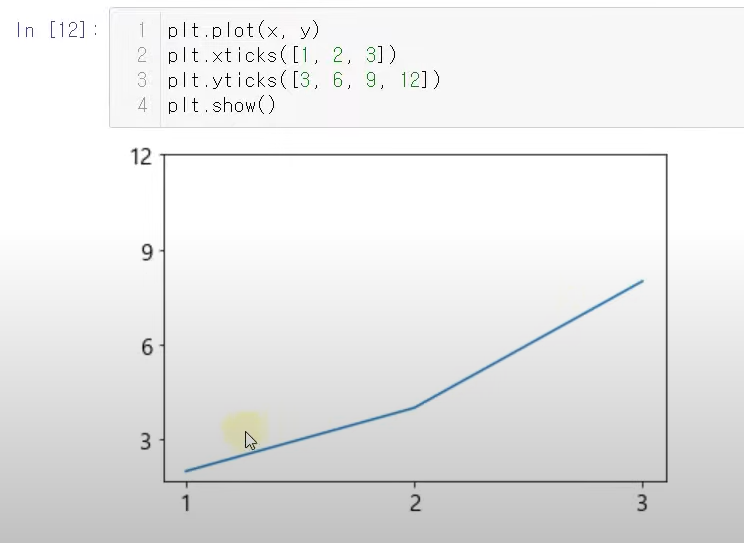
xticks/ yticks
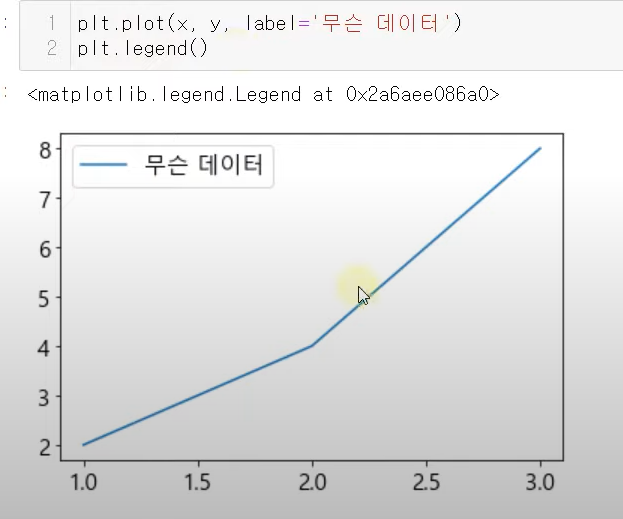
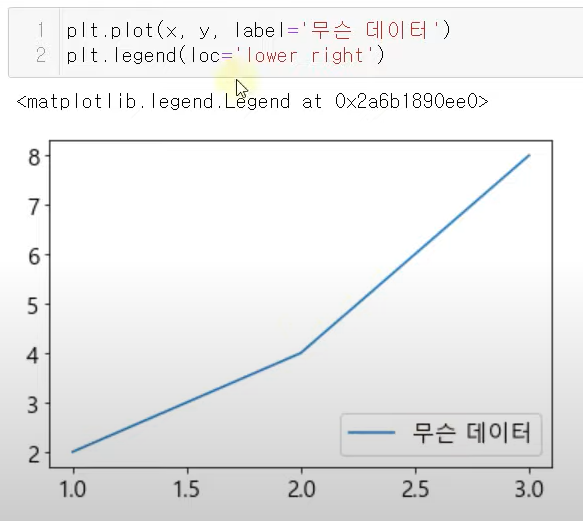
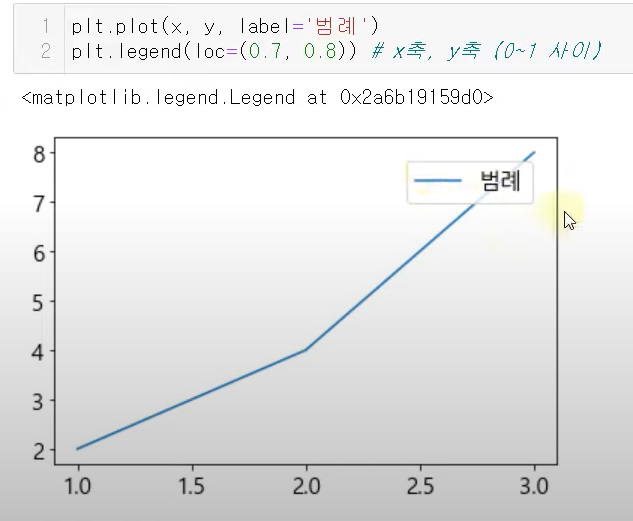
범례
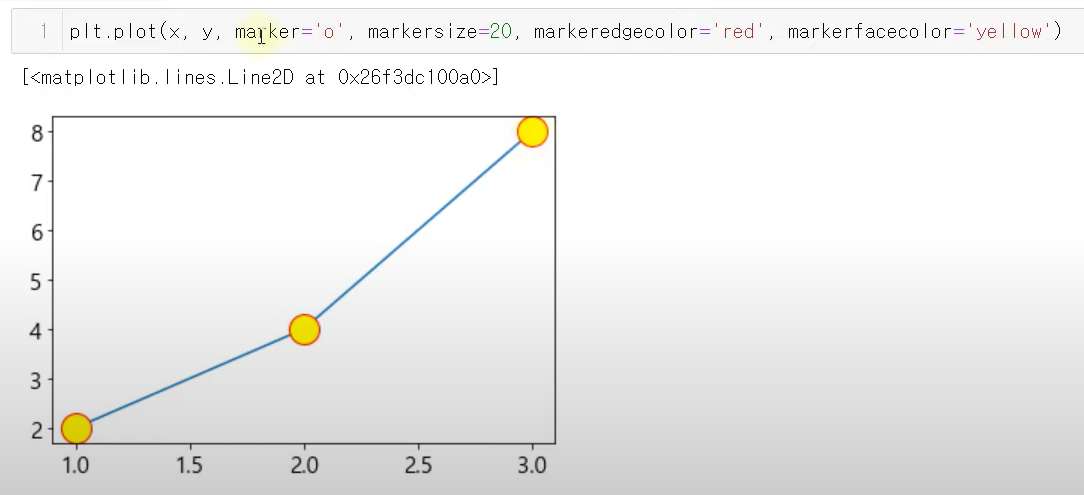
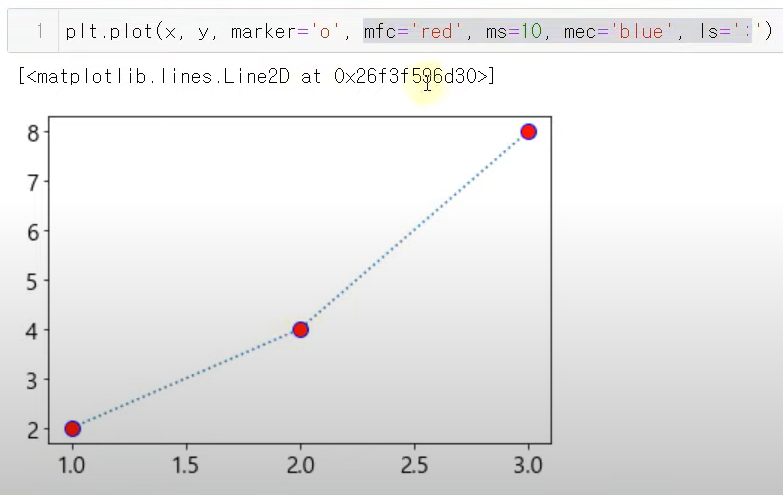
스타일
marker : 그래프 마커(o, v, x 등등)
linestyle :
None선없애기,:점선,--좀 더 두꺼운 점선,-.점선 번갈아서,-실선
linewidth : 그래프 굵기
color : 선 색 지정
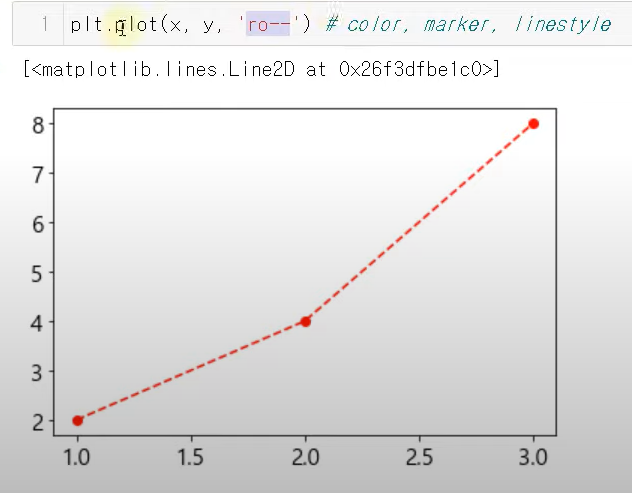
축약
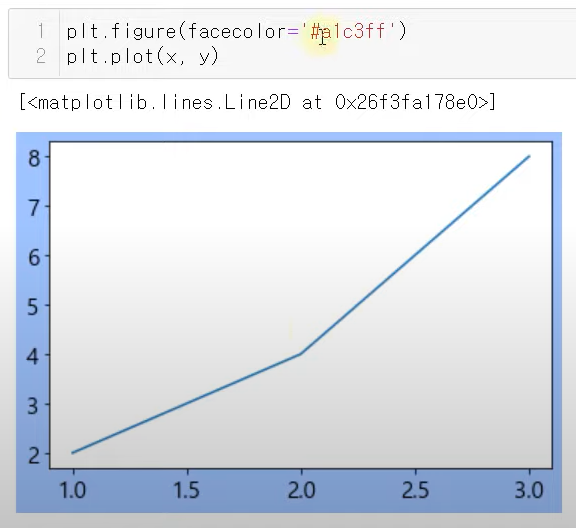
배경
파일저장
plt.savefig("파일명", dip = 100) # dip 크기 지정텍스트
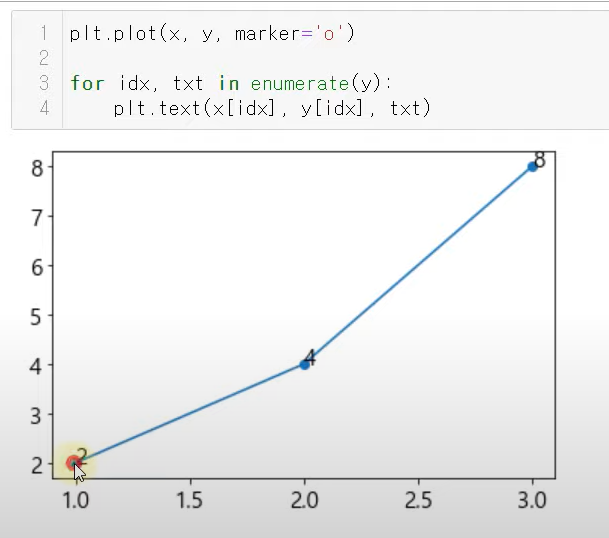
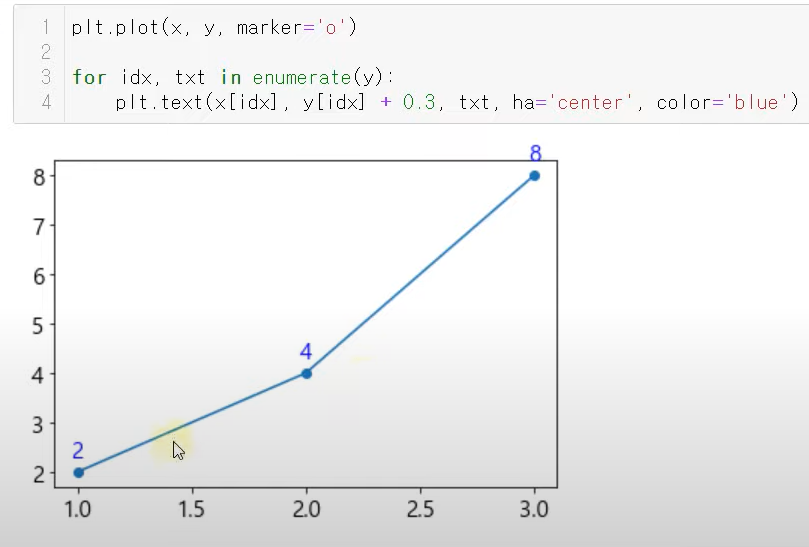
여러 데이터

개발자 꿈나무