Pipeline : 데이터 수집, 전처리, 모델학습, 학습 모델 배포, 예측 등 머신러닝의 전체 과정을 순차적으로 한 과정에 처리하는 일련의 프로세스
- 코드를 하나씩 실행해보면서 머신러닝을 진행하다보면 혼돈이 발생할 수 있다
- 데이터의 전처리와 여러 알고리즘의 반복 실행, 하이퍼 파라미터의 튜닝 과정을 번갈아 하다보면
- 코드의 싱행 순성에 혼선 발생 가능
- 상기 사항들을 극복하기 위하여 한 과정에 처리하는 sklearn의 Pipeline 사용
- 여기선 StandardScaler를 적용하여 DecisionTree까지 한번에 만드는 방법
와인데이터 불러오기 및 전처리
import pandas as pd

red_url = 'https://raw.githubusercontent.com/PinkWink/ML_tutorial/master/dataset/winequality-red.csv'
white_url = 'https://raw.githubusercontent.com/PinkWink/ML_tutorial/master/dataset/winequality-white.csv'

red_wine = pd.read_csv(red_url, sep=';')
white_wine = pd.read_csv(white_url, sep=';')

red_wine['color'] = 1
white_wine['color'] = 0

wine = pd.concat([red_wine, white_wine])

X = wine.drop(['color'], axis = 1) # feature
y = wine['color'] # label

# color에 따라 와인을 구별할 것으로 feature 데이터 에서는 color 컬럼을 삭제하고 label 데이터에서는 color 컬럼만 지정해준다
Pipeline 구현
from sklearn.pipeline import Pipeline
from sklearn.tree import DecisionTreeClassifier
from sklearn.preprocessing import StandardScaler

estimators = [
    ('scalar', StandardScaler()),
    ('clf', DecisionTreeClassifier())
]

pipe = Pipeline(estimators)

pipe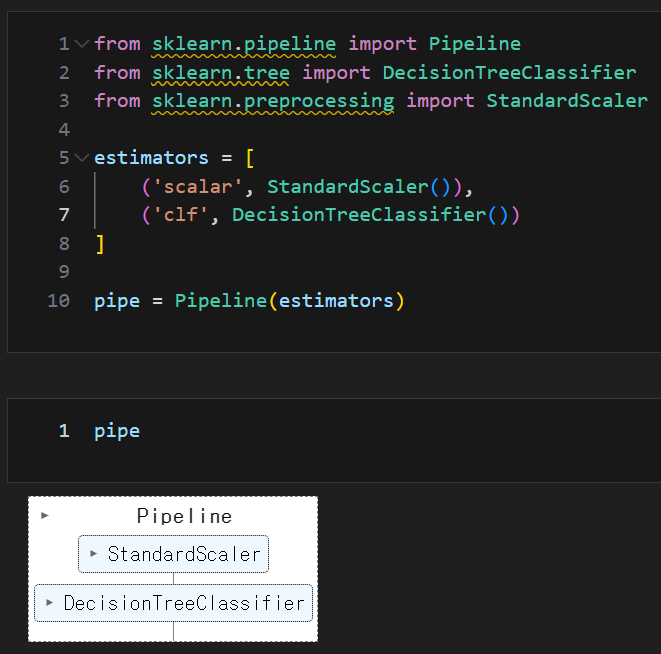
pipeline.steps
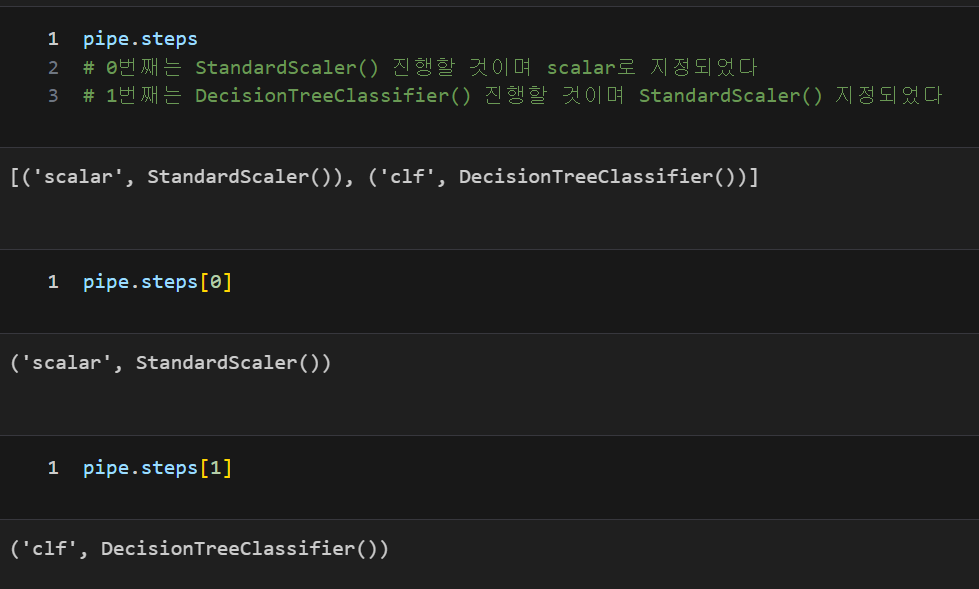
스탭별로 객체 호출(각 기능을 각각 호출해서 사용 가능)
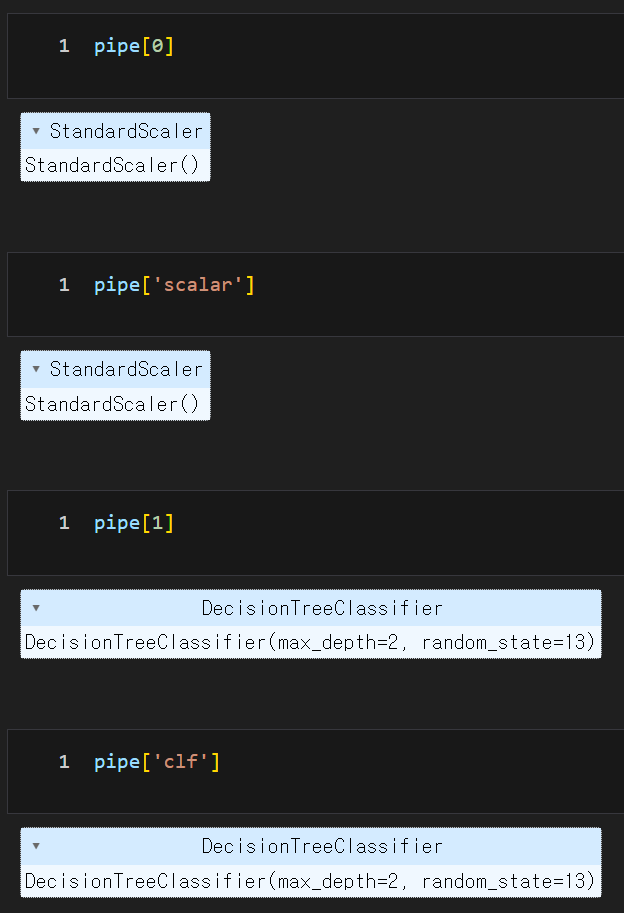
각 스탭별 속성 지정
setparams('스탭이름' + _ _(언더바 2개) + 속성설정)
pipe.set_params(clf__max_depth = 2)
pipe.set_params(clf__random_state = 13)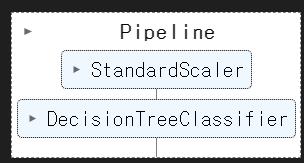
pipeline을 이용한 결정나무(DecisionTree) 훈련 및 학습 결과
학습
from sklearn.model_selection import train_test_split

X_train, X_test, y_train, y_test = \
    train_test_split(X, y, test_size=0.2,
                     random_state =  13, stratify=y)
                                        # stratify= : 나눈 데이터에 속성 값들을 동일한 비율로 맞춰주는 설정

pipe.fit(X_train, y_train)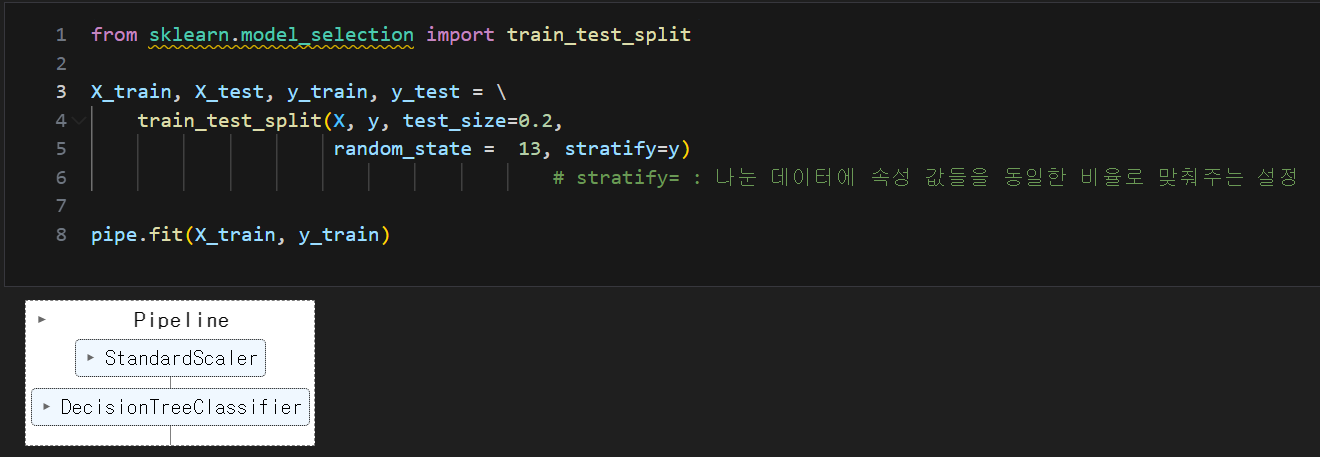
예측 및 결과
from sklearn.metrics import accuracy_score

y_pred_tr = pipe.predict(X_train)
y_pred_test = pipe.predict(X_test)

print('Train ACC : ', accuracy_score(y_train, y_pred_tr))
print('Test ACC : ', accuracy_score(y_test, y_pred_test))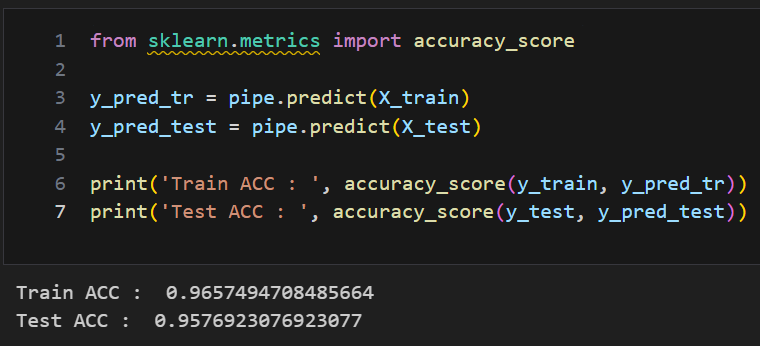
시각화
import matplotlib.pyplot as plt
from sklearn.tree import plot_tree

plt.figure(figsize=(8, 8))
feature_names_list= X.columns.tolist()
plot_tree(pipe['clf'], feature_names=feature_names_list,
               rounded=True, filled=True)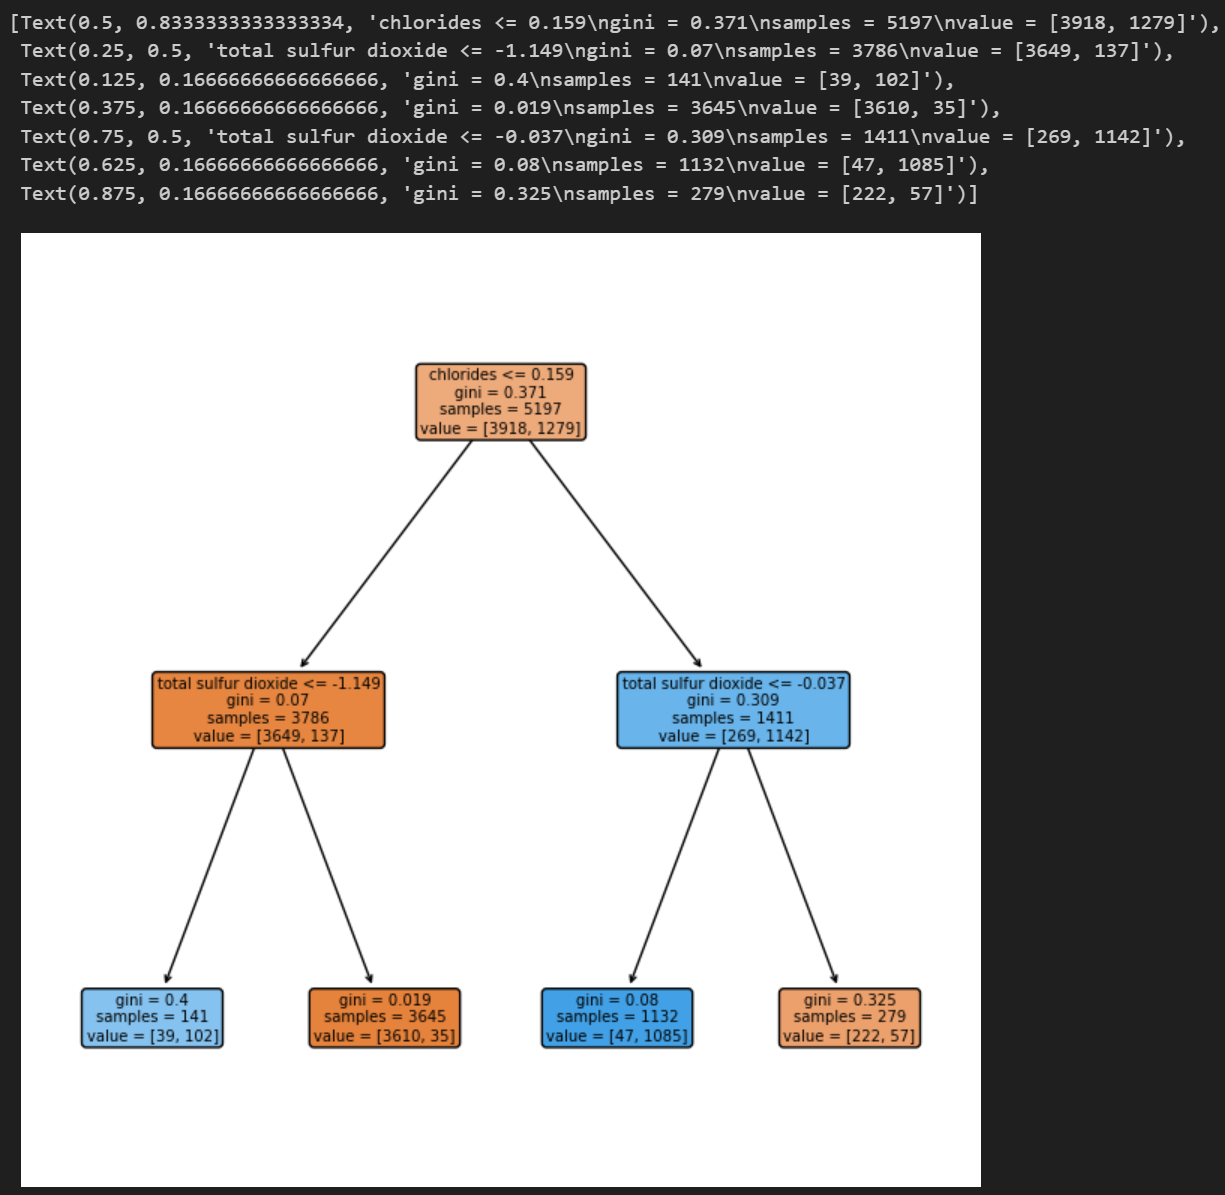

비전공 데이터 분석가 도전