시계열 자료
시계열 분석 개요
- 연도별, 분기별, 월별, 일별 ,시간별 등 시간의 흐름에 따라 순서대로 관측
- 예) 국내총생산, 물가지수,판매량, 종합주가지수,강우량,태양 흑점수, 실험 및 관측자료 등
- 시간 단위 외에도 사회적 변화나 환경정 변동요인을 기준으로 시계열 자료를 구분하는 경우가 있다.
- 일반적으로 시계열 자료는 추세변동, 순환변동, 계절변동, 불규칙변동 요
인으로 구성된다. - 시계열들은 생성되는 특성에 따라 연속적으로 생성되는 연 속시계열
(continuous time series)과 이산적 시점에서 생성 되는 이산시계열(discrete
time series)로 구분할 수 있음. - 실제로는 많은 시계열들이 연속적으로 생성되고 있지만 일정한 시차를
두고 관측되므로 이산시계열의 형태를 지니는 경우가 많음.
▪ 시계열자료(time series data)들은 시간의 경과에 따라 관측
된 자료이므로 시간에 영향을 받음.
- 시계열자료를 분석할 때 관측시점들 간의 시차(time lag)가 중요한
역할을 함.
▪ 시계열분석(time series analysis)의 목적
- 과거 시계열자료의 패턴(pattern)이 미래에도 지속적으로 유지된다
는 가정하에서 현재까지 수집된 자료들을 분석하여 미래에 대한 예
측(forecast)을 한다. - 시계열자료를 분석할 때 관측시점들 간의 시차(time lag)가 중요한
역할을 한다. - 시계열자료가 생성된 시스템 또는 확률과정을 모형화하여 시스템 또
는 확률과정을 이해하고 제어(control)할 수 있도록 한다.
시계열의 형태
• 불규칙변동(irregular variation 또는 확률적 변동 : random variation)은
시계열자료에서 시간에 따른 규칙적인 움직임과는 달리 어떤 규칙성이
없이 예측이 불가능하게 우연적으로 발생하는 변동을 말함.
예 : 전쟁, 홍수, 화재, 지진, 파업 등
• 체계적 변동에는 장기간에 걸쳐 어떤 추세로 나타나는 추세 변동(trend
variation), 추세선을 따라 주기적으로 오르고 내림을 반복하는
순환변동(cyclical variation), 그리고 계절적 요인이 작용하여 1년 주기로
나타나는 계절변동(seasonal variation)이 있음.
추세변동(trend variation)
• 추세변동이란 시계열자료가 갖는 장기적인 변화추세임.
• 추세란 장기간에 걸쳐 지속적으로 증가 또는 감소하거나 또는 일정한 상태(stationary)
를 유지하려는 성향을 의미함.
import numpy as np
import pandas as pd
# DatetiemIndex
dates = pd.date_range('2020-01-01', periods=48, freq='M')

# additive model: trend + cycle + seasonality + irregular factor
timestamp = np.arange(len(dates))
trend_factor = timestamp*1.1
cycle_factor = 10*np.sin(np.linspace(0, 3.14*2, 48))
seasonal_factor = 7*np.sin(np.linspace(0, 3.14*8, 48))
np.random.seed(2004)
irregular_factor = 2*np.random.randn(len(dates))
df = pd.DataFrame({'timeseries': trend_factor + cycle_factor + seasonal_factor + irregular_factor,
                    'trend': trend_factor,
                    'cycle': cycle_factor,
                    'seasonal': seasonal_factor,
                    'irregular': irregular_factor,
                      'ts': trend_factor + seasonal_factor},
                    index=dates)

# Time series plot
import matplotlib.pyplot as plt
plt.figure(figsize=[10, 6])
df.timeseries.plot()
plt.title('Time Series (Additive Model)', fontsize=16)
plt.ylim(-12, 55)
plt.show()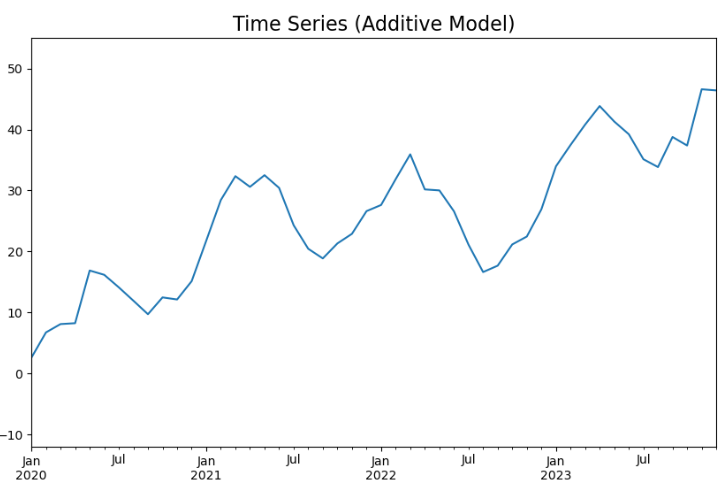
# -- Trend variation
#timestamp = np.arange(len(dates))
#trend_factor = timestamp*1.1
plt.figure(figsize=[10, 6])
df.trend.plot()
plt.title('Trend Factor', fontsize=16)
plt.ylim(-12, 55)
plt.show()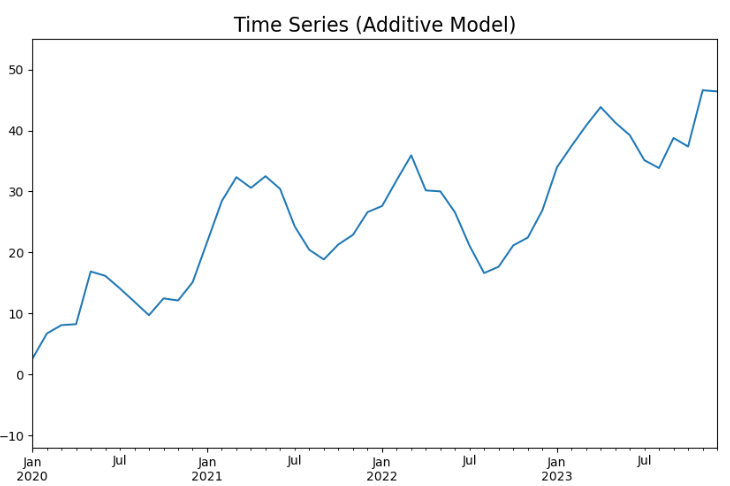
순환변동(cyclical variation)
• 추세변동은 장기적으로(일반적으로 1년 초과) 나타나는 추세경향이지만, 순환변동은
대체로 2~3년 정도의 일정한 기간을 주기로 순환적으로 나타남.
• 즉, 1년 이내의 주기로 곡선을 그리며 추세변동에 따라 변동하는 것을 말함.
• 시간의 경과(흐름)에 따라 상하로 반복되는 변동으로 추세선을 따라 변화하는 것이 순
환변동임
plt.figure(figsize=[10, 6])
df.cycle.plot()
plt.title('cycle Factor', fontsize=16)
plt.ylim(-12, 15)
plt.show()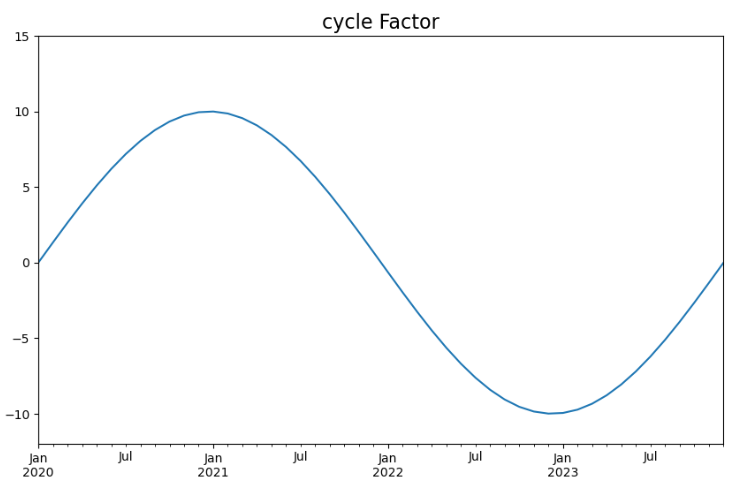
계절변동(seasonal variation)
• 시계열자료에서 보통 계절적 영향과 사회적 관습에 따라 1년 주기로 발생하는 변동요
인을 계절변동이라 하고, 보통계절에 따라 순환하며 변동하는 특성을 지님.
예 : 설, 추석 등 명절요인 등
• 그런데 계절변동이 순환변동과 다른 점은 순환주기가 짧다는 점임.
plt.figure(figsize=[10, 6])
df.seasonal.plot()
plt.title('seasonal Factor', fontsize=16)
plt.ylim(-12, 15)
plt.show()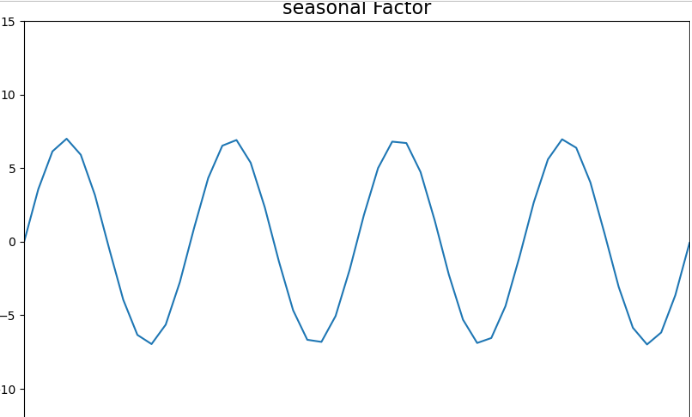
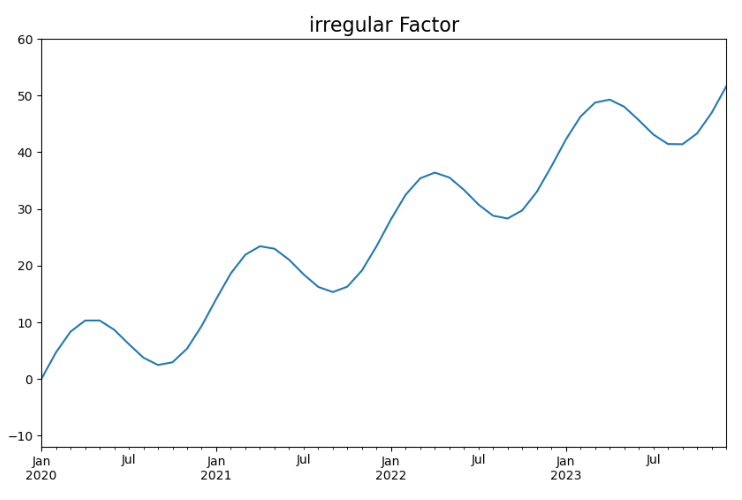
불규칙변동(irregular variation or random variation)
시계열자료에서 어떤 규칙성이 없어 예측 불가능하게 우연적으로 발생하는 변동을 말한
다. 즉, 시계열 자료에서 위 세 가지 변동 요인을 조정한 후에 나타나는 변동이 불규칙 변
동이다. 시계열 자료로 예측을 할 때, 불규칙 변동이 많이 존재하면 신뢰성이 있는 예측
을 하기 어렵다.
plt.figure(figsize=[10, 6])
df.ts.plot()
plt.title('irregular Factor', fontsize=16)
plt.ylim(-12, 60)
plt.show()