
Macro Event
7/17-7/23 Schedule of macro events
● In terms of macro data this week, there are mainly two items: monthly retail sales rate and initial jobless claims, and important macro meetings and speeches mainly include Lagarde's speech and G20 finance ministers and central bankers' meeting.
○ This week's macro events are fewer, and in the context of the current poor correlation between macro and crypto, the above macro events are difficult to have an impact on the crypto market trend, if there is a rise in IV before the event, then it will be a good sell Vol opportunity.
● This week's crypto conference was mainly focused on the technical community, with no high impact crypto events.
○ One to watch is AIBC ASIA in the Philippines on Wednesday, whether the combination of AI and crypto has any eye-opening innovations.
7/17 Monday
● ECB President Lagarde speaks (16:15)
● Ethereum Community Conference 6
7/18 Tuesday
● U.S. monthly retail sales for June, prior 0.30%, forecast 0.50% (20:30)
● G20 Finance Ministers and Central Bank Governors Meeting concludes
7/19 Wednesday
● AIBC ASIA
7/20 Thursday
● U.S. initial jobless claims for the week to July 15, previous 237,000 (20:30)
7/22 Saturday
● Istanbul Blockchain
● Istanbul Blockchain Week
BTC 29DEC23-40000-C
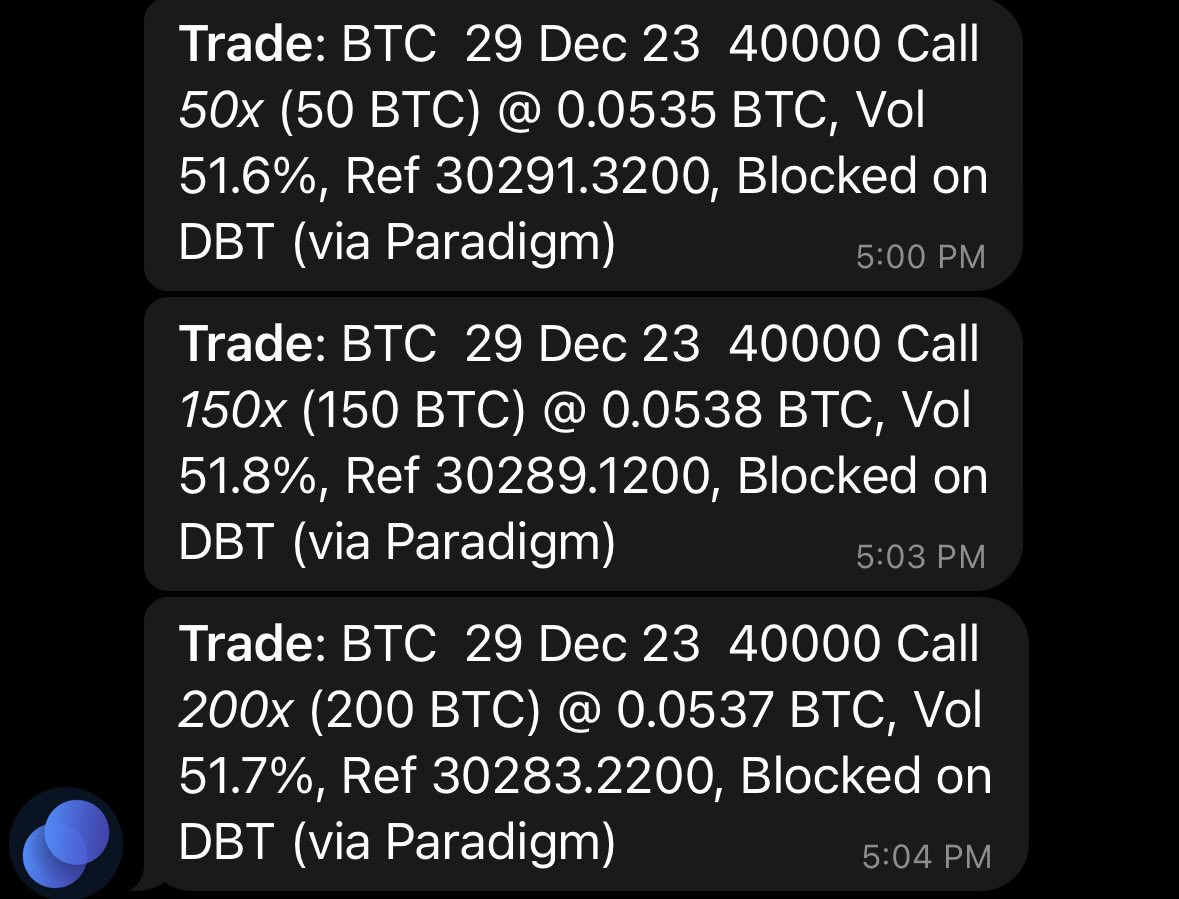
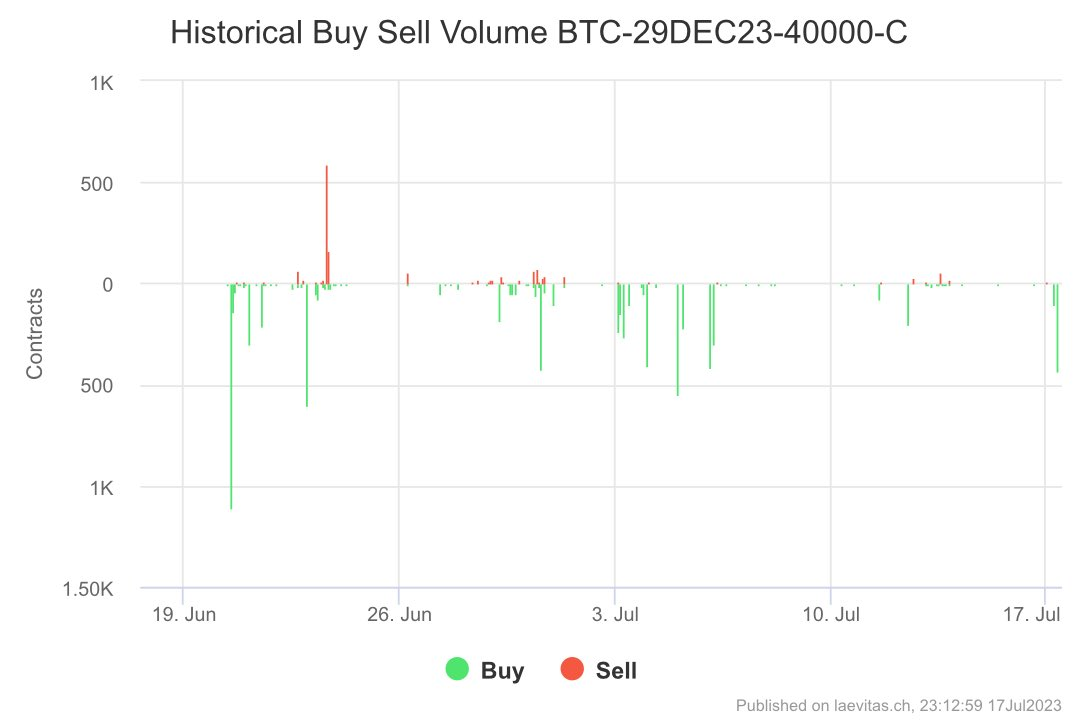
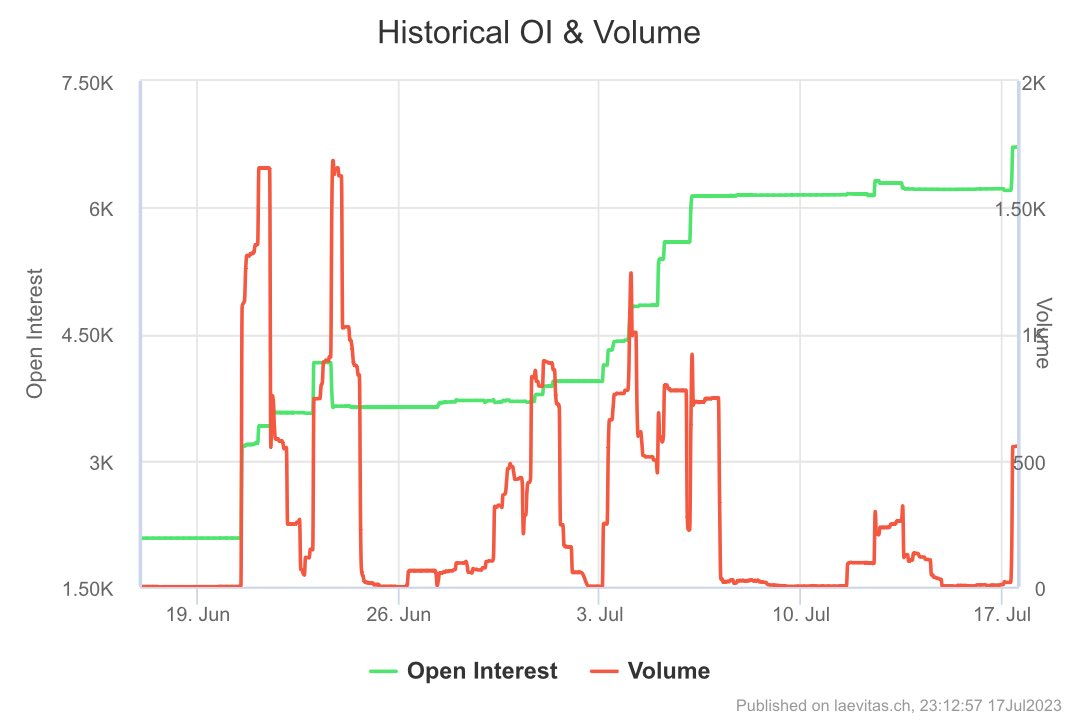
Definitly a popular trade in recent weeks
Valkyrie's Bitcoin ETF
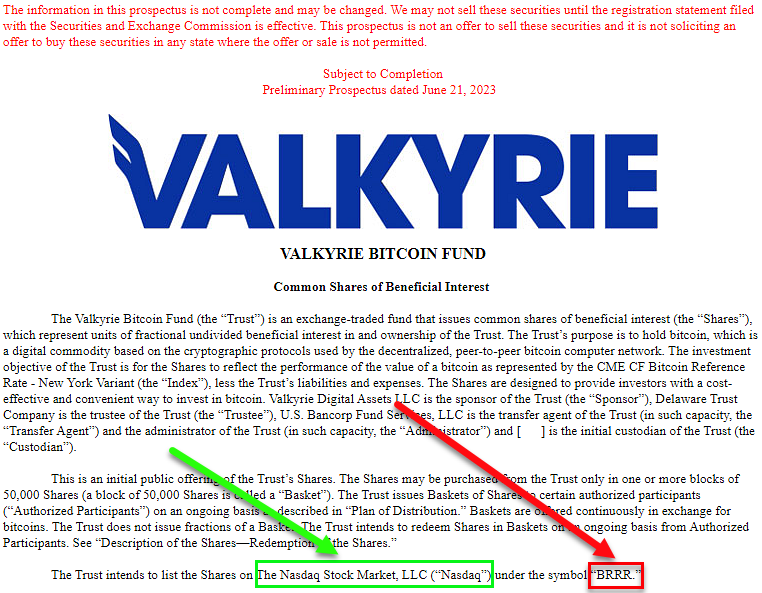
JUST IN: Valkyrie's bitcoin ETF has just been ack by the SEC, that's the last one to file of the current crop and the only one with a ticker picked out: $BRRR
SEC BTC ETF
Coindesk - SEC Launches Review of Latest Bitcoin ETF Applications
BTC ETP Inflows
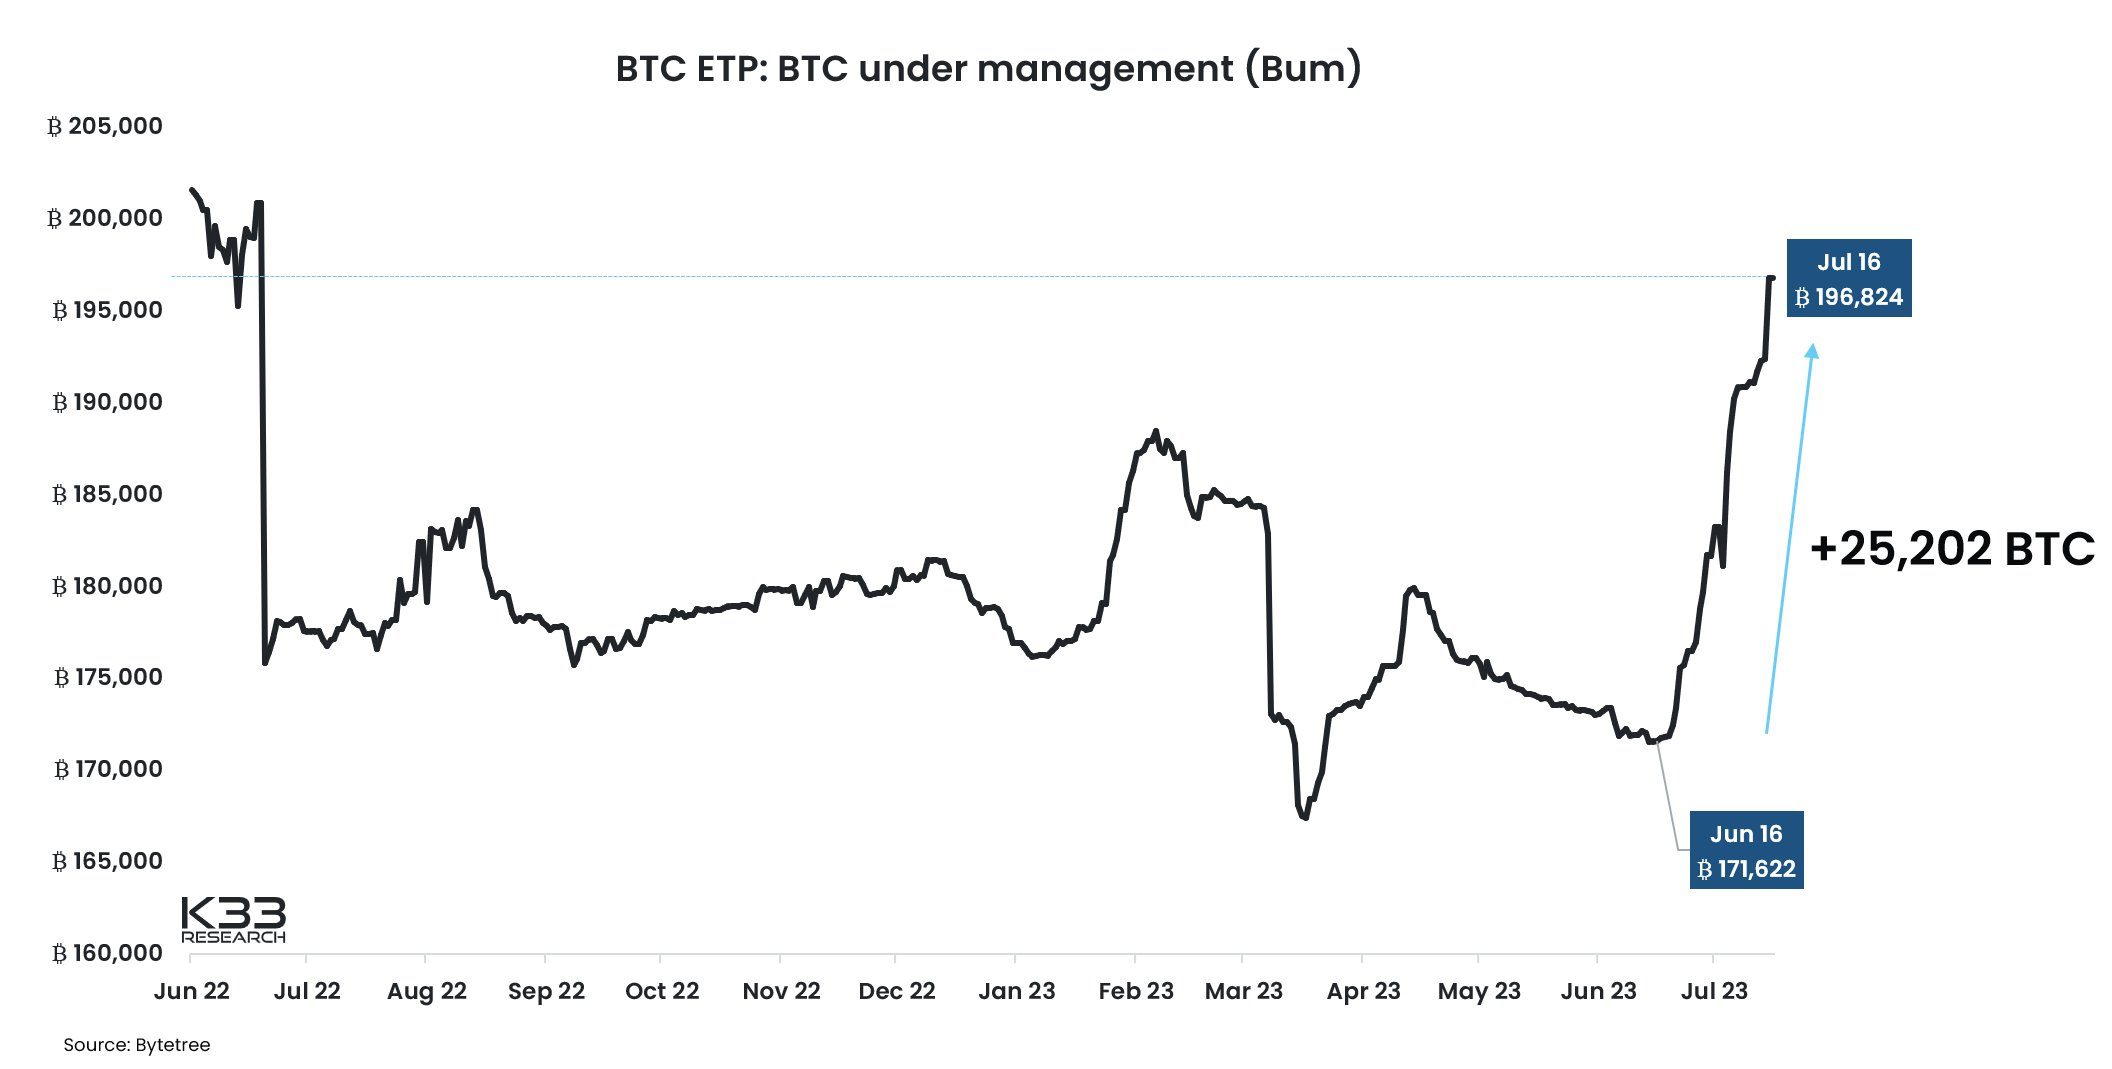
The BTC ETP inflows are both massive and steady!
From June 16th to July 16th, BTC ETPs saw monthly net inflows of 25,202 BTC - the second largest monthly net inflow in BTC ETPs, only surpassed by October 2021 (the launch of BITO and other futures-based ETFs in the U.S.).
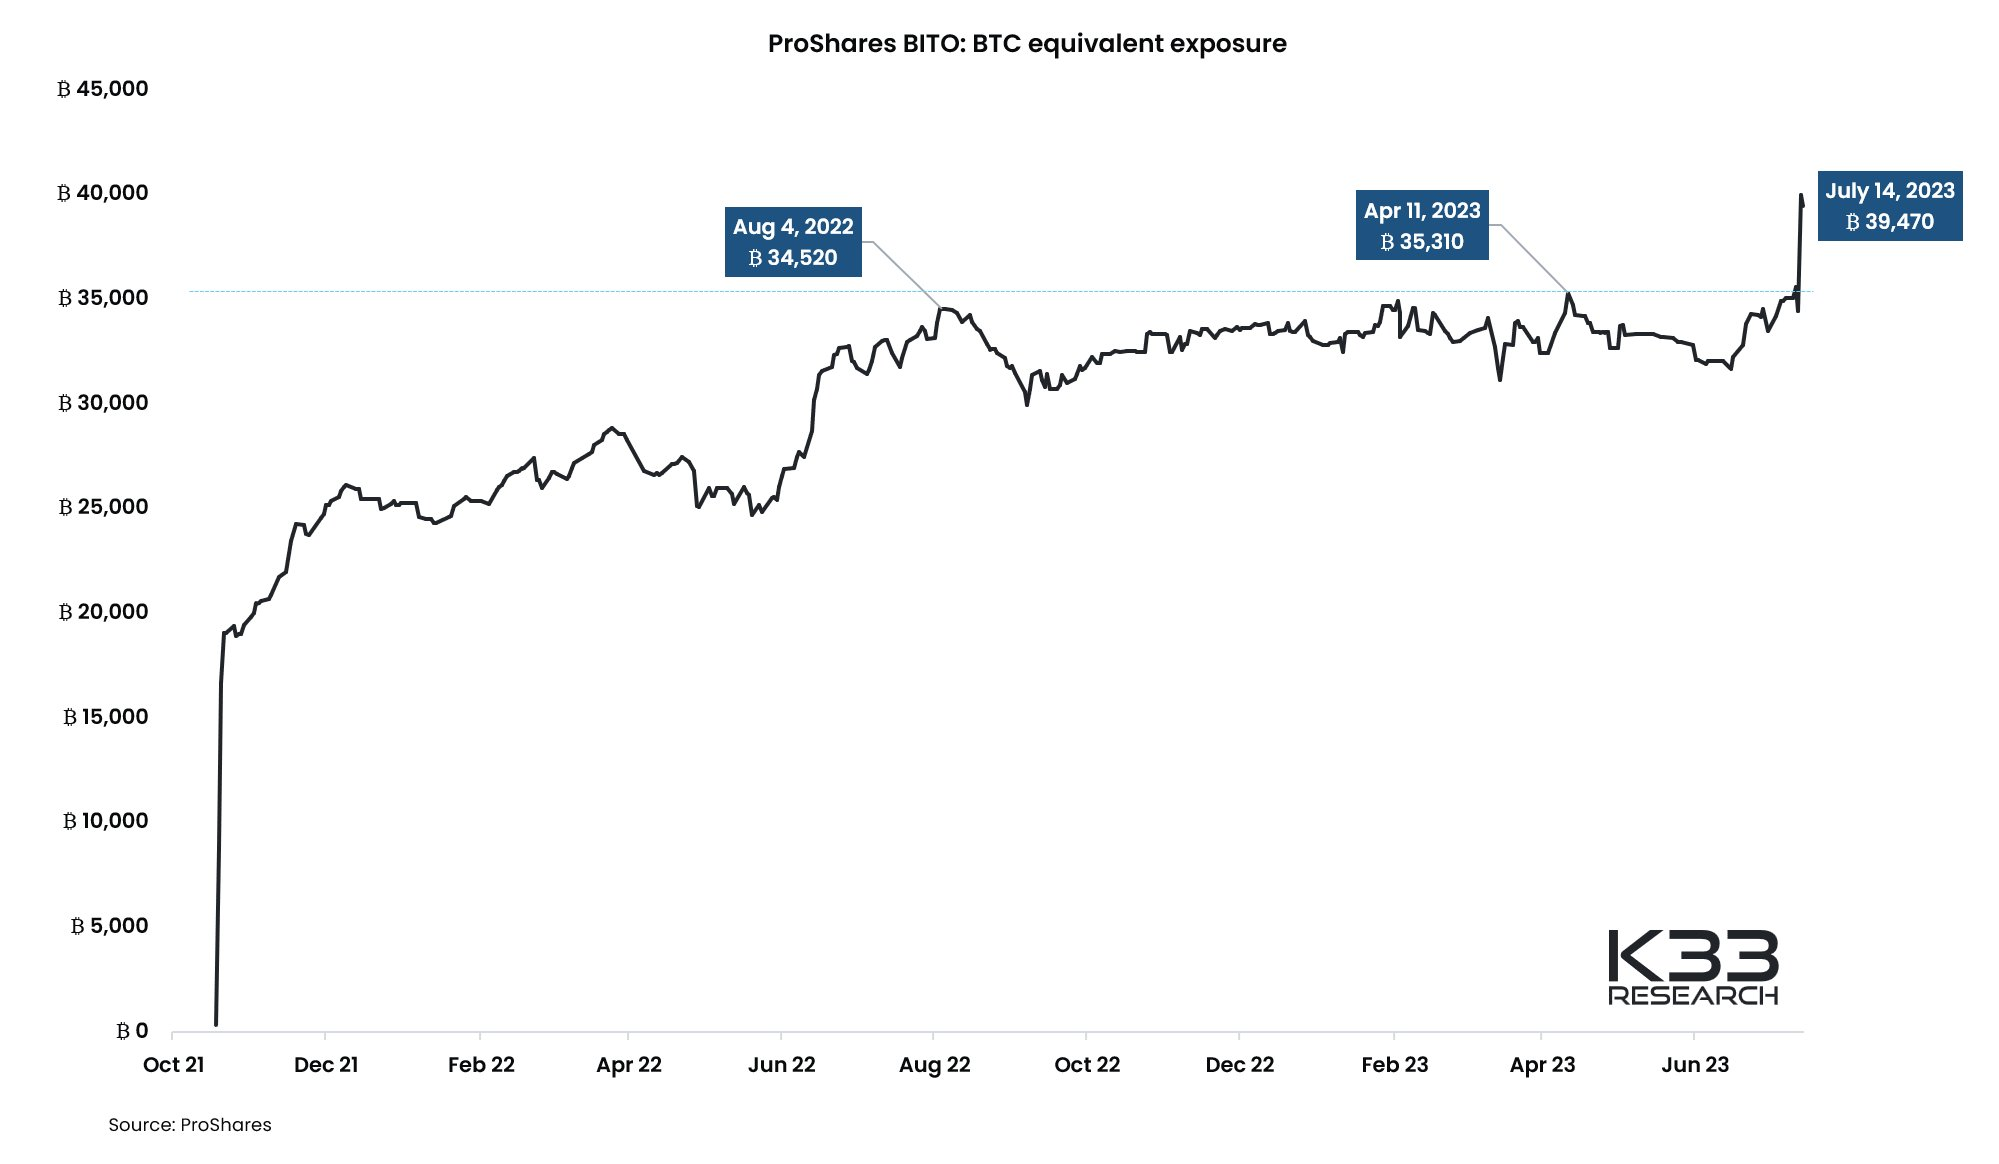
Speaking of BITO: BITO's BTC equivalent exposure has reached a new all-time high after growing by 4,425 BTC last week.
BITO spikes have tended to occur near local market tops (Aug 4, 2022, and Apr 11, 2023).
Still, BITO's overall BTC exposure has structurally been flat from June 2022 until the past week, when the market saw its first notable range breakout.
Gary Gensler XRP

Third most active day
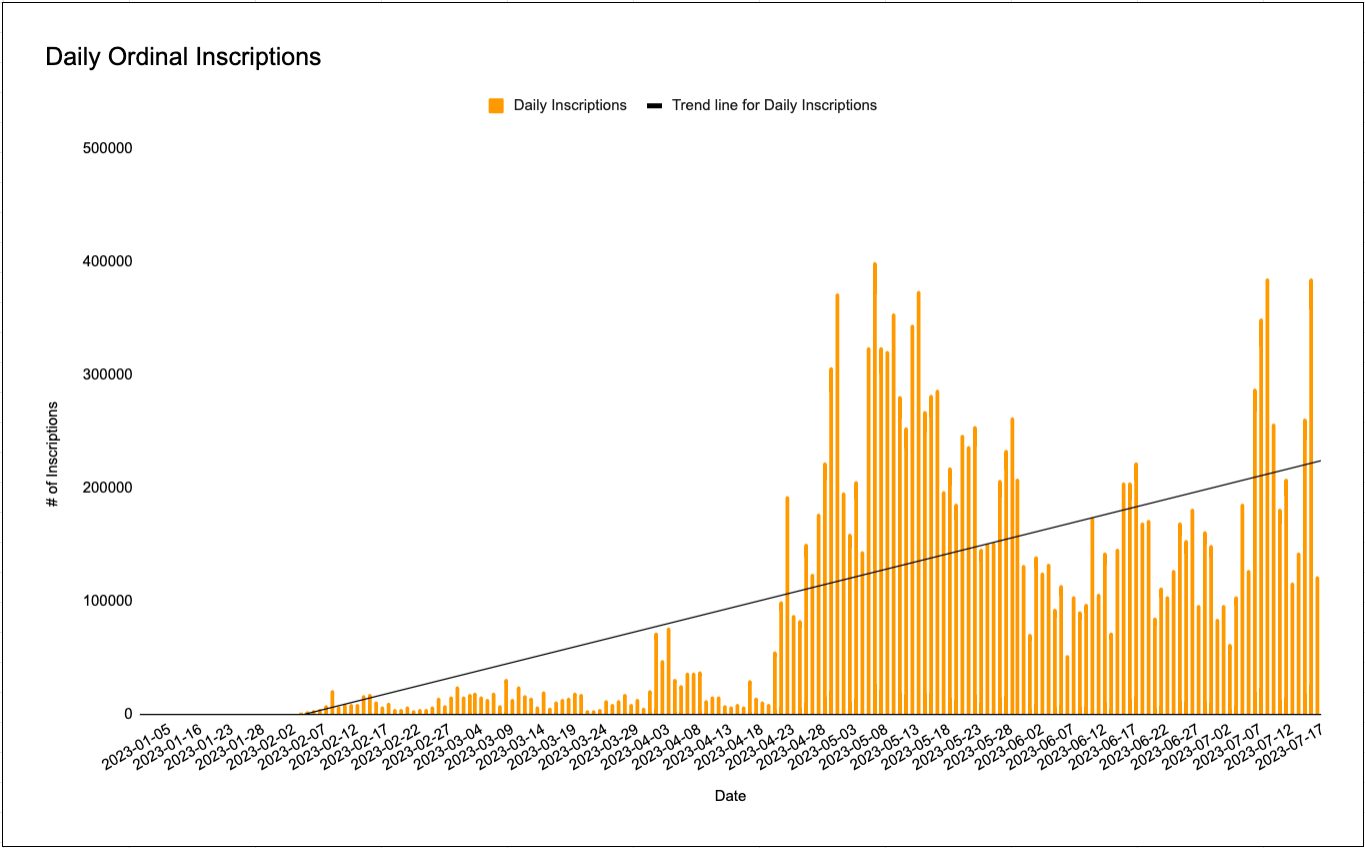
This weekend approximately 647,000 Ordinals were inscribed onto the Bitcoin blockchain with 386k inscriptions on Sunday alone.
Sunday represents the third most active day since the inception inscriptions & there is a clear trend forming.
Dollar
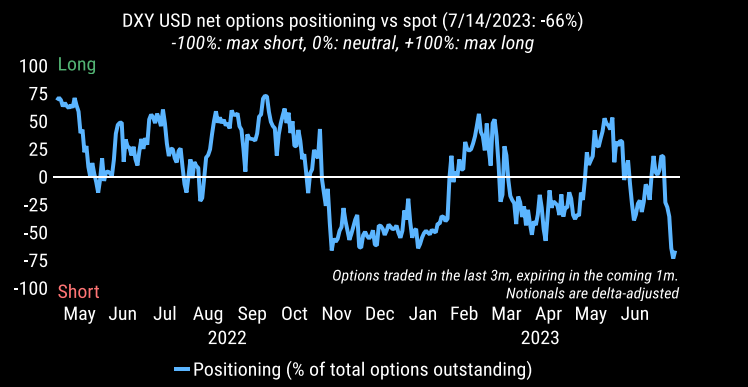
Look how short net options positioning against the Dollar is. Too short
Car Prices
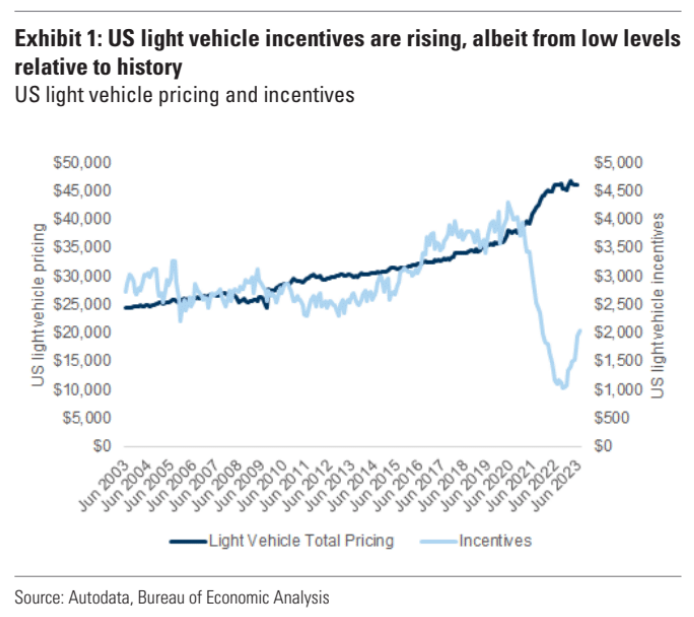
"One of the strongest predictors of used car prices...is new vehicle incentives... new vehicle incentives are rising, while pricing is normalizing."
- Goldman Sachs
Source Tweet - Daily Chartbook
SPX Gamma PV Bands
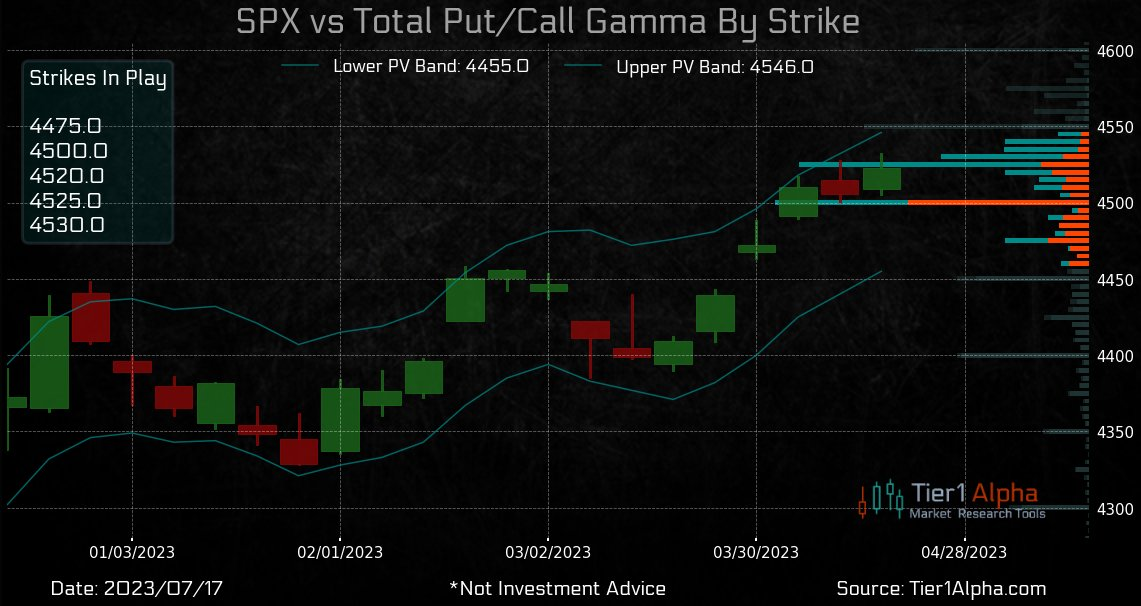
Our PV bands crushed it today, with $SPX closing 9 points off our upper range.
Here is a sneak peek at tomorrow's levels with our new Gamma Exposure integration. One of many new models we'll be rolling out over the next few weeks.
Stay tuned.😎
TLT Options
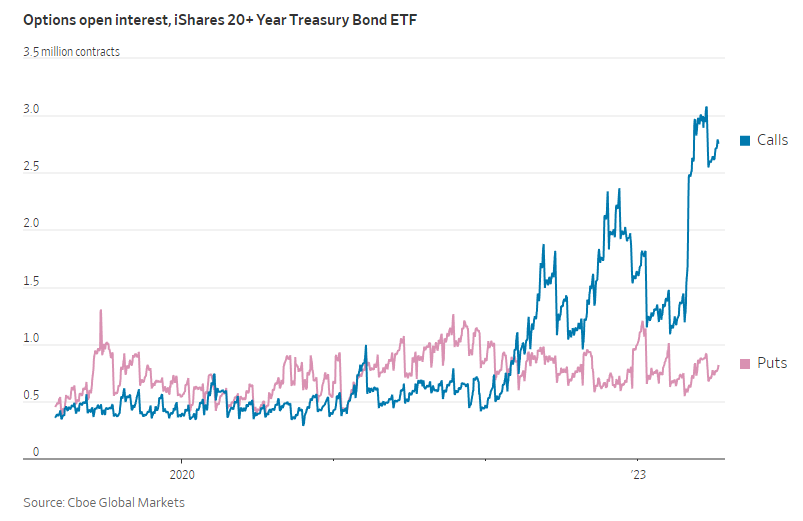
Call Open Interest in the iShares 20+ Year Treasury Bond ETF $TLT is more than triple the OI for Puts signaling that options traders are betting that interest rates are primed to drop.
SPX VIX
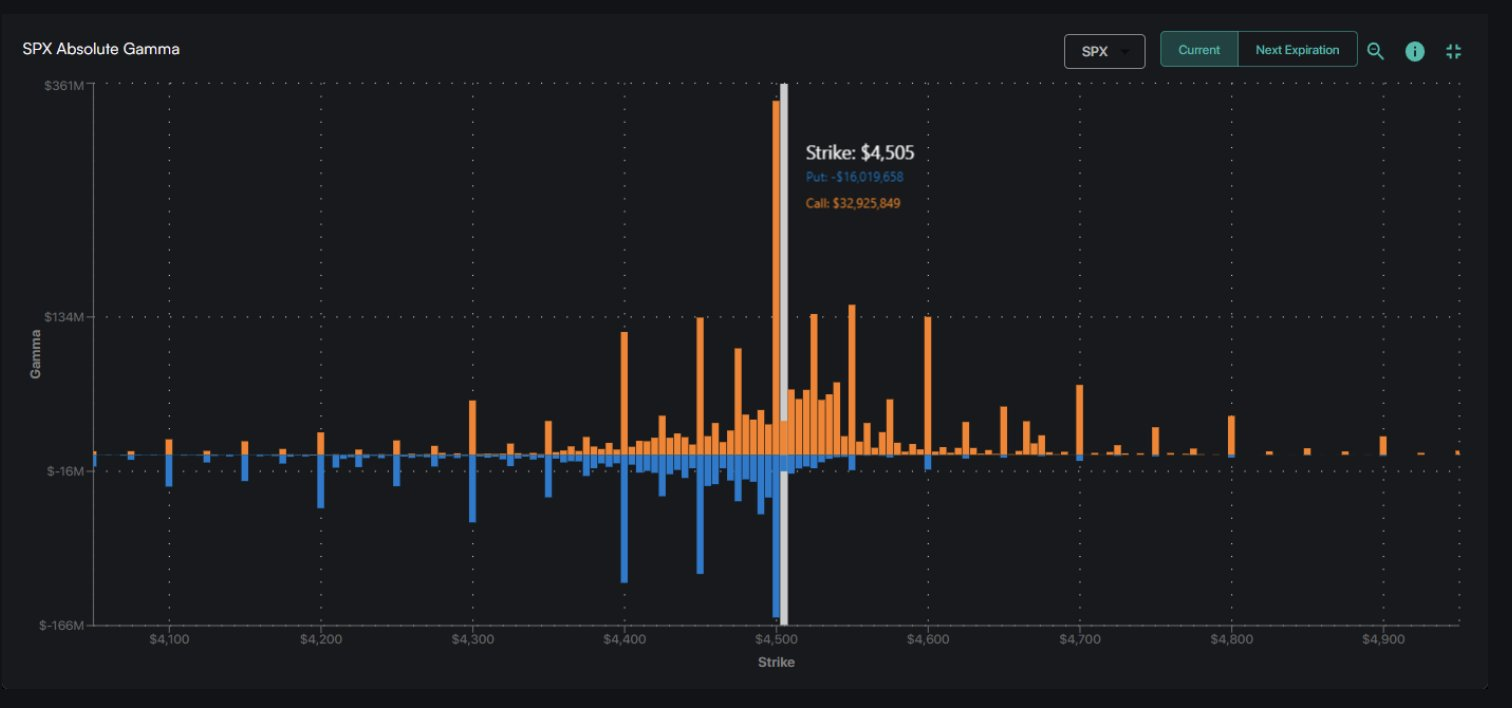
As focus shifts to earnings...
Lots of gamma concentration building at 4500 strike on SPX
Dealers not reaching for gamma on last week's 1.6 sigma rally suggests that vol is well supplied and so delta hedging into OPEX should surpress realised vol.
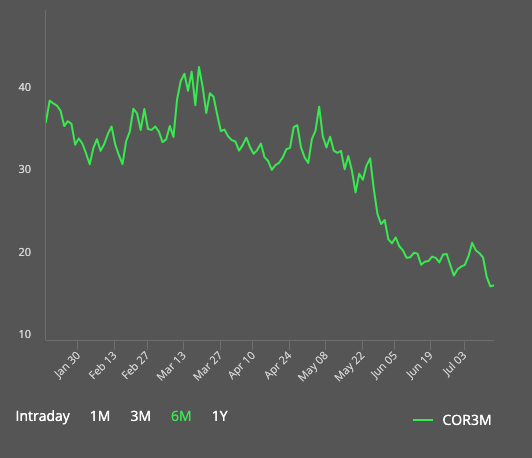
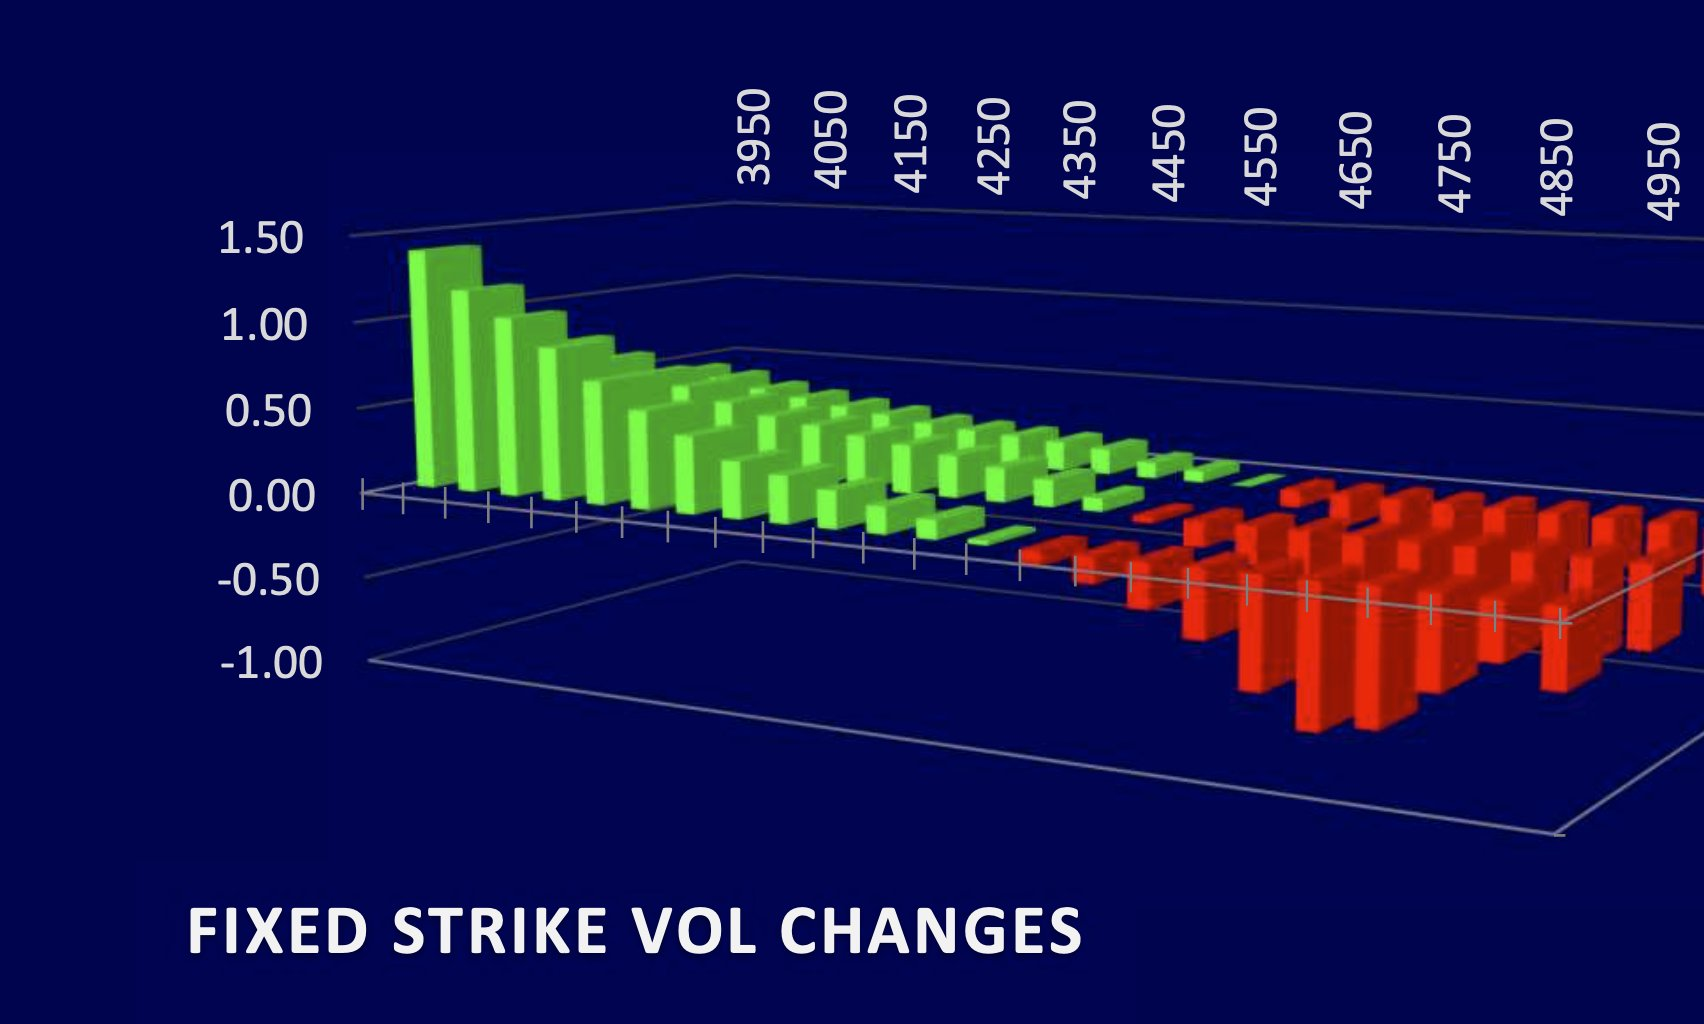
Implied correlation tanking due to earnings as everyone uses index vol to fund decay of single stock options.
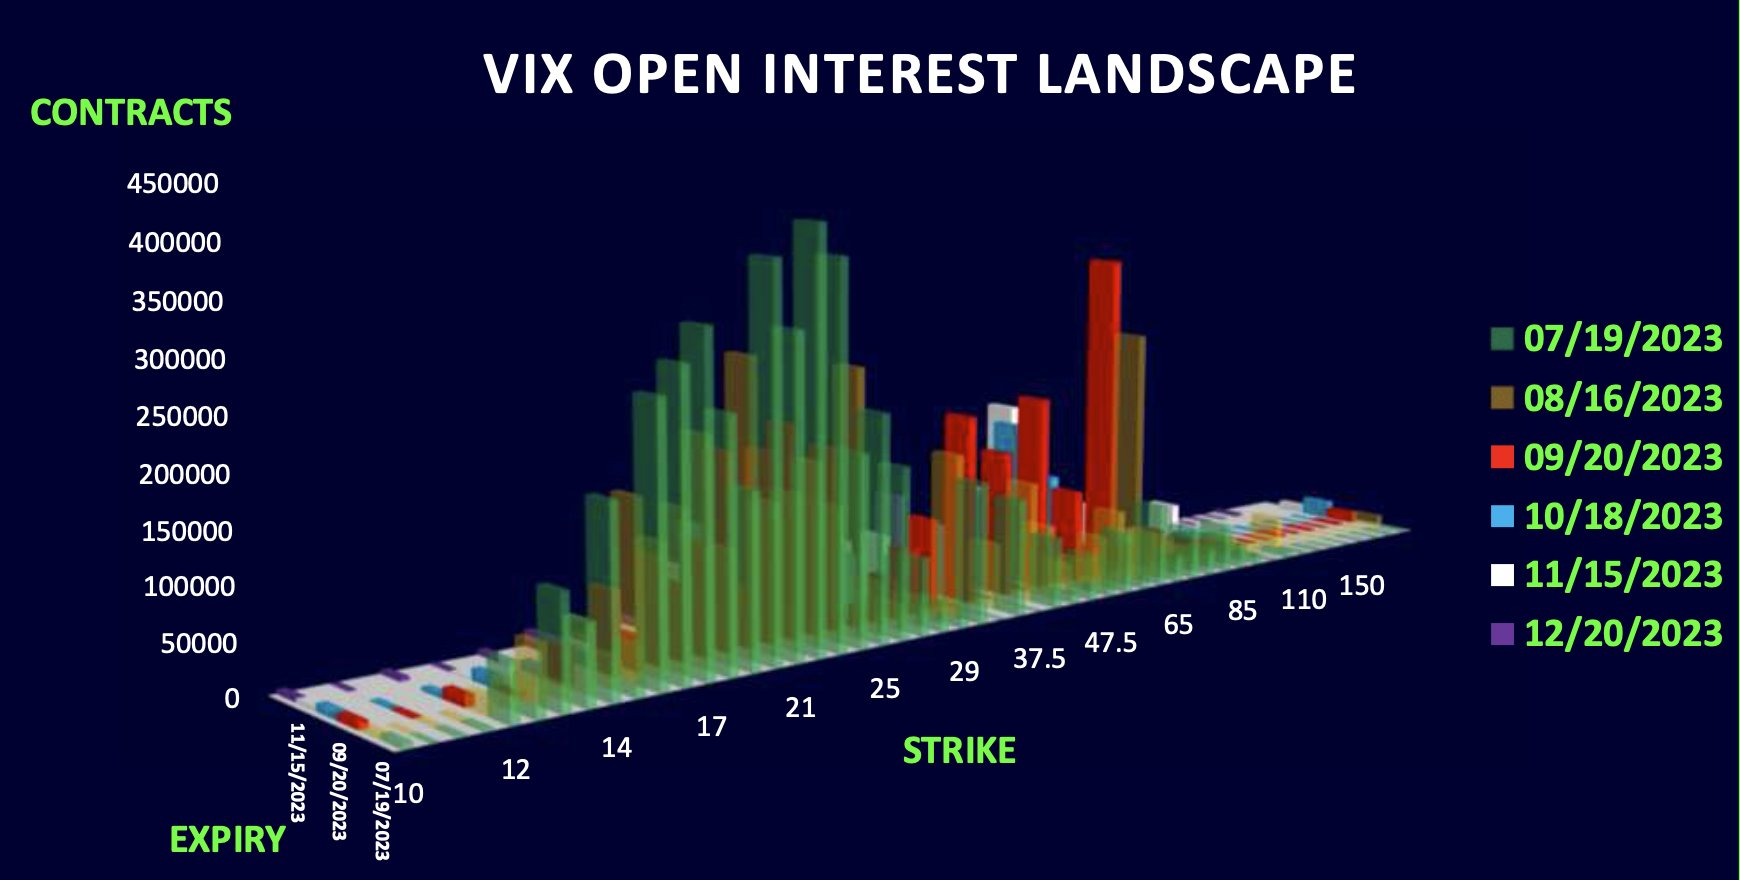
VIX expiry on Wednesday, VIX futures curve steepening as Jul23 VIX gets sold and Aug23 gets bought due to new calls being bought/rolled (21 & 22 strikes). VVIX remains high suggesting dealers short VIX options.
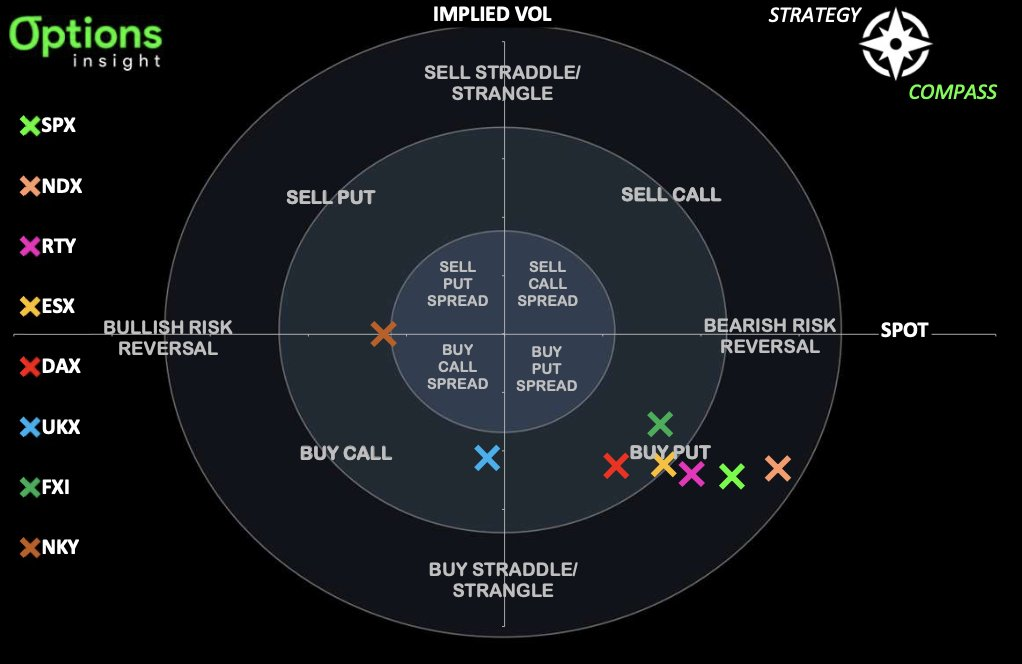
Next week's FOMC and BoJ might give vol a reason to bounce from what looks oversold levels. As of Friday, SPX,NDX & RTY puts were looking best value based in implied vol and skew percentiles.
Disney CEO
Disney CEO Bob Iger put roughly a third of the company up for sale last week
JPM Comment
".. typically, the end of hiking cycle bull steepens the yield curve. If that phenomenon repeats, then this would be supportive of Equities, specifically Tech and Cyclicals. Combine this with increasingly positive macro data and we may be entering a Goldilocks period."
JPM desk
Source Tweet - Carl Quintanilla
WS Bearish Second-Half
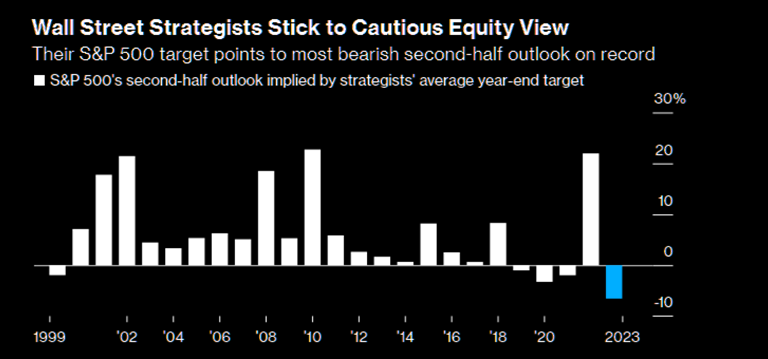
Wall Street strategists have the most bearish second-half outlook on record
What's your outlook?
Source Tweet - Markets & Mayhem
China
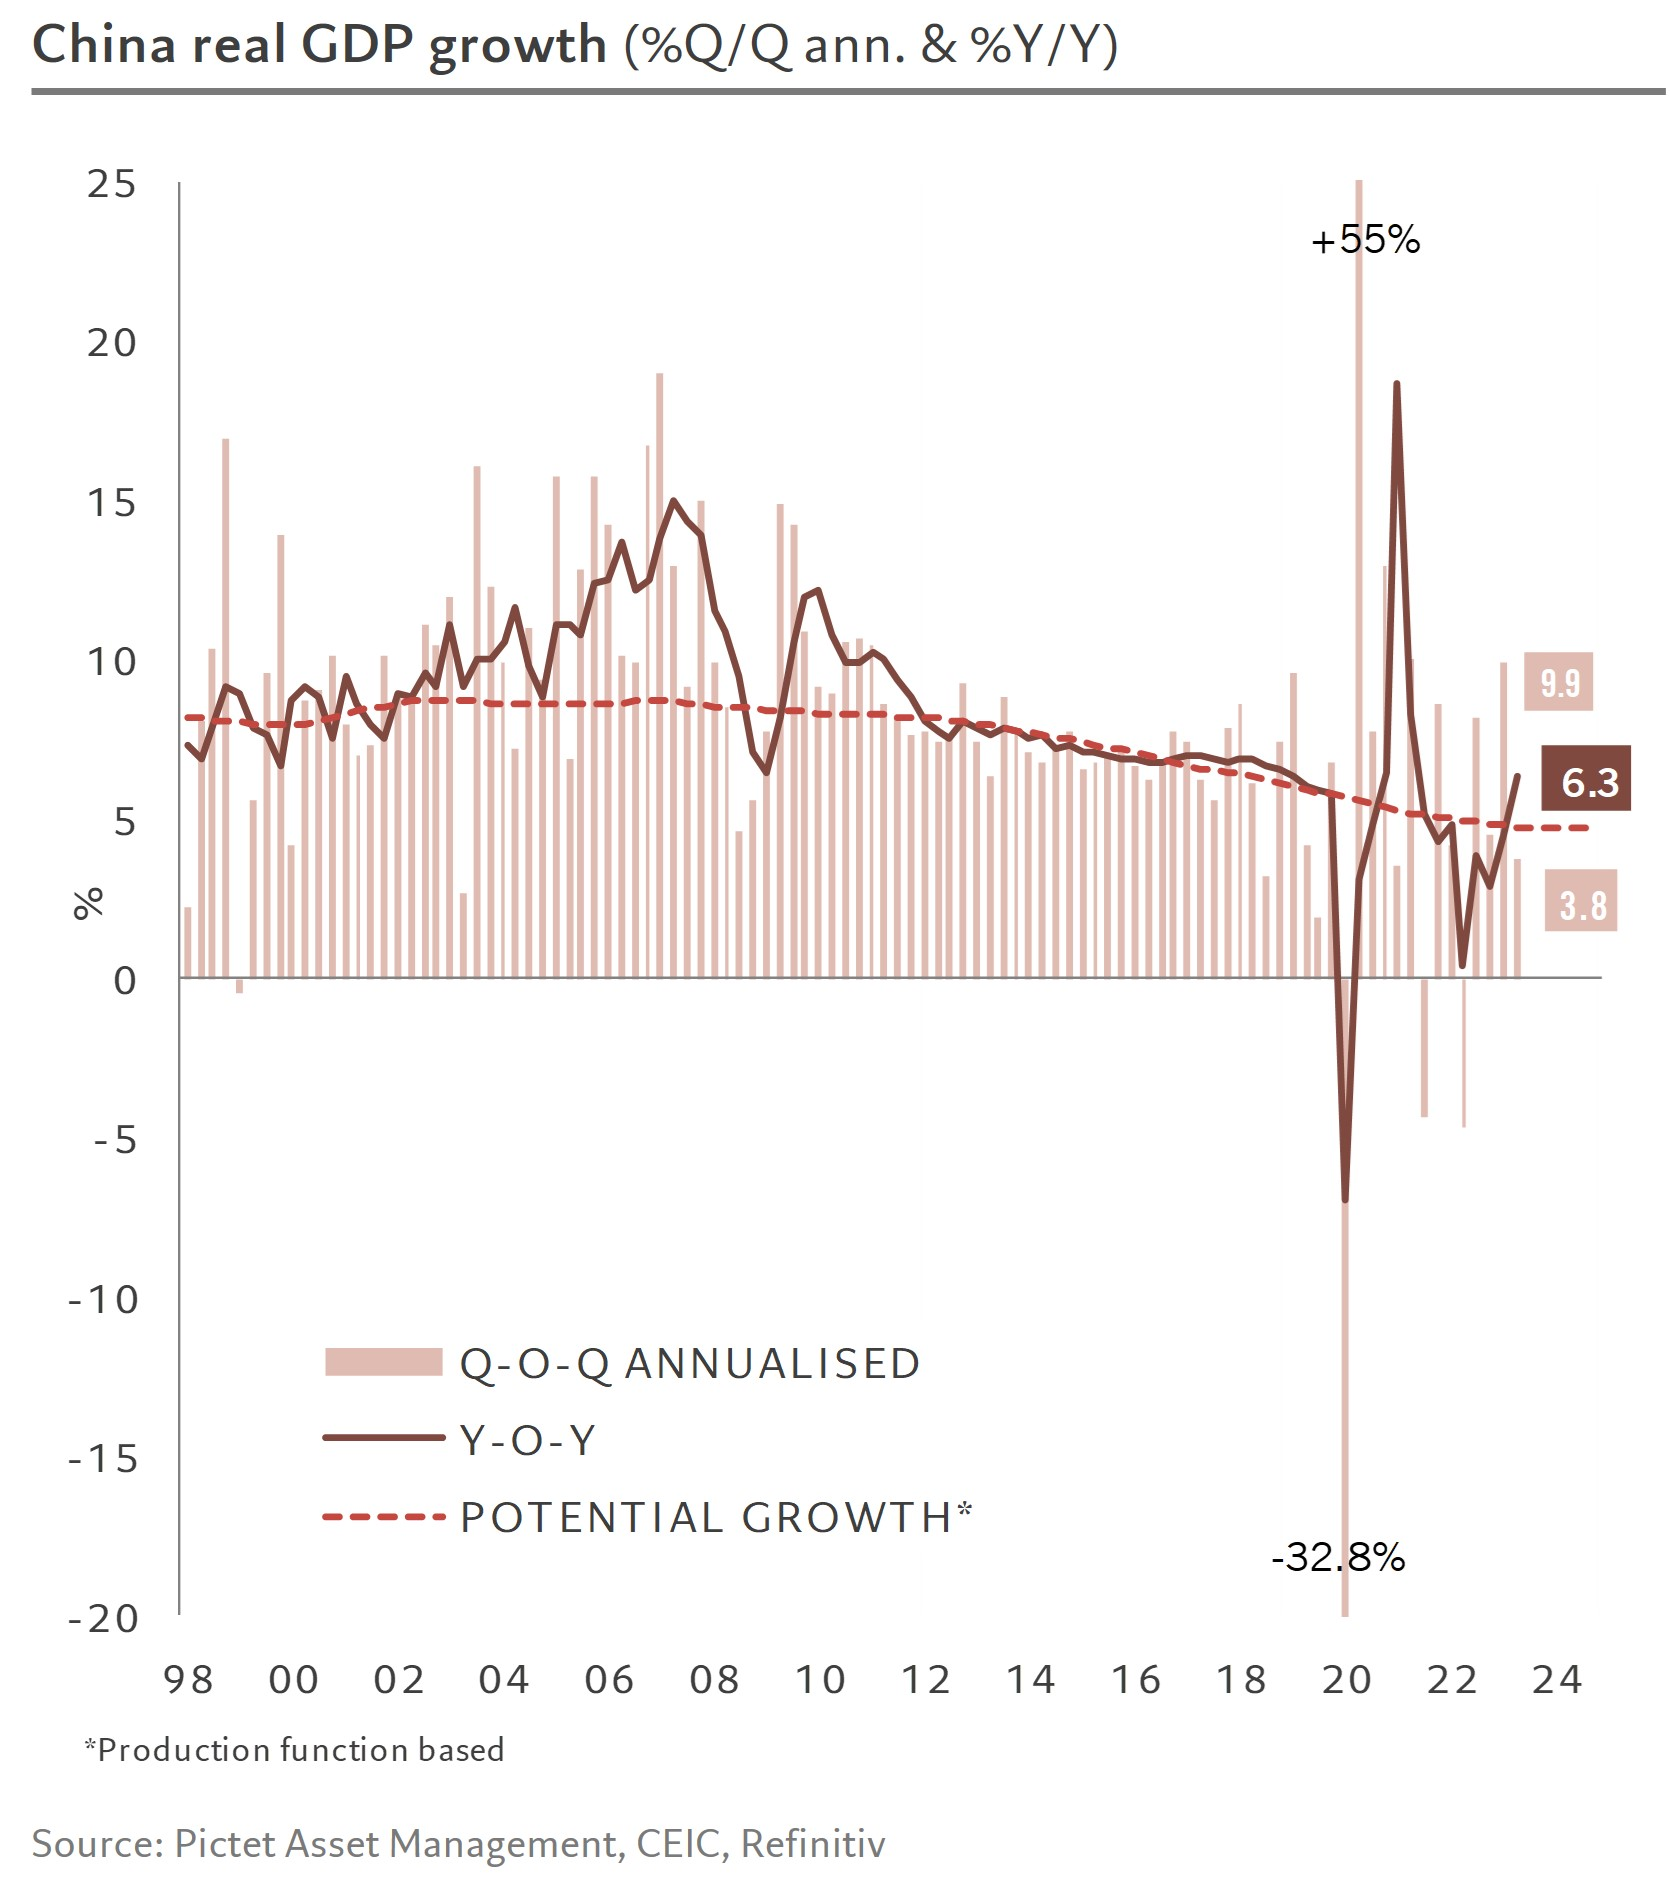
As expected, China's GDP growth slowed significantly in Q2 to 3.8% q/q ann. from 9.9% in Q1 (based on our own seasonal adjustment) still not a catastrophe but a sharp drop in momentum, mainly due to a totally anaemic real estate market
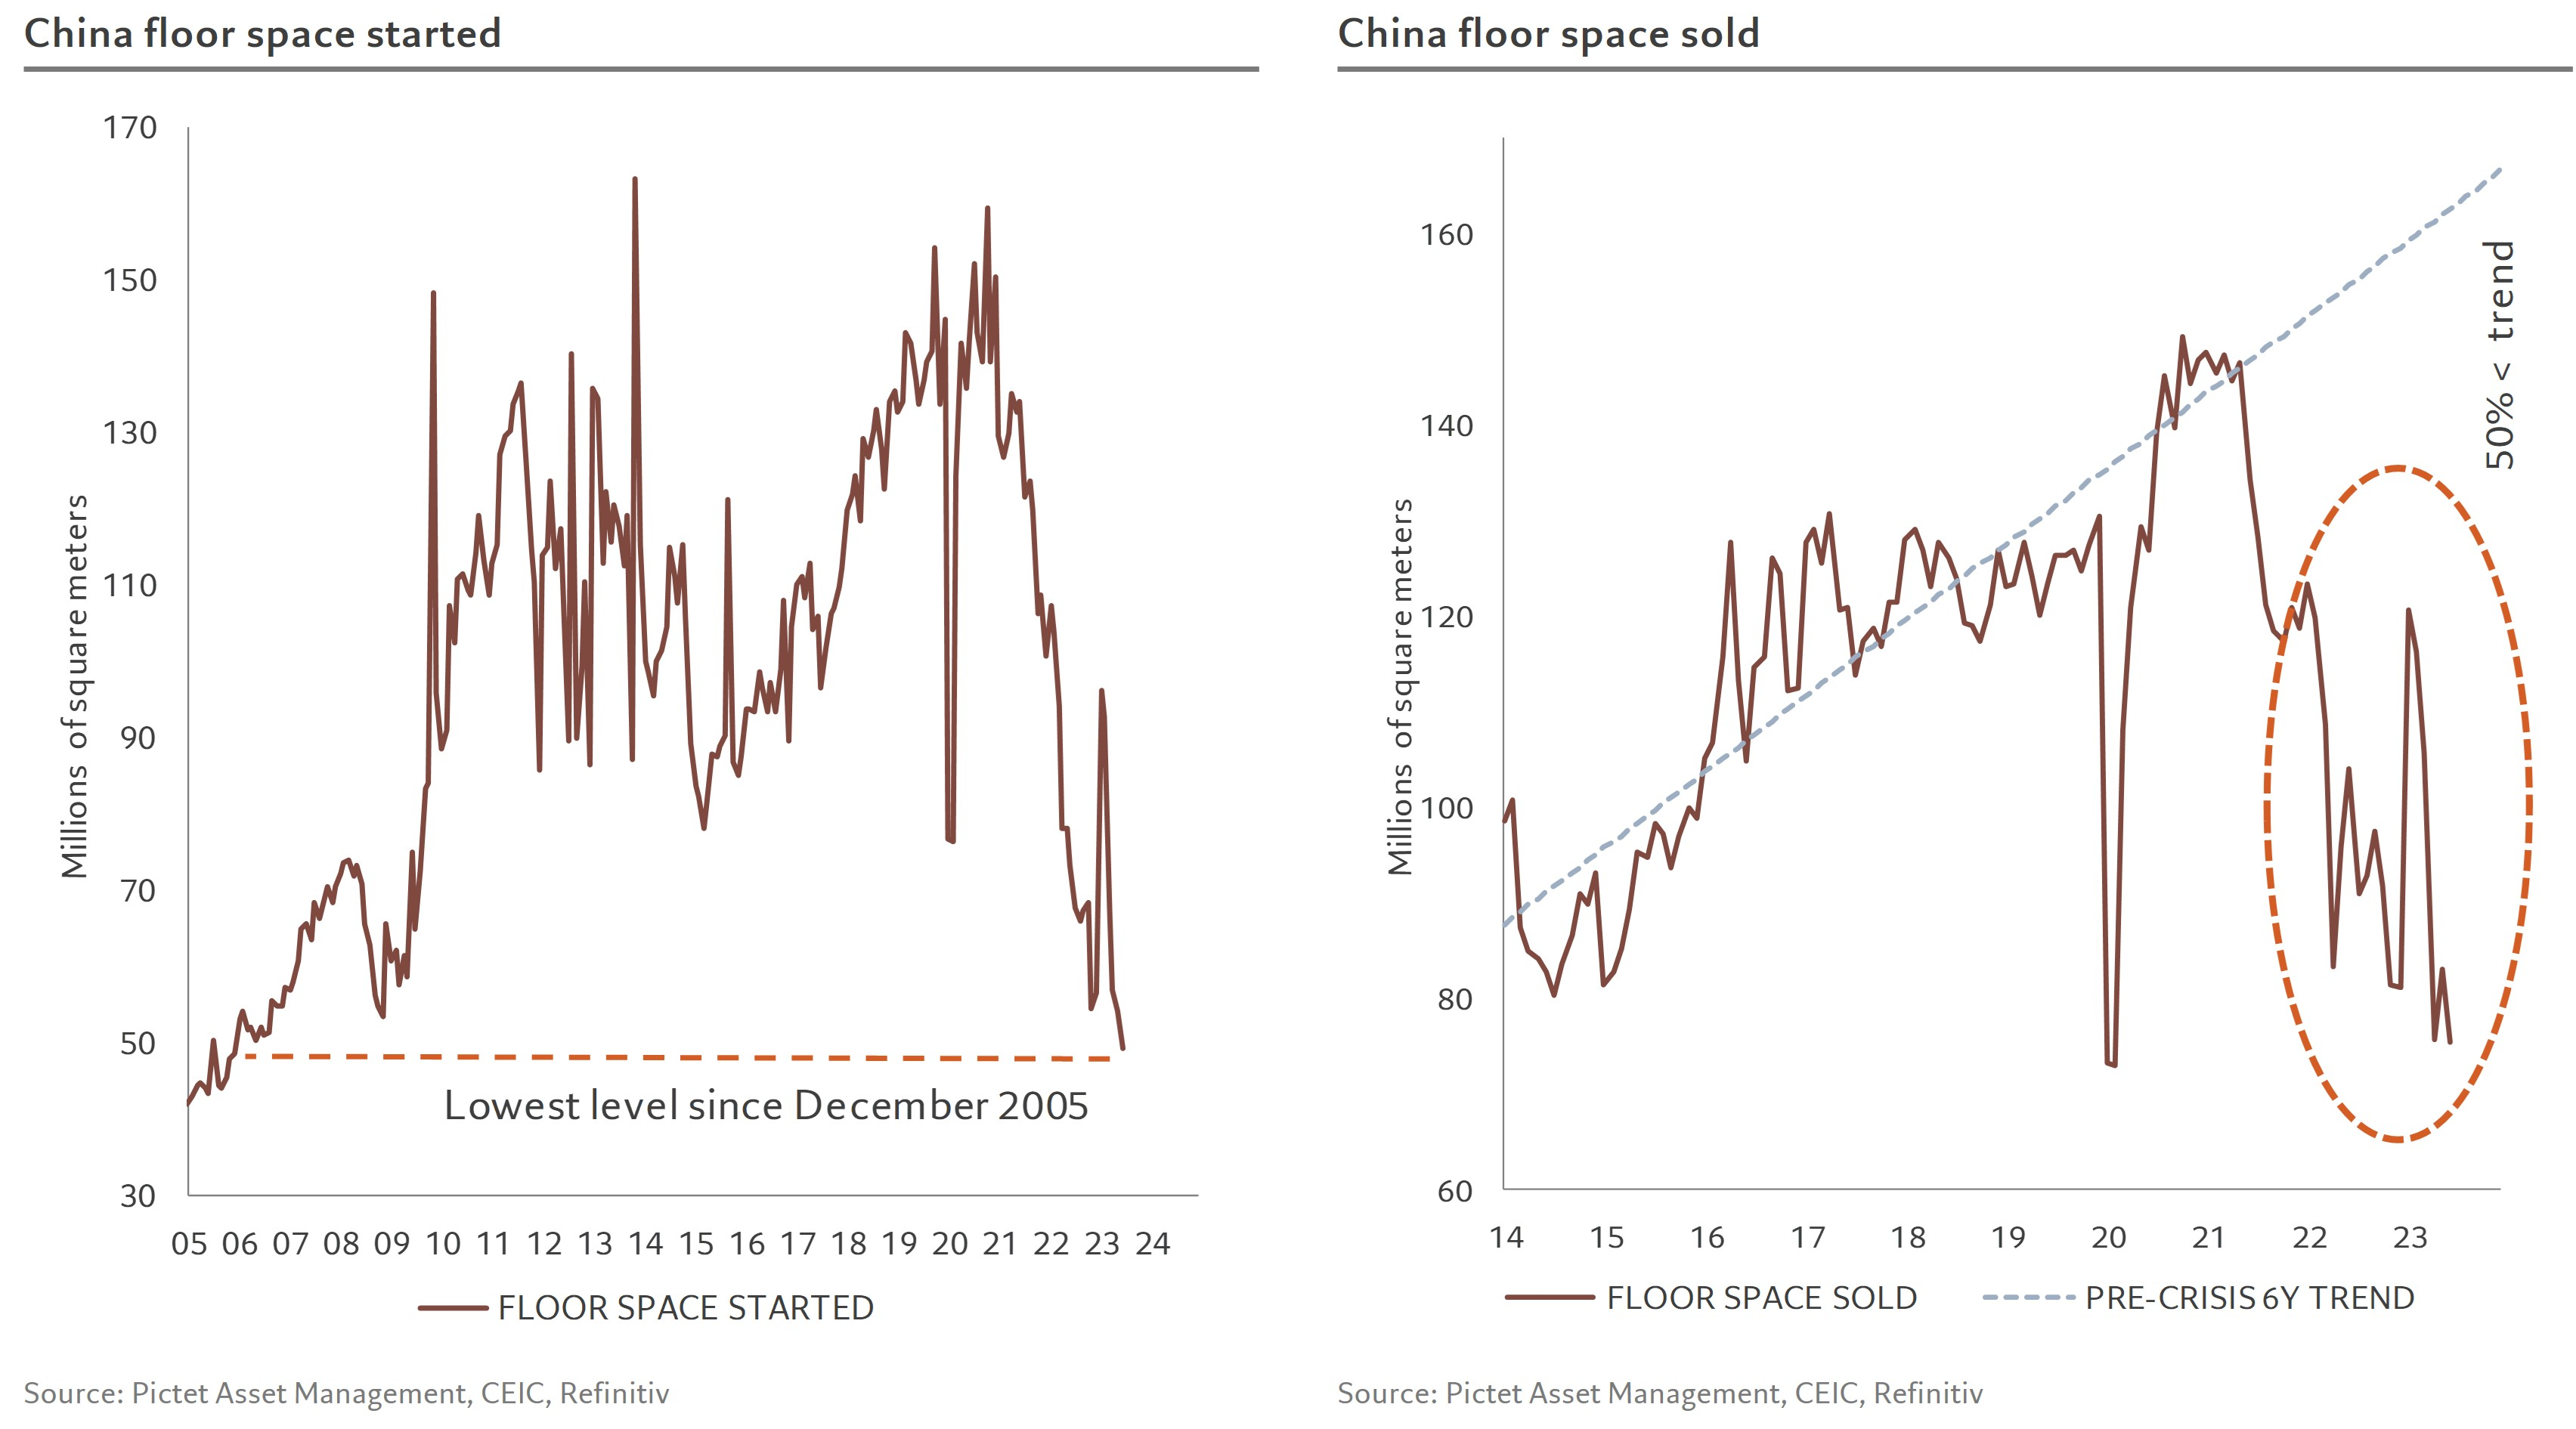
The supply of residential space fell further to its lowest level since Dec 2005 (!!) while residential demand remains at its cyclical low
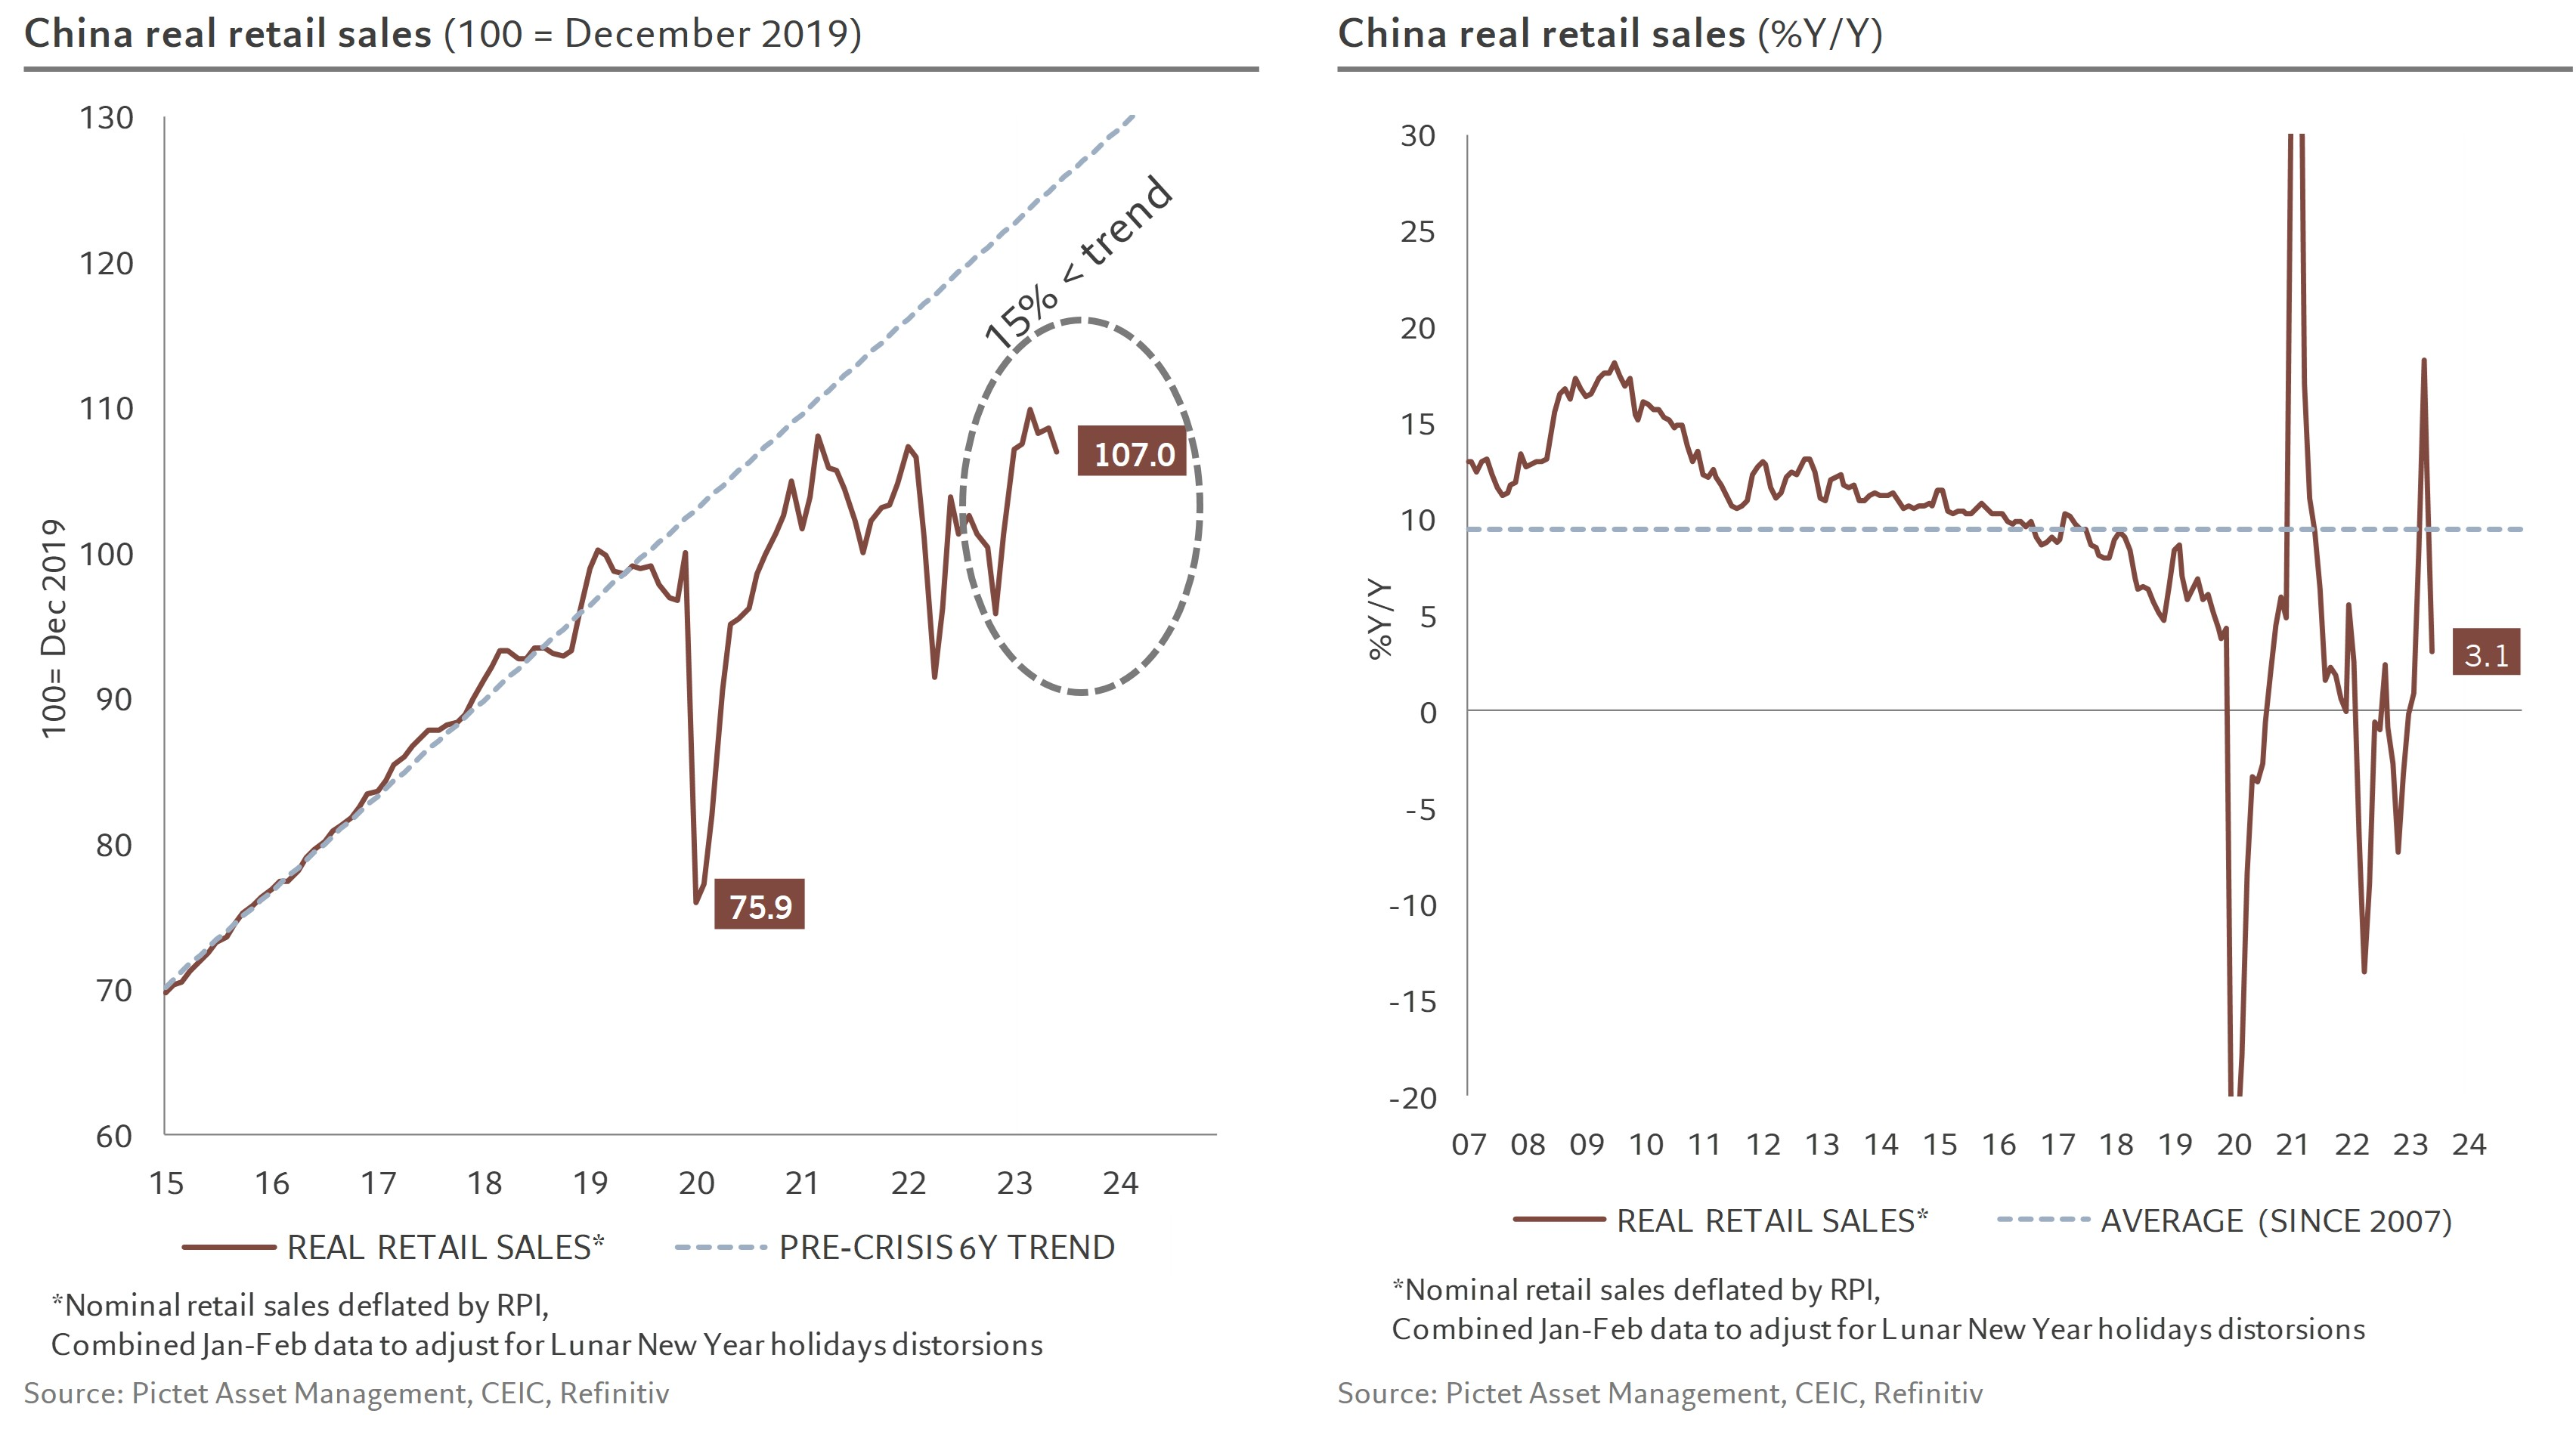
Retail sales volumes fell over the month, more than 15% below their pre-pandemic trend
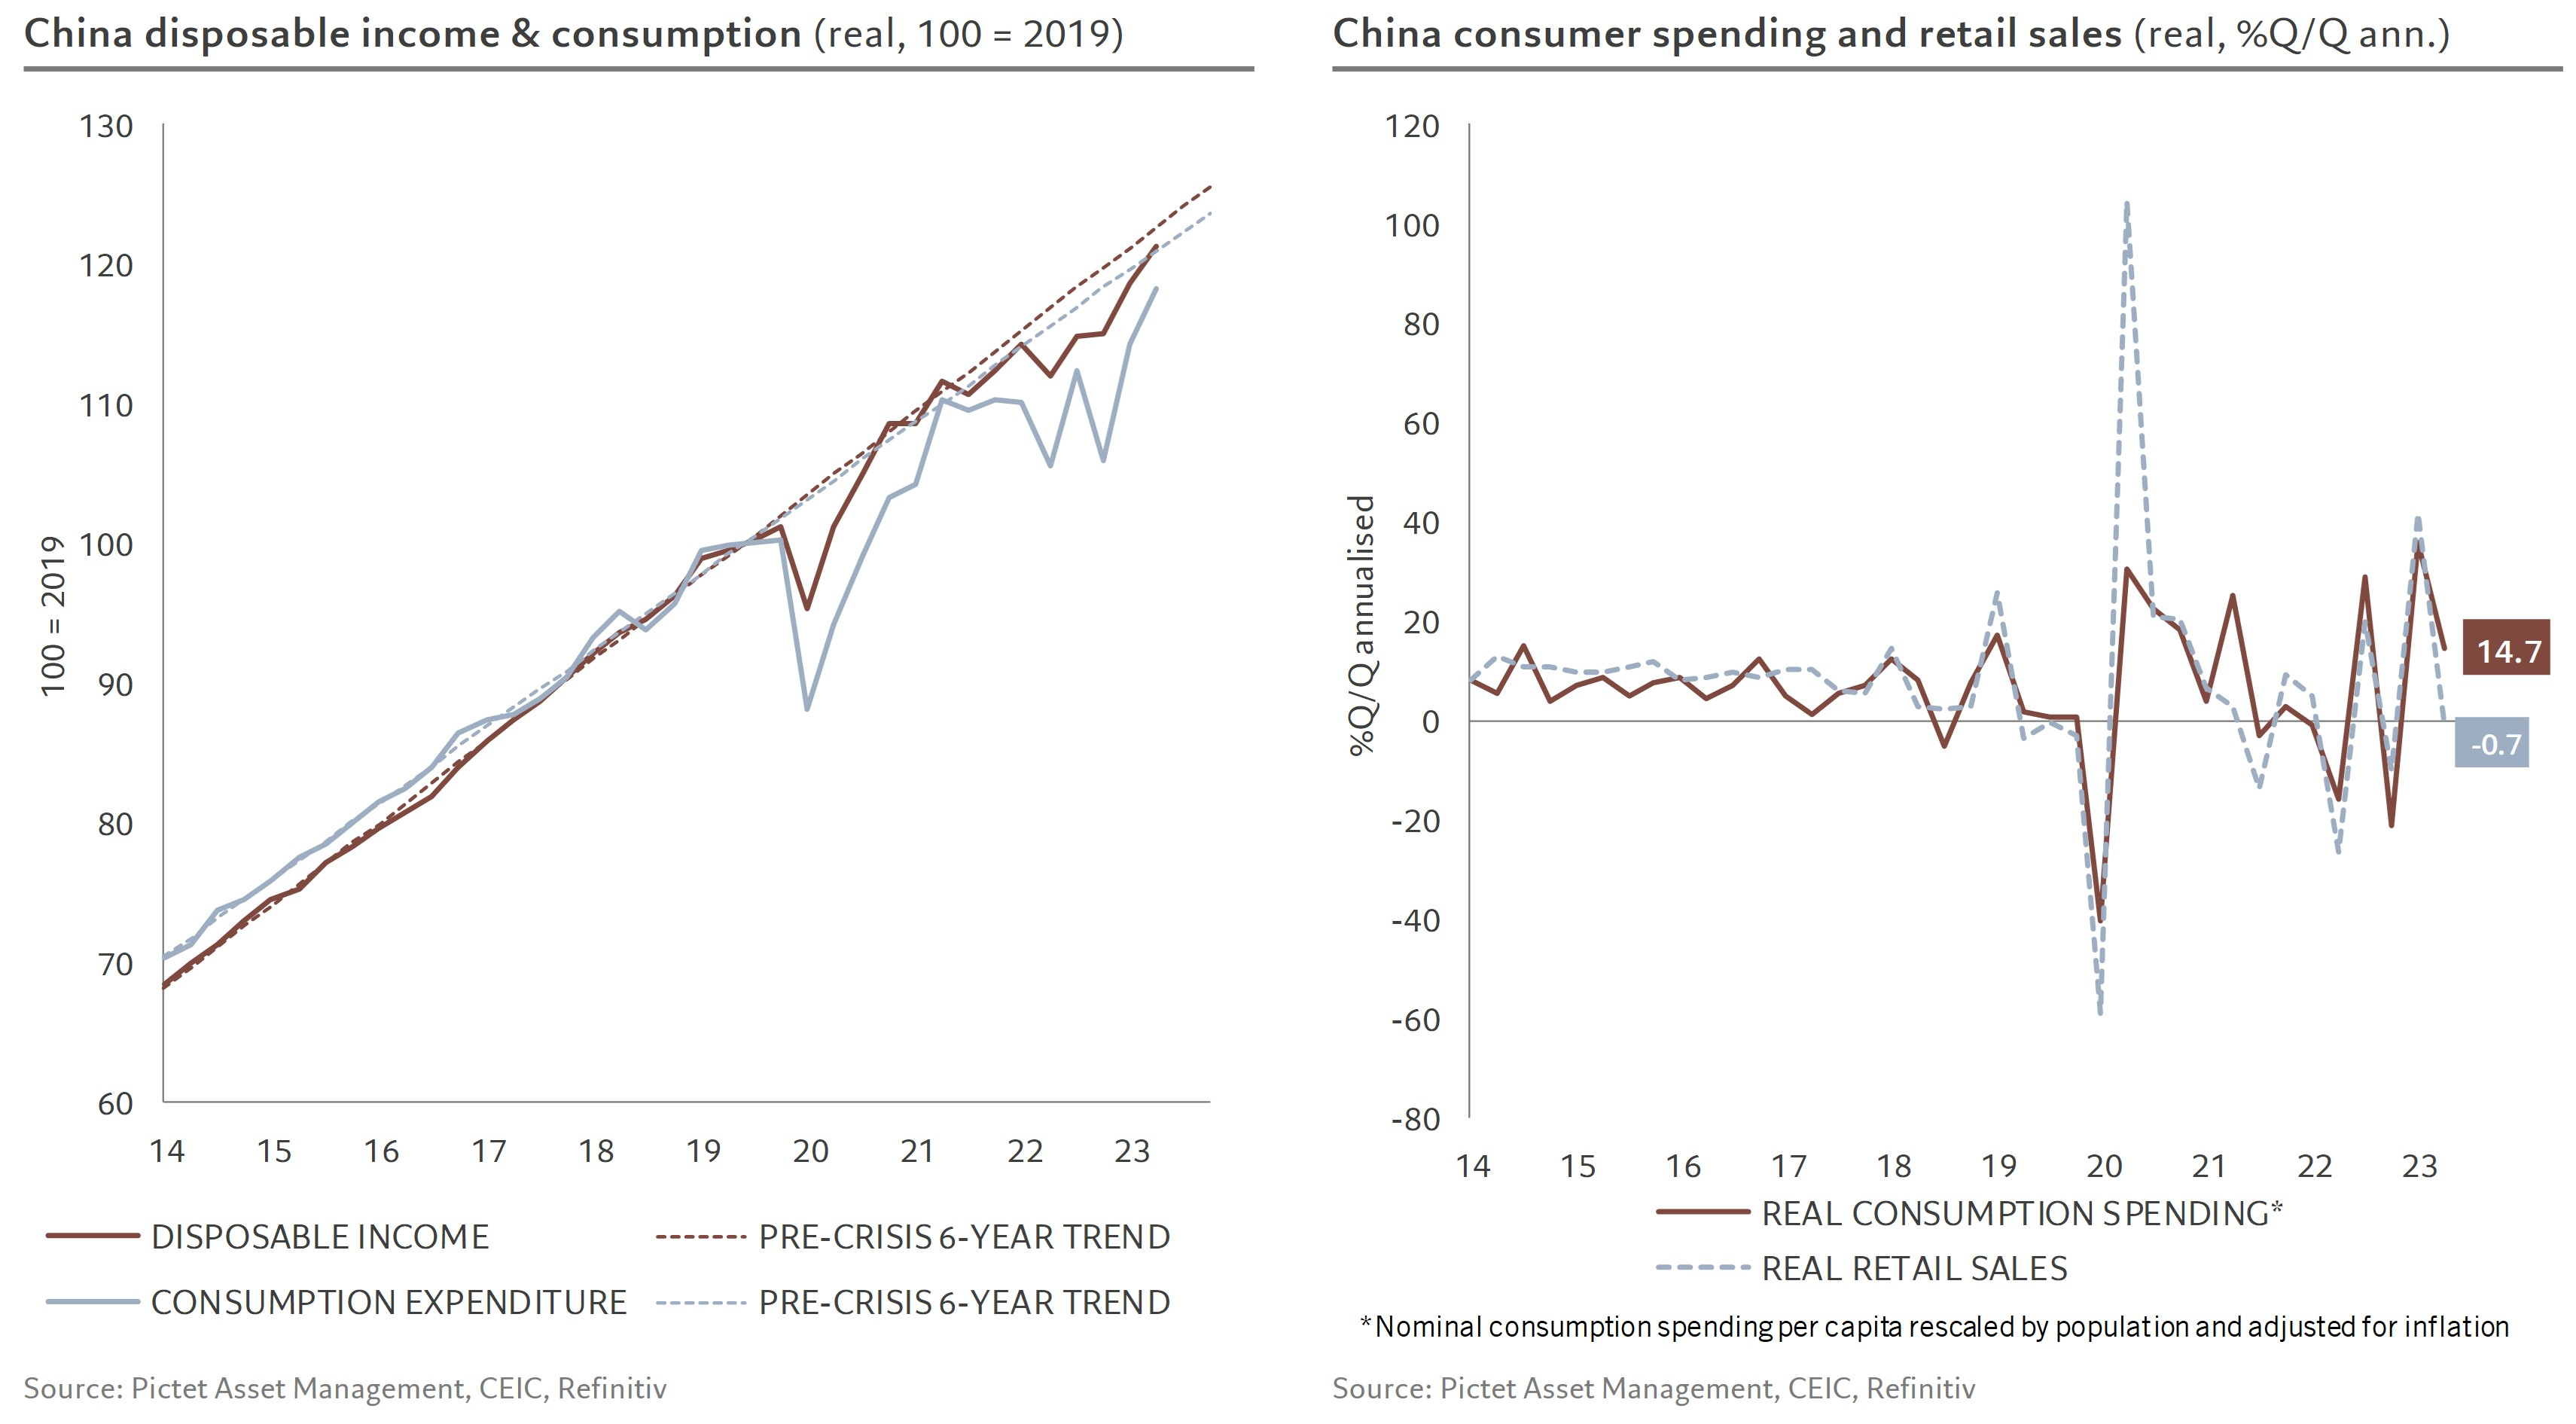
However, total consumer spending shows a different picture: up >14 q/q ann. (vs -0.7% for retail sales) and supported by an increase in real household disposable income of 9.5% q/q ann.
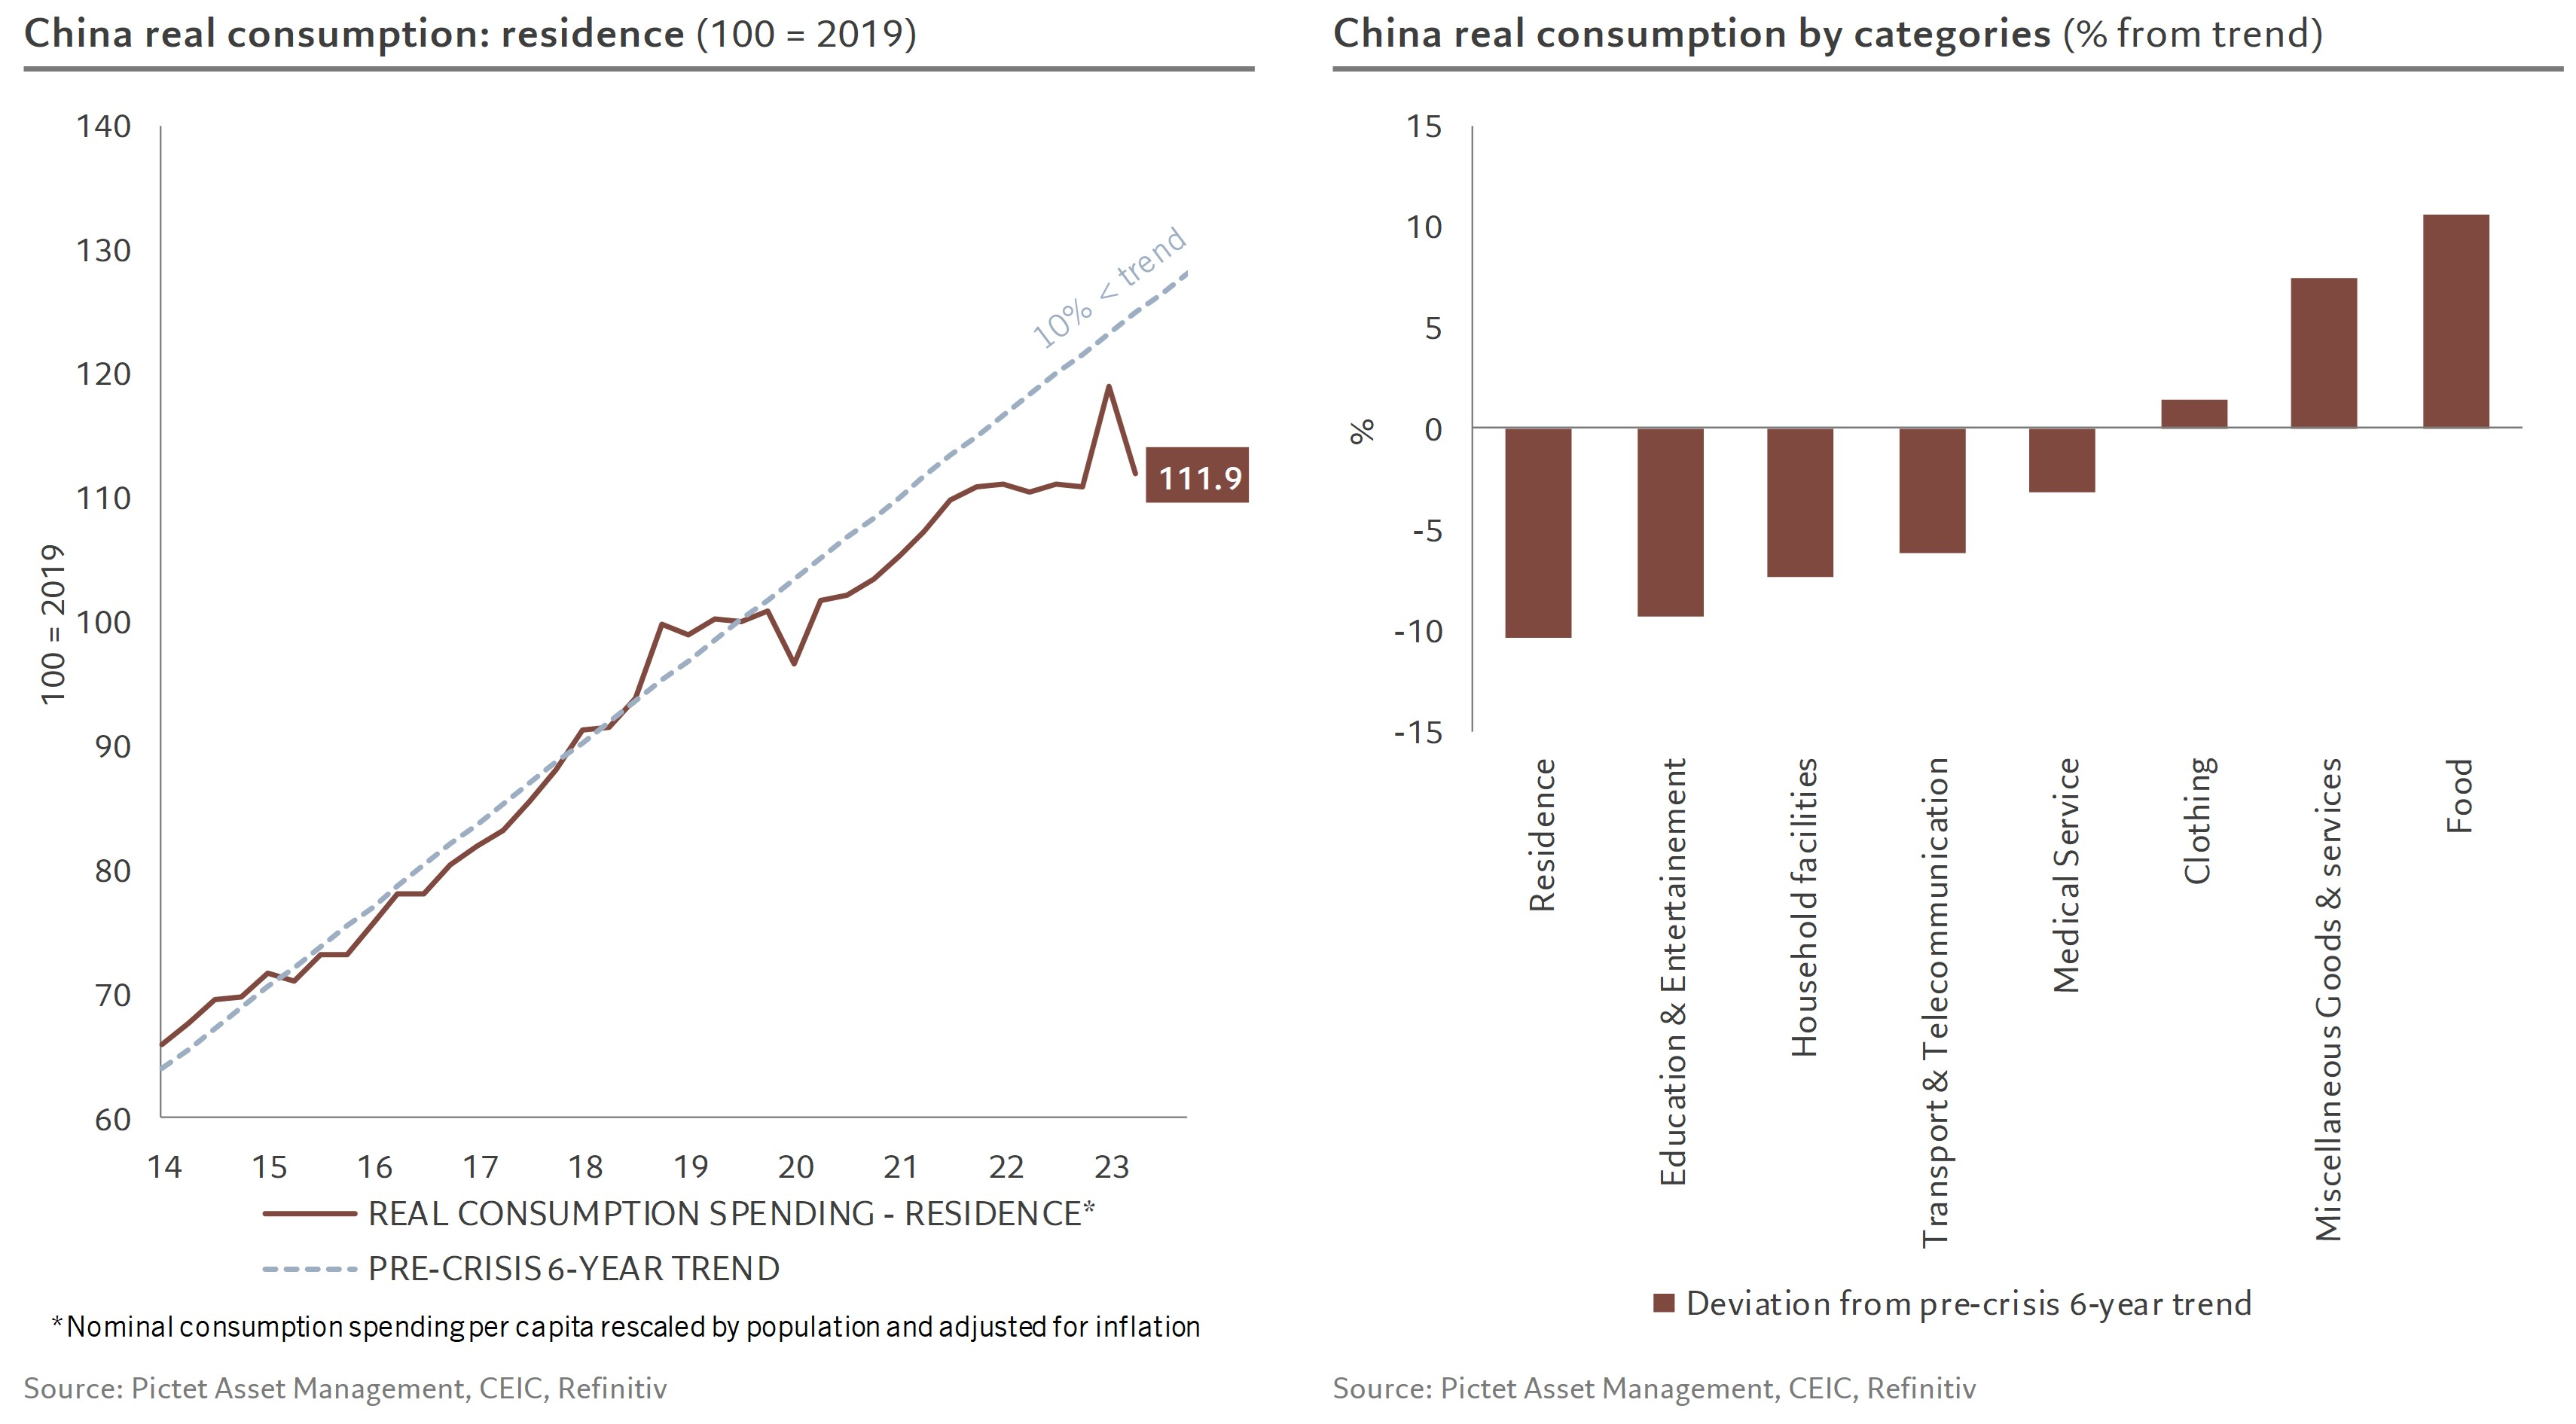
Consumer spending is up in all categories, especially food (+35% q/q ann.) and clothing (+51%), except for real estate, which is down 22%
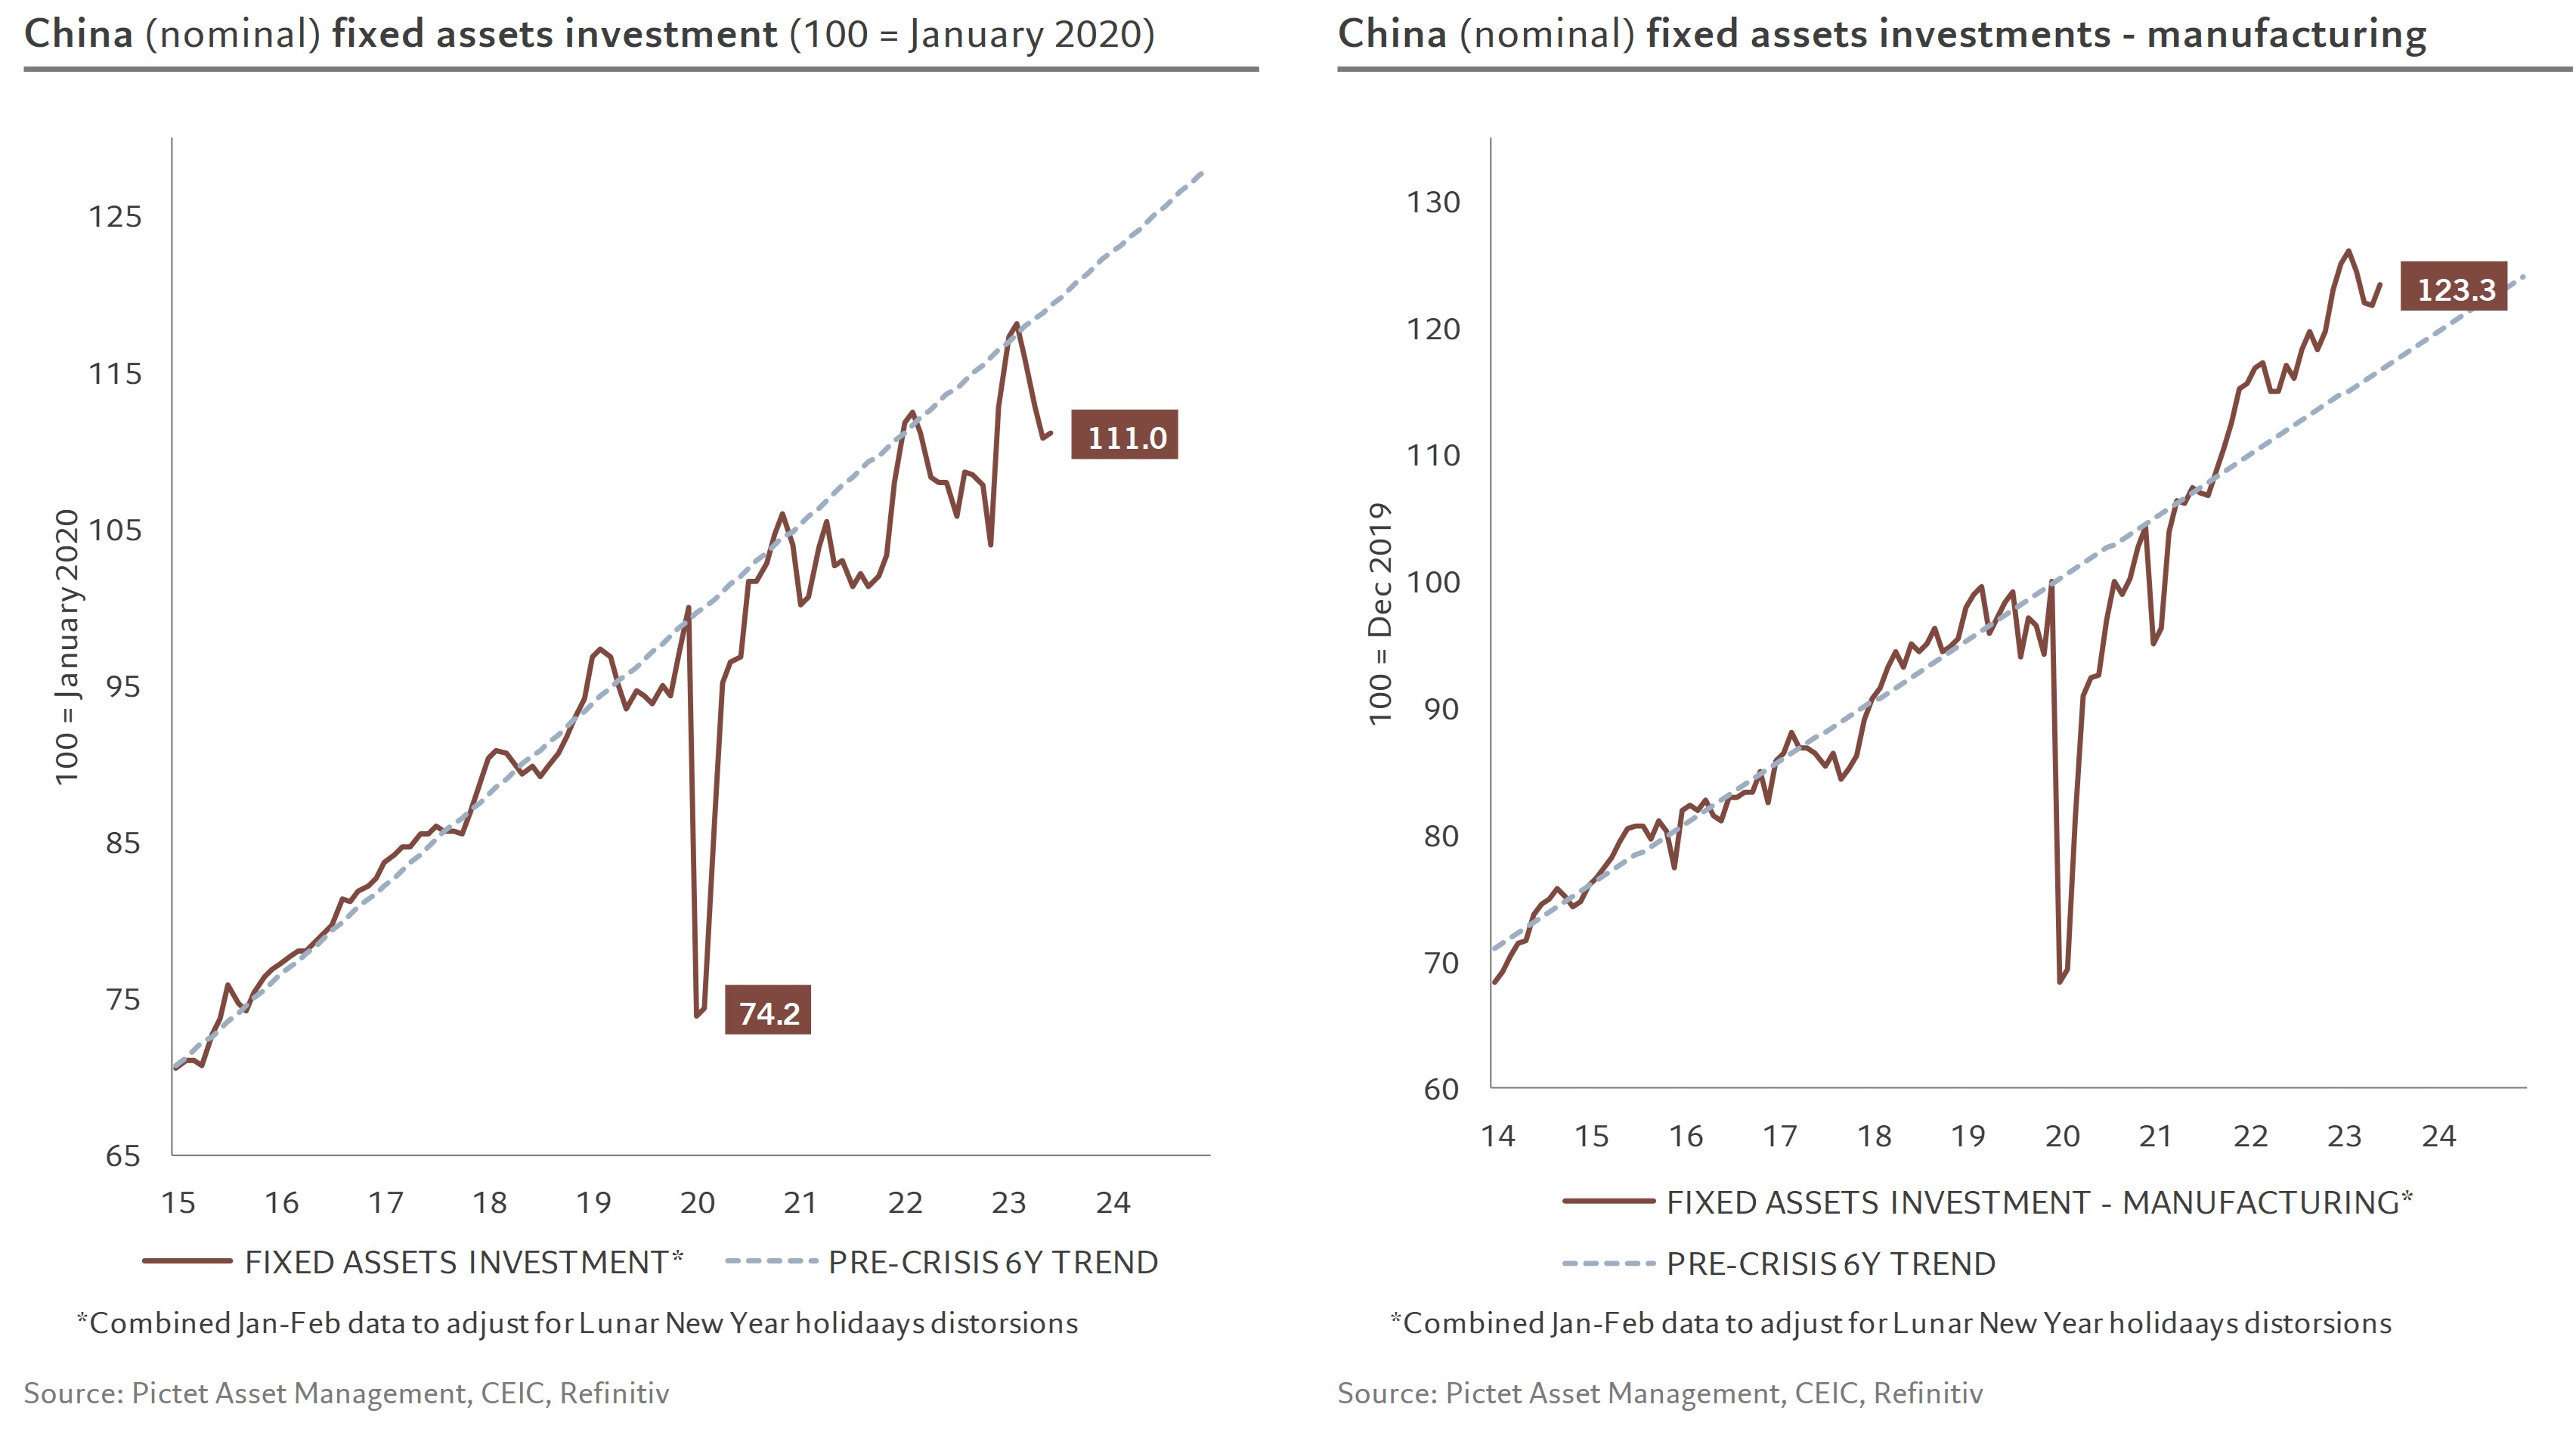
fixed investment rebounded very slightly over the month, driven by manufacturing ...
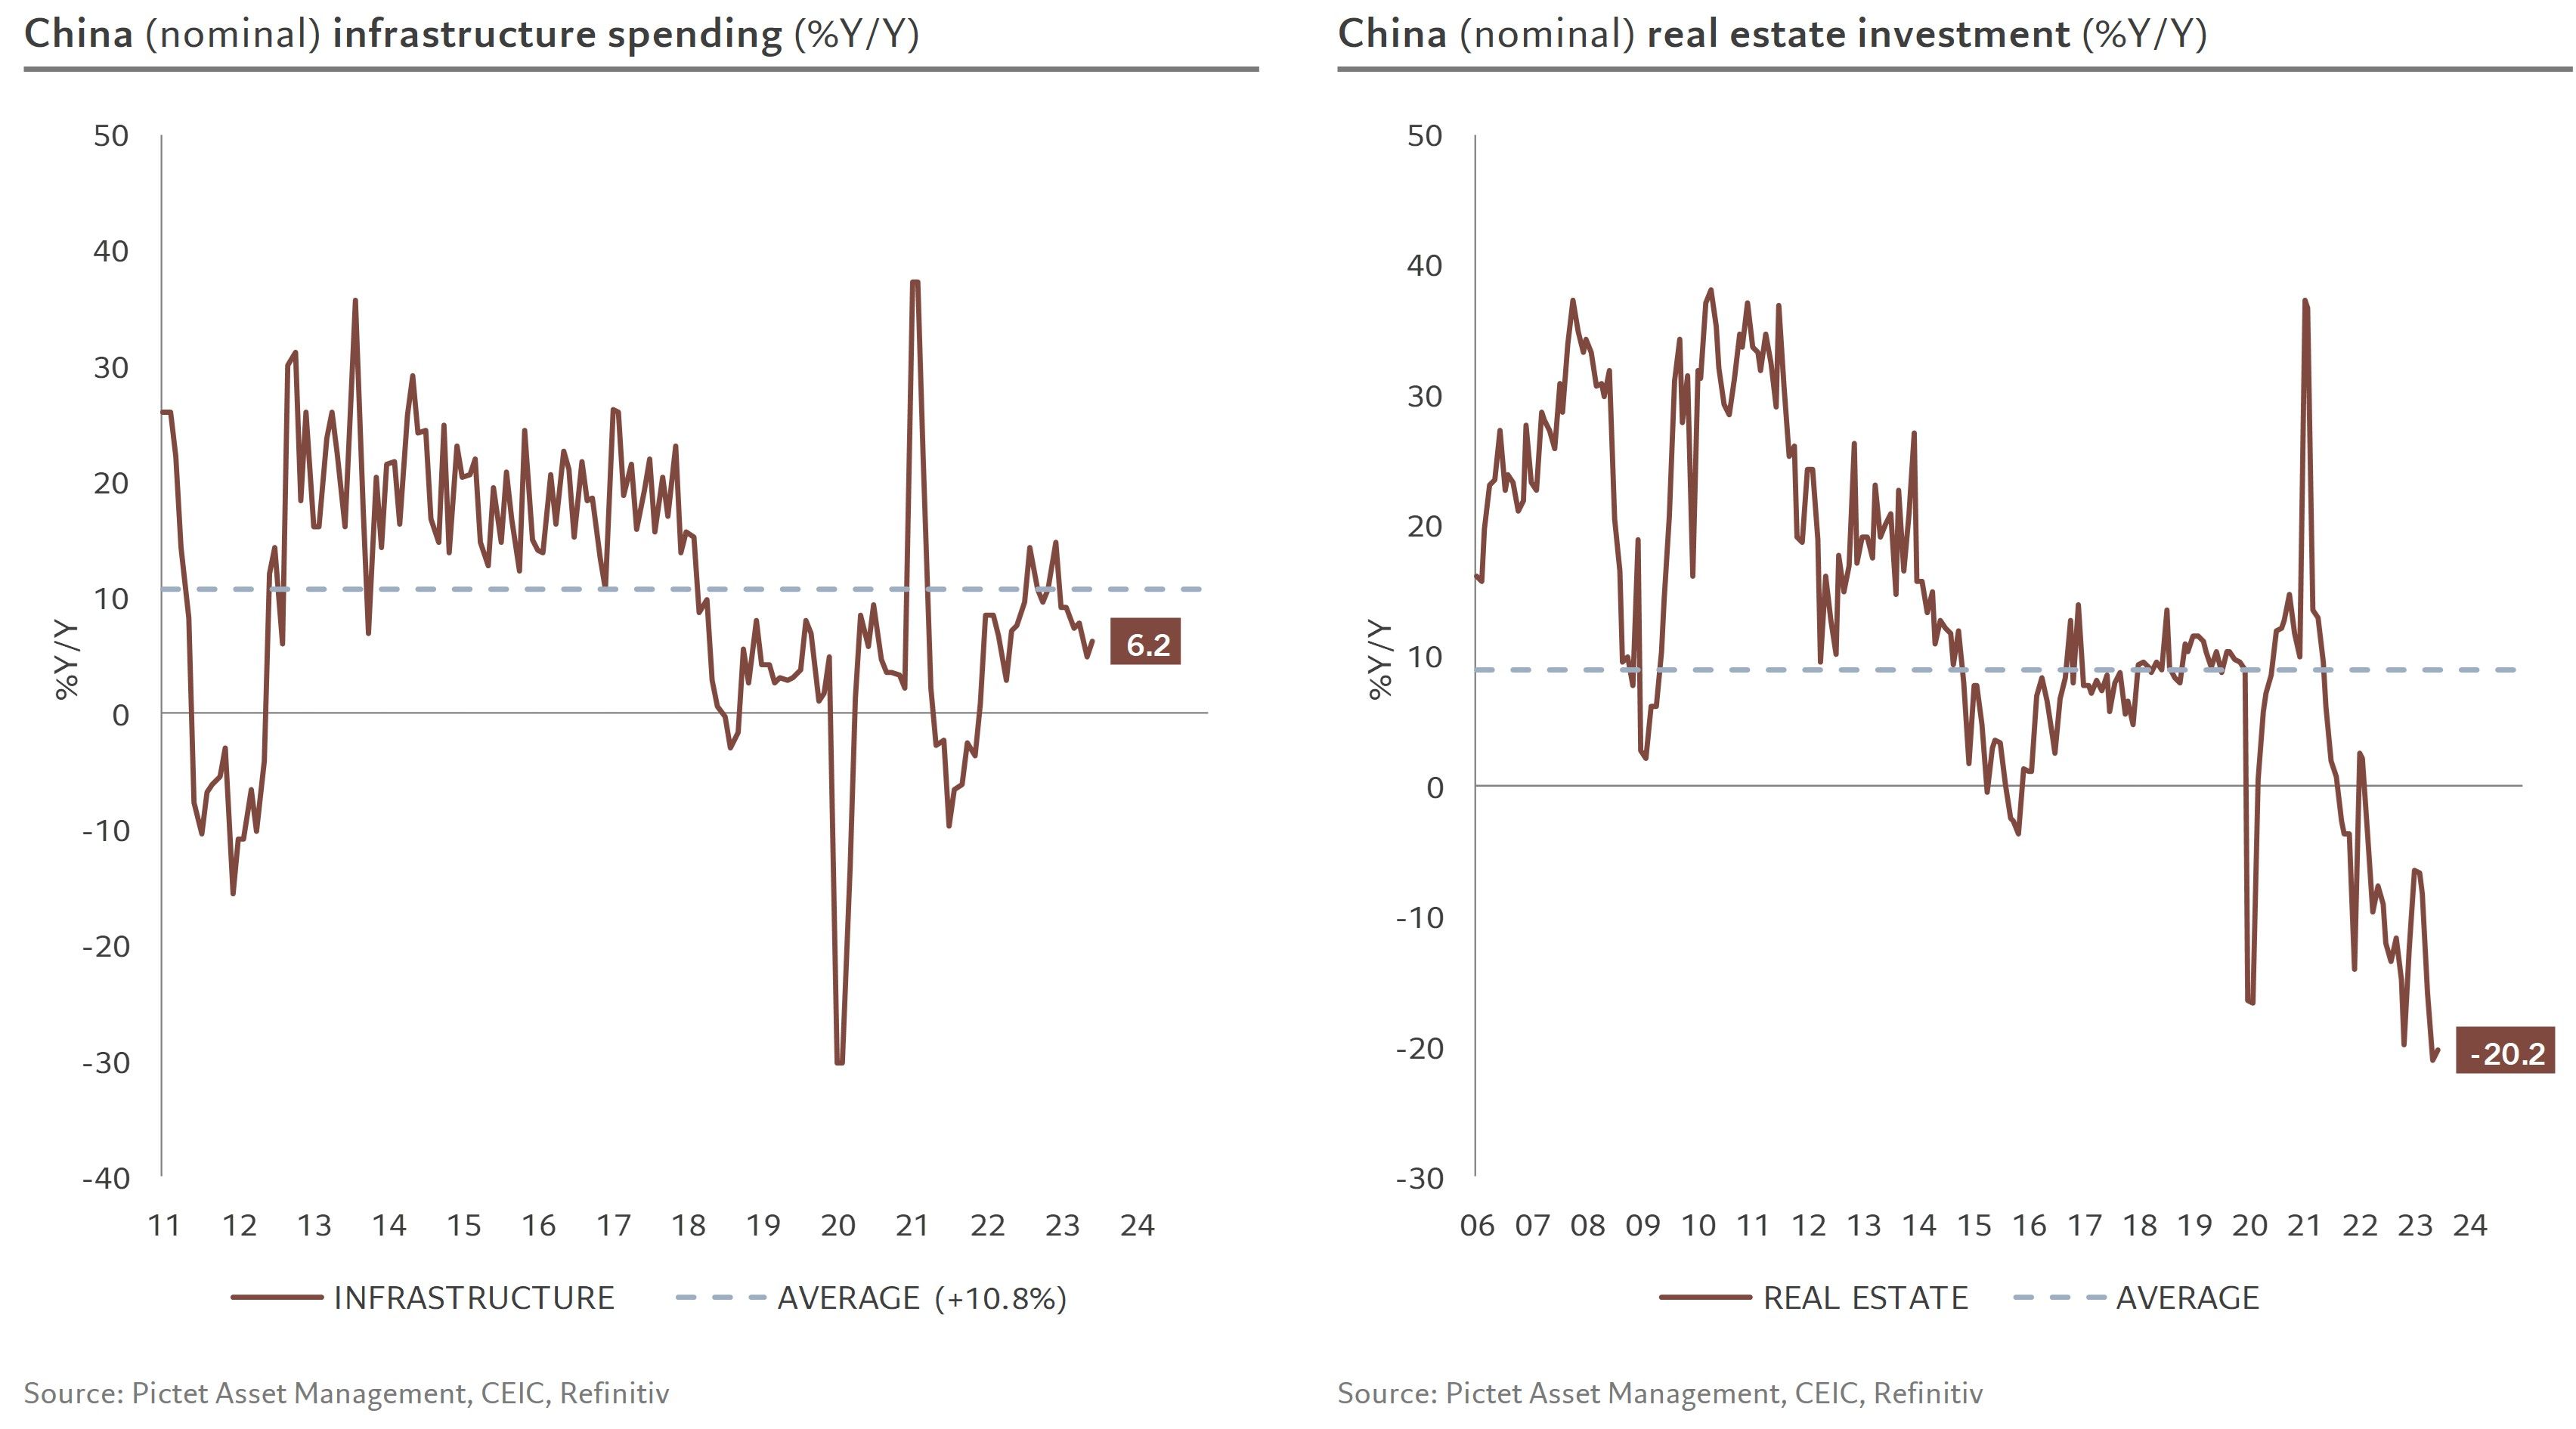
… and infrastructure spending, while investment in the real estate market remained sharply down
Source Tweet - Patrick Zweifel
How significantly have US tariffs on Chinese goods changed bilateral trade flows between the U.S. and China?

This is a harder question to answer than it first appears:
- The US and Chinese data don’t agree.
- The pandemic broke out just after the Trump tariffs, with enormous implications for global trade
- Now trade is slowing as global demand for goods recedes.
But China’s share of US imports has dipped in recent months, so it makes sense to take a closer look at what is happening – using the US data, the Chinese data and comparisons between the US and the EU.
WSJ - China’s Share of U.S. Goods Imports Falls to Lowest Since 2006
Start with the basics – per Chad Bown, the tariffs covered roughly 2/3rds of US trade with China (Apple was too big tariff, a few other firms got off too …) and they increased the average tariff by about 15 percentage points.
PIIE - US-China Trade War Tariffs: An Up-to-Date Chart
So if the tariffs reduced bilateral trade by 15% they would have an elasticity of 1, by 30% an elasticity of two, etc. Note this is for bilateral trade – the main effect of the tariffs in every study has been to shift US imports to others in Asia, not to raise US production.
Start with US imports as a percent of US GDP. Imports are down by about 0.5 pp of GDP, or around 20% (so an eyeball elasticity of just over 1.)
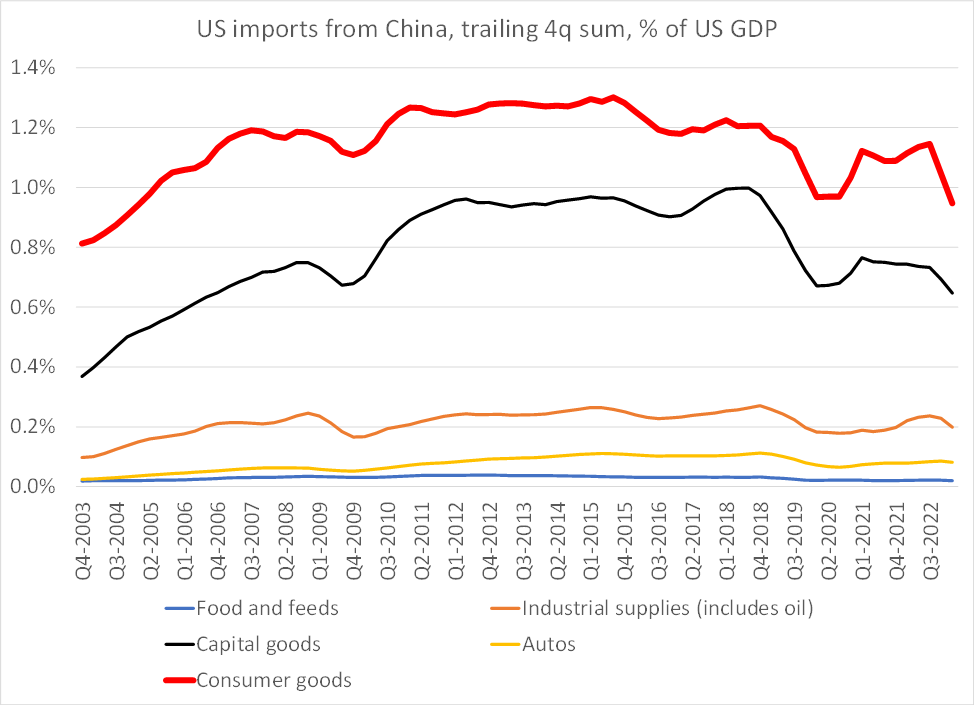
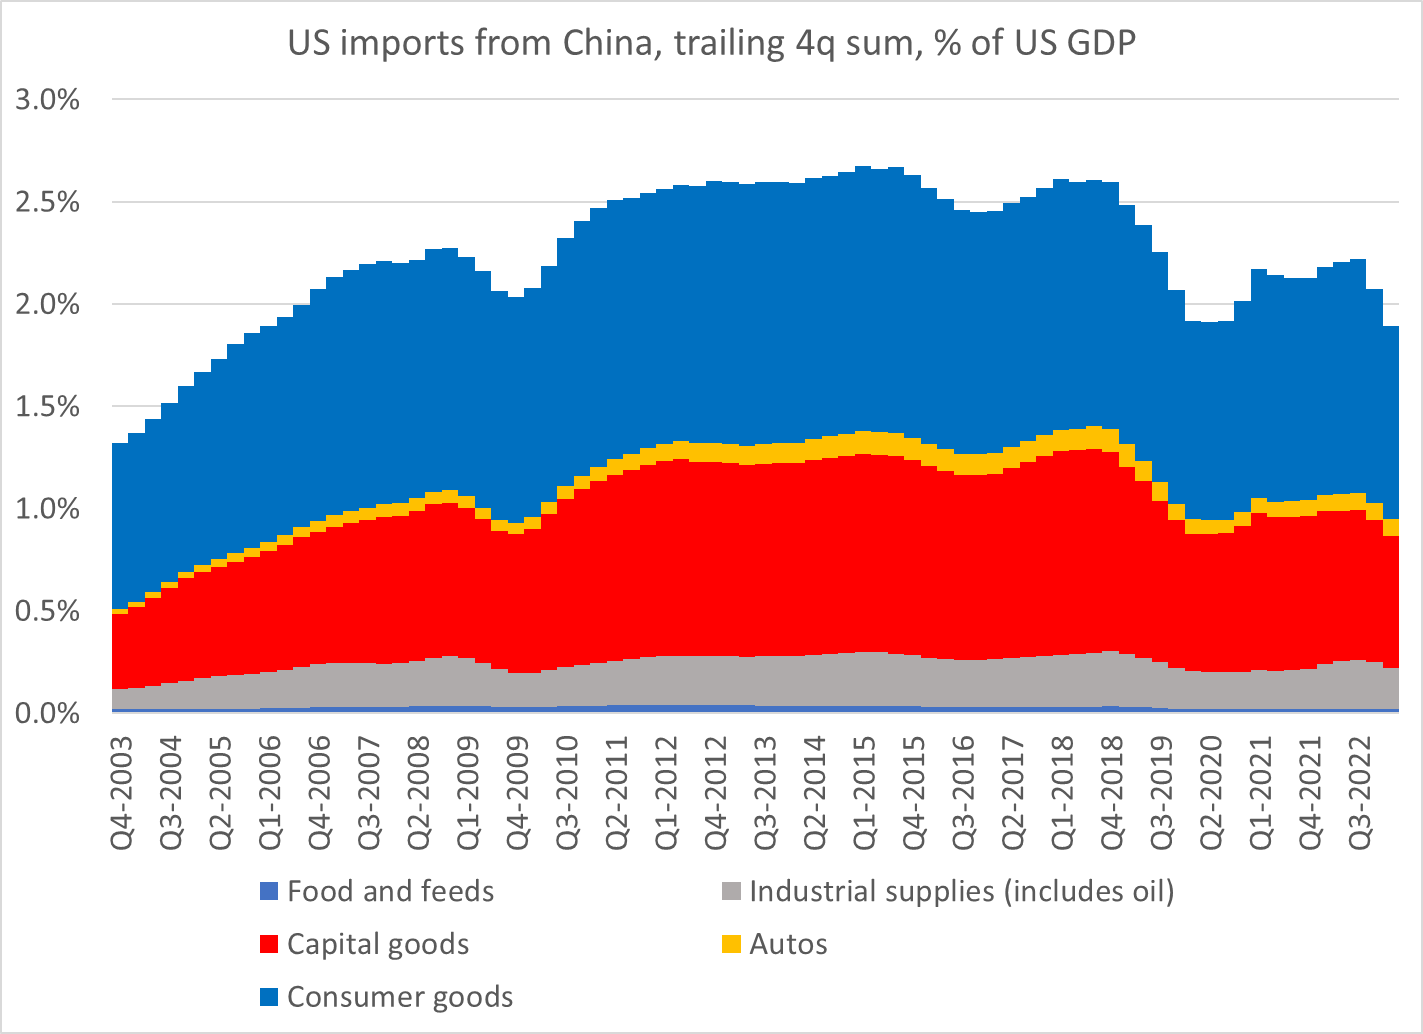
Now look at that breakdown by the “end use” categories.
The initial impact on consumer goods was modest but there has been a recent fall
The initial impact on capital goods was more pronounced
No real impact on industrial supplies (mostly chemicals ) or autos
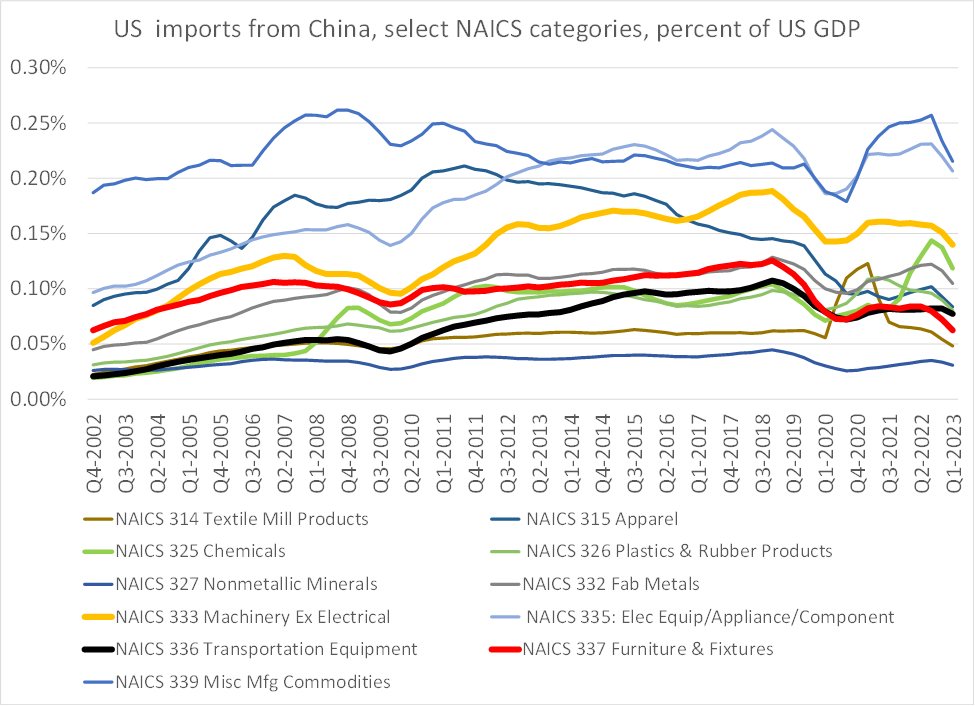
Now use some of the most important “NAICs” categories excluding the huge electronics category (NAICS 333) – where there has been a big fall, led by semiconductors.
The picture is mixed. Some big falls. Some points of surprising resilience.
A bit of specialized knowledge helps here. Misc manufacturing (NAICS 339) includes medical equipment. Textile mill products includes a lot of material for PPE. The big impact on furniture is real.
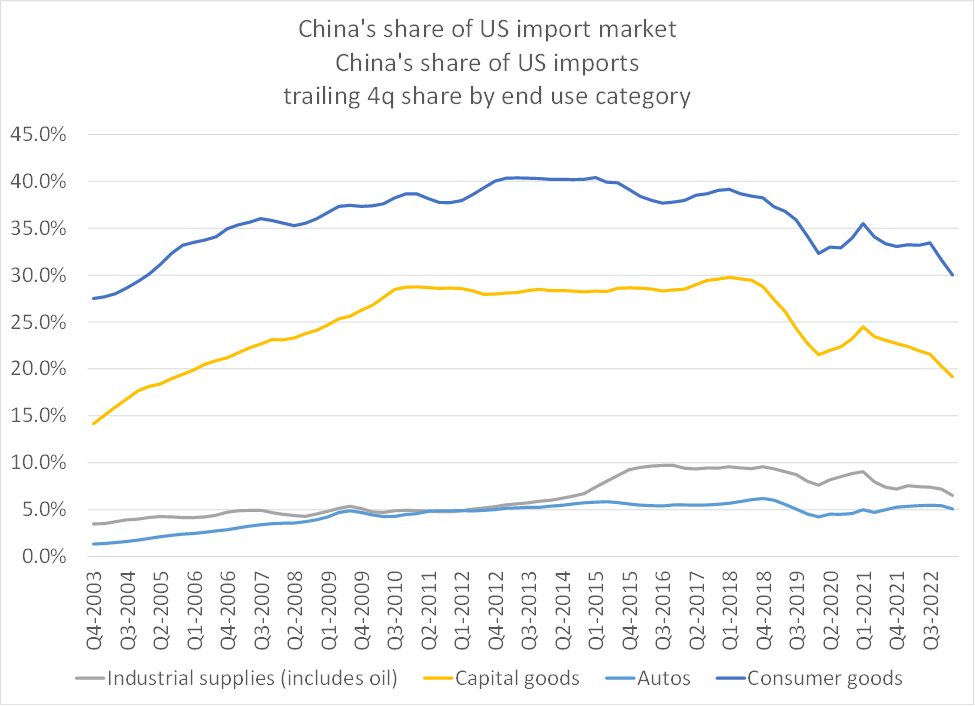
What about China as share of all US imports –
In the end use data the biggest impact is on capital goods (heavily tariffed, elasticity of 2) There is a smaller impact on consumer goods and almost no apparent impact on autos (heavily tariffed).
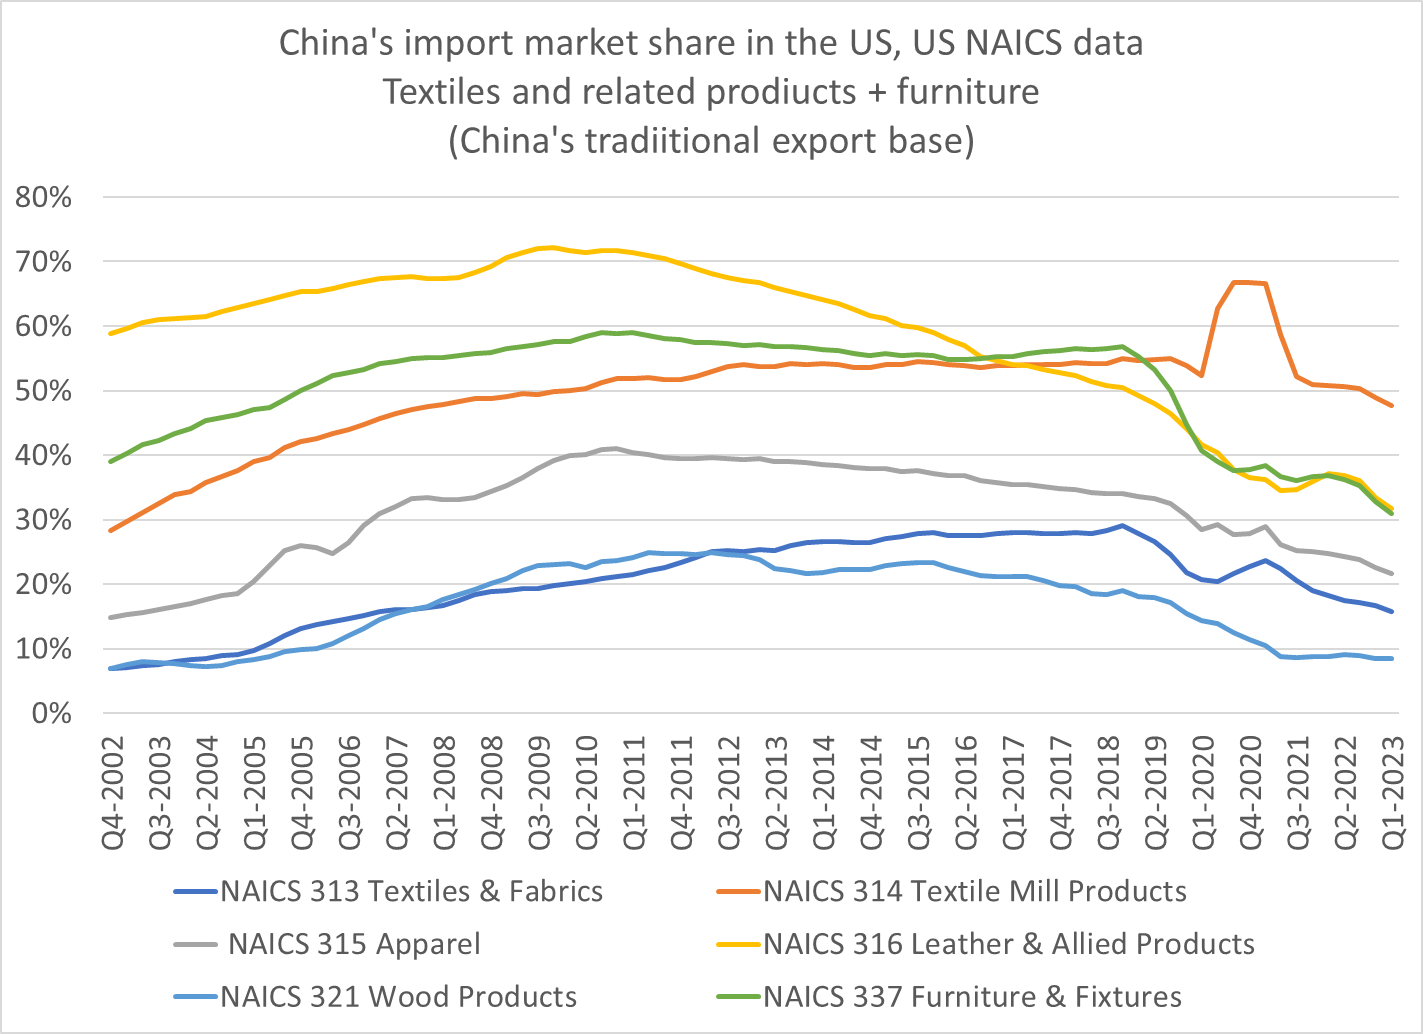
Now some NAICS categories – starting with China’s old school export sectors – sectors where China’s market share was generally declining even before the tariffs. Furniture stands out, many others "on trend"
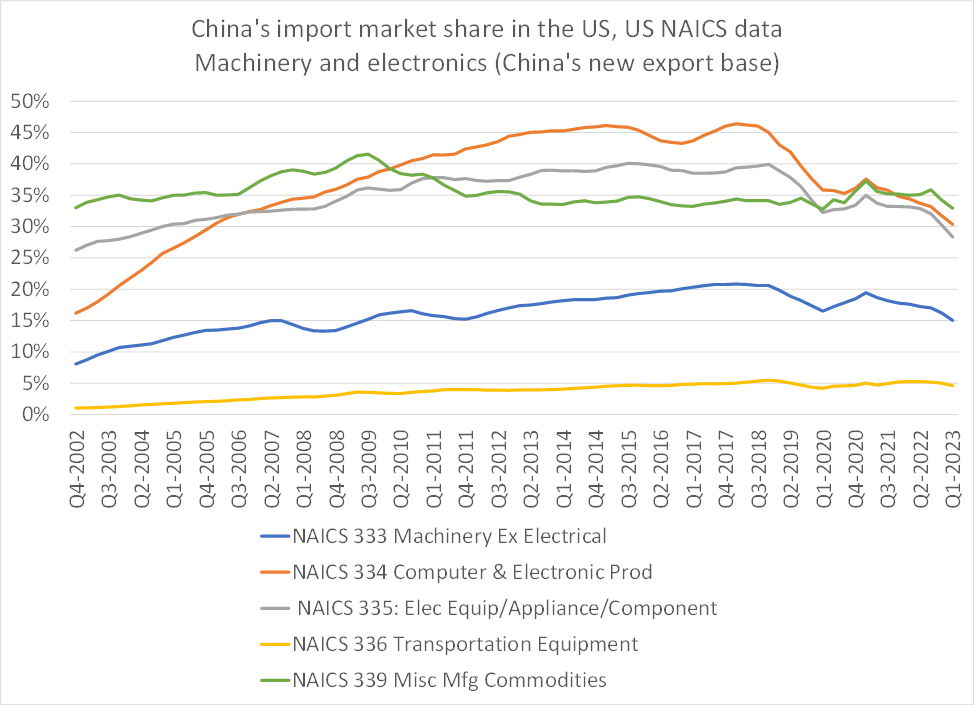
China’s new export base – a bigger impact on electronics than machinery (and autos/ transportation equipt).
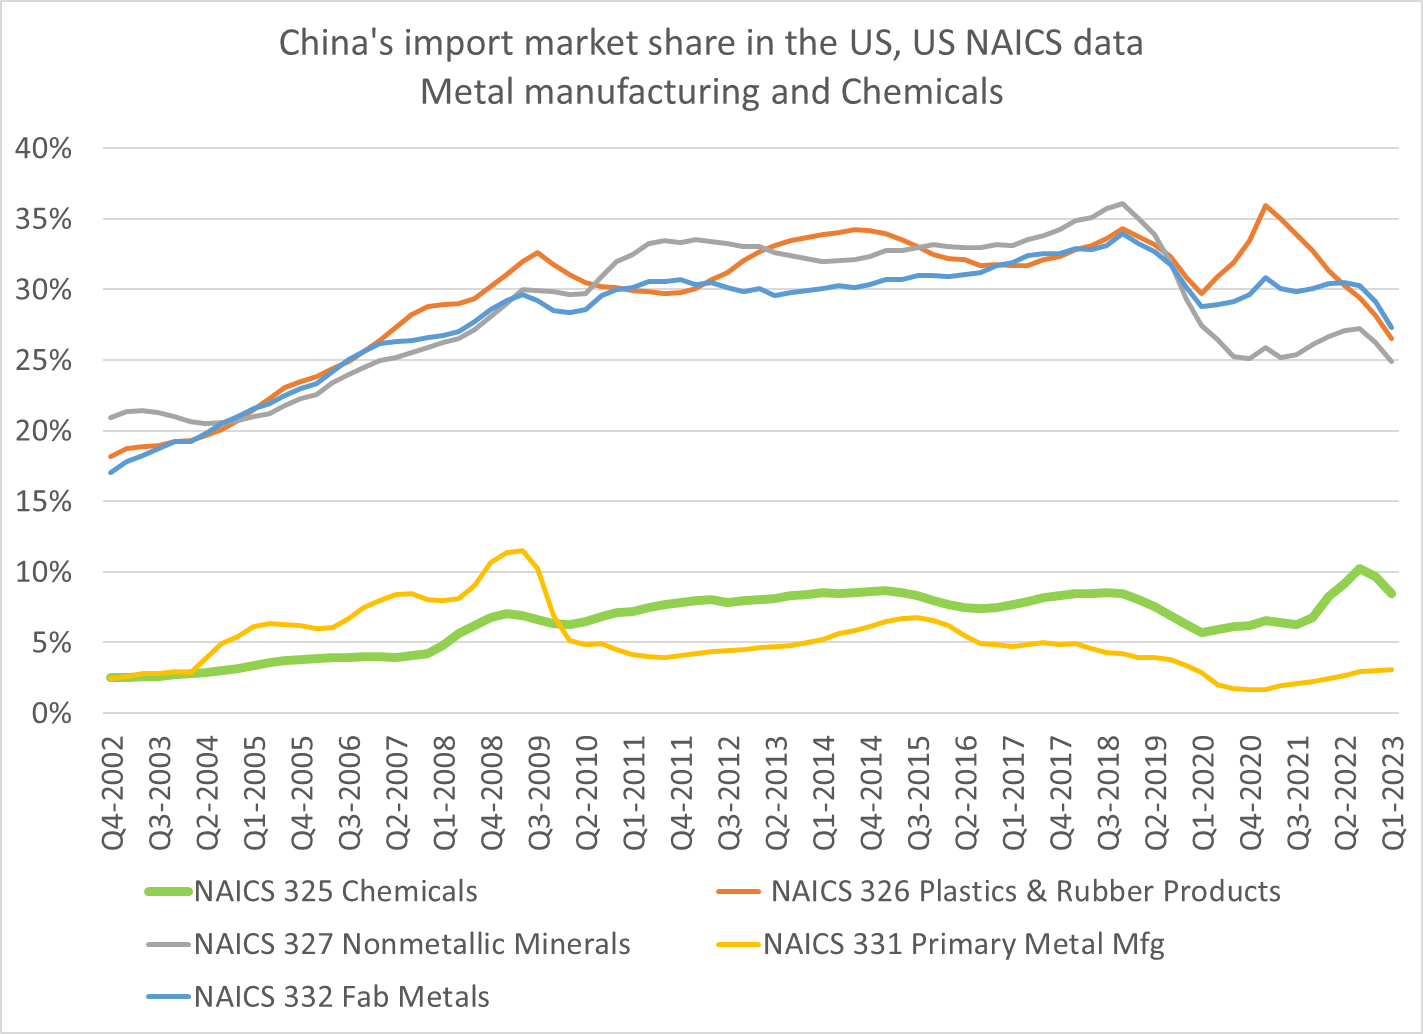
And chemicals and industrial metals. Still kind of crazy to me that the W Administration didn’t respond to the 06 to 08 surge in metal imports from China – it was a different era, politically speaking.
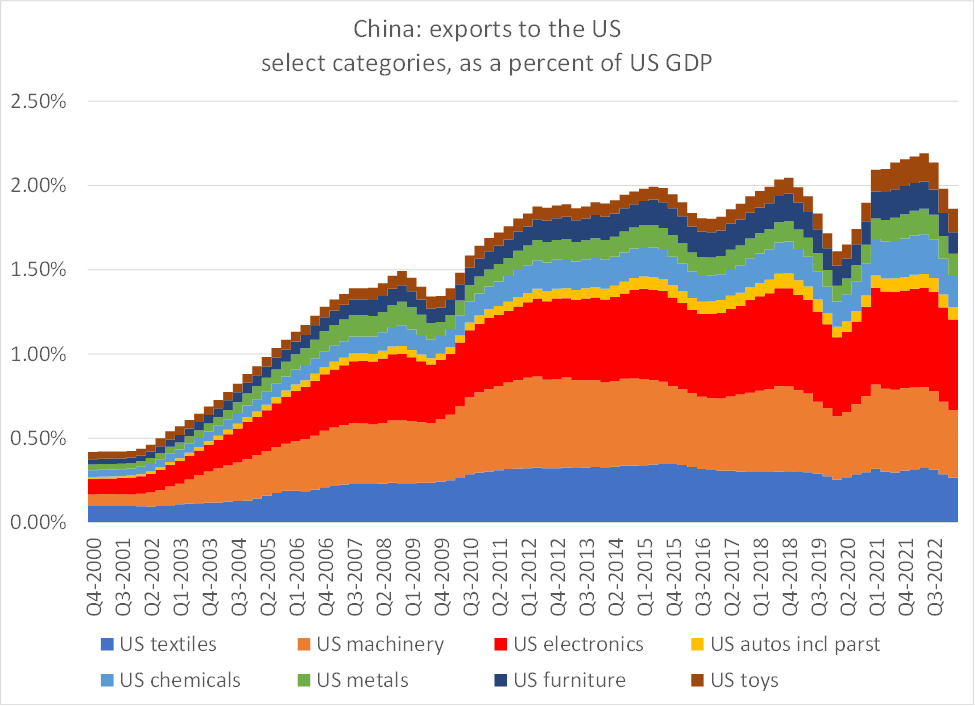
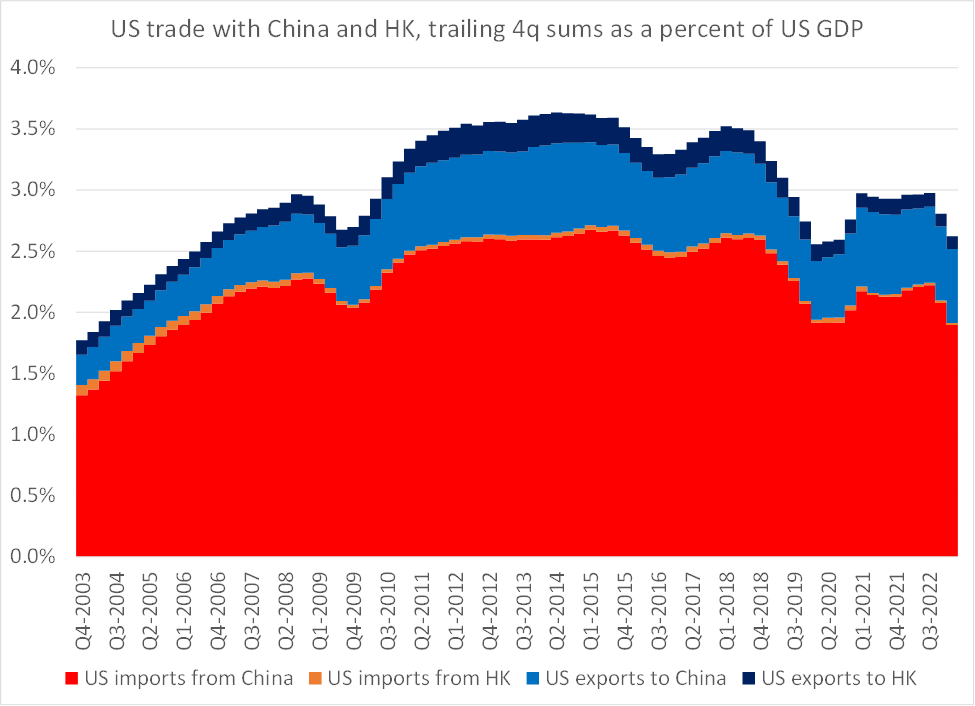
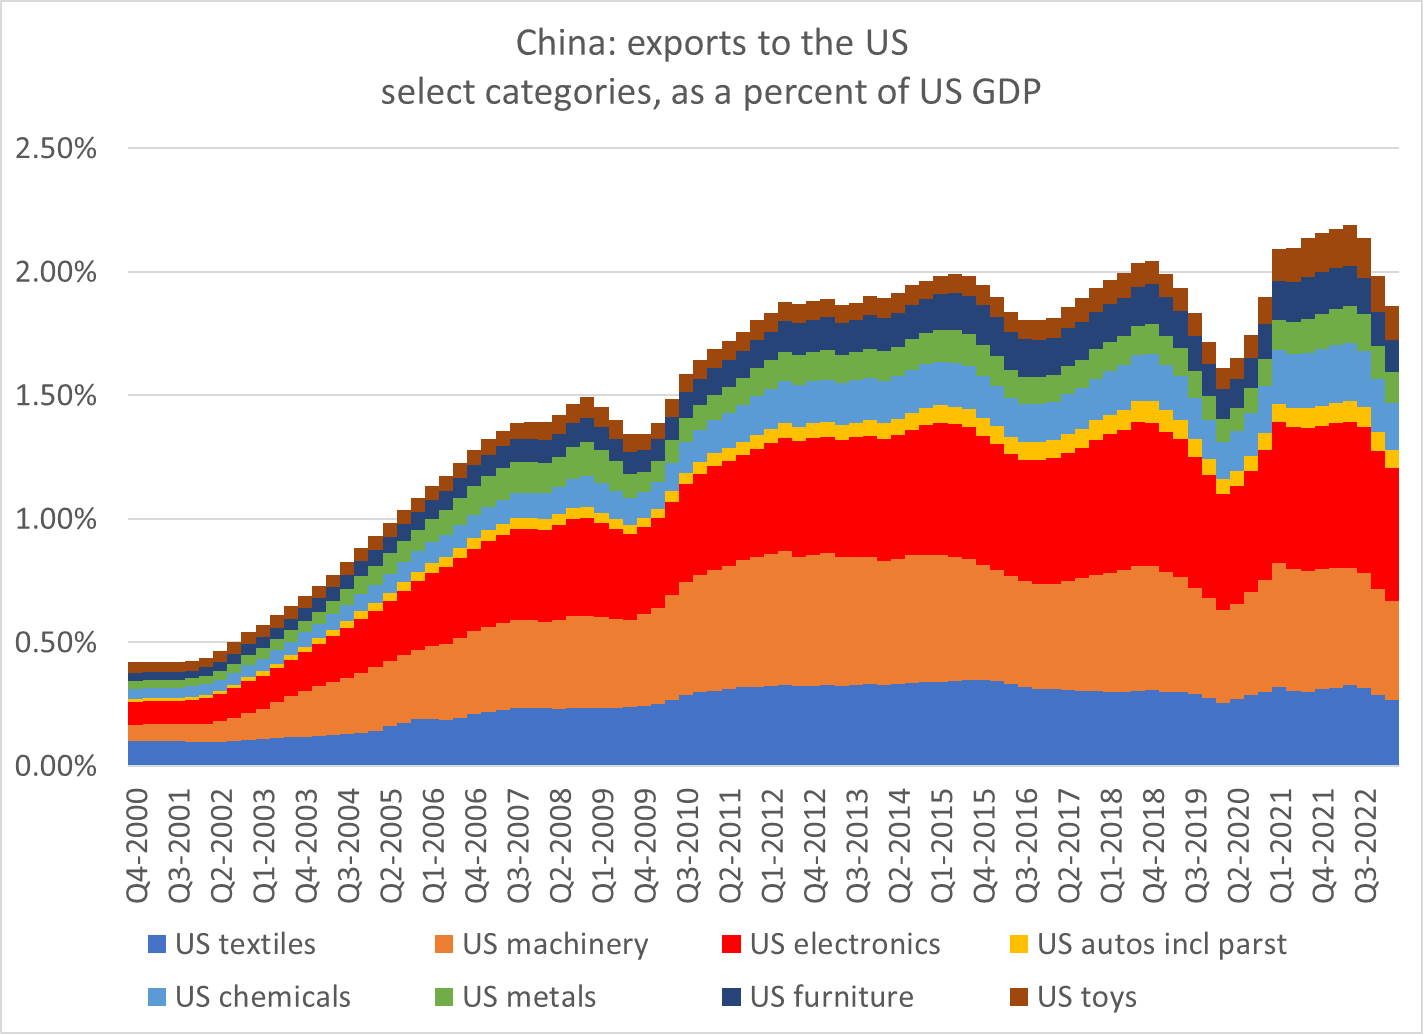
I stress tested the US data against the Chinese data, as China's export data has shown a much less pronounced slide in exports to the US (and thus implies a smaller tariff impact).
I scaled China’s exports (in USD) to US GDP for some key categories.
This is the data that has long impressed me – the tariff impact disappeared in 21 and the first part of 22 (a strange result, which suggested surprising resilience). But there has been a clear slide in the last few quarters.
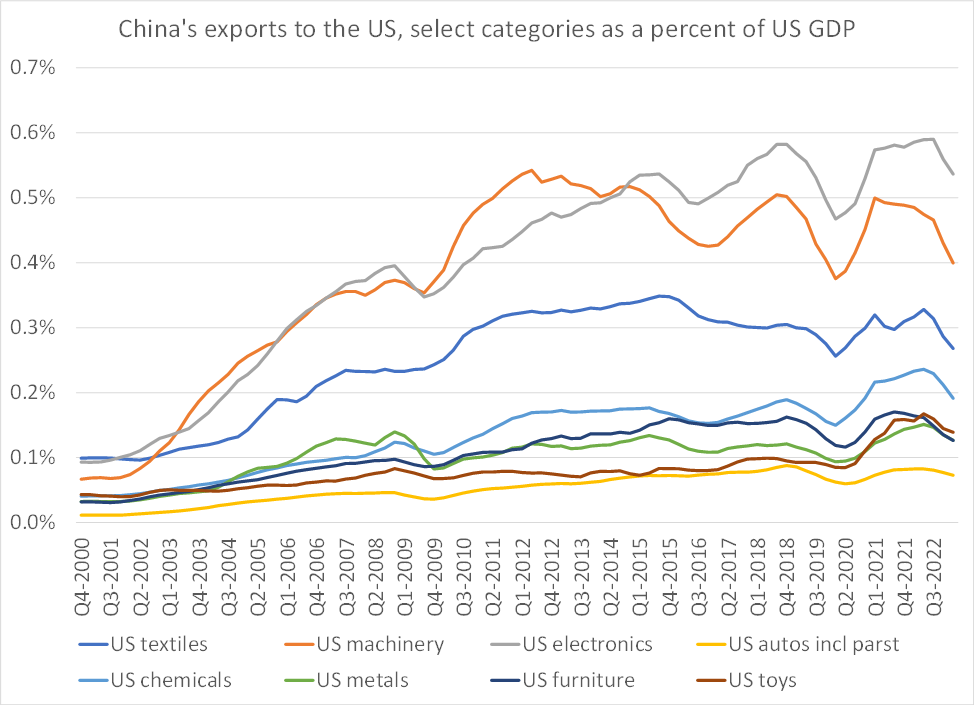
The Chinese data showed almost no impact in electronics until the last few quarters (big gap vis a vis the US) & no change in machinery until recently – and gains in chemicals and toys (pandemic effect). Both data sets agree on autos.
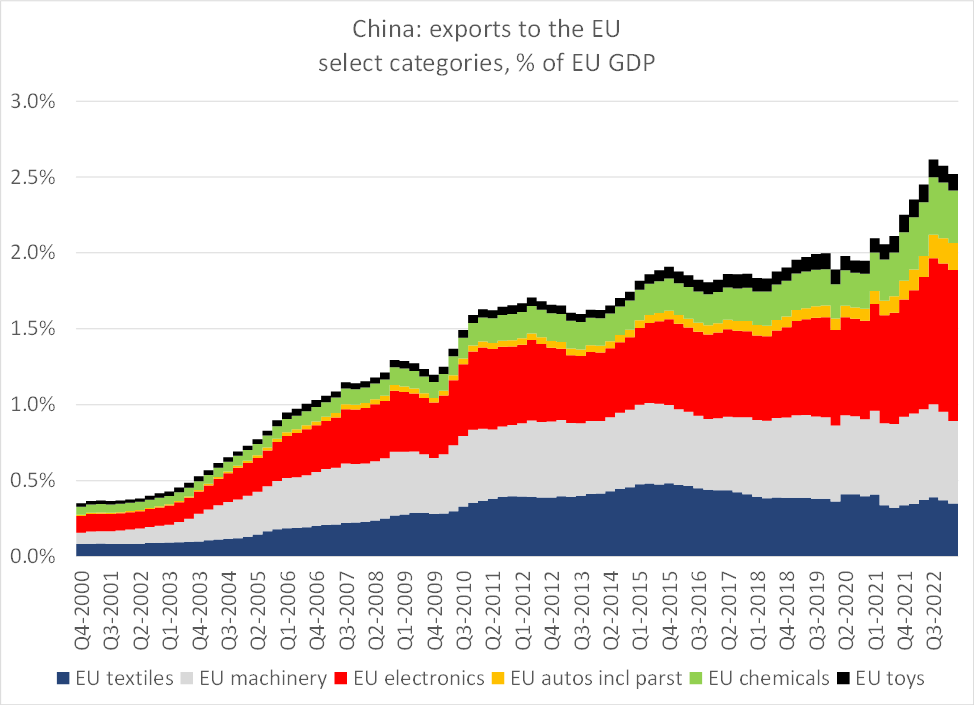
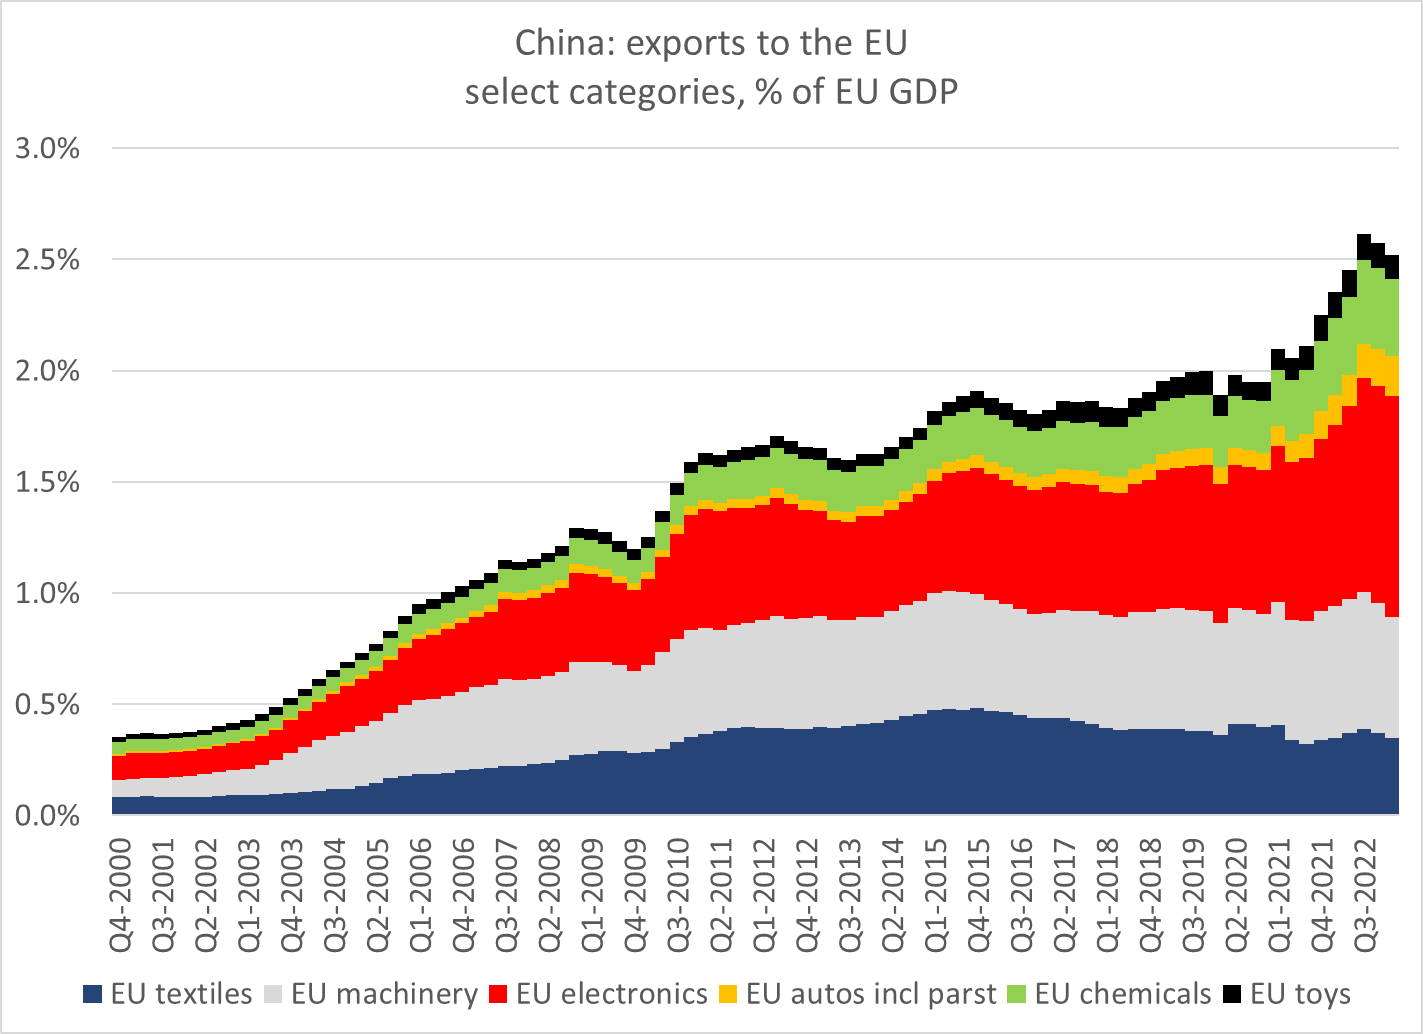
But it is also worth looking at China’s exports to the EU –
Woah …. Big gains during the pandemic. No deglobalization or derisking!

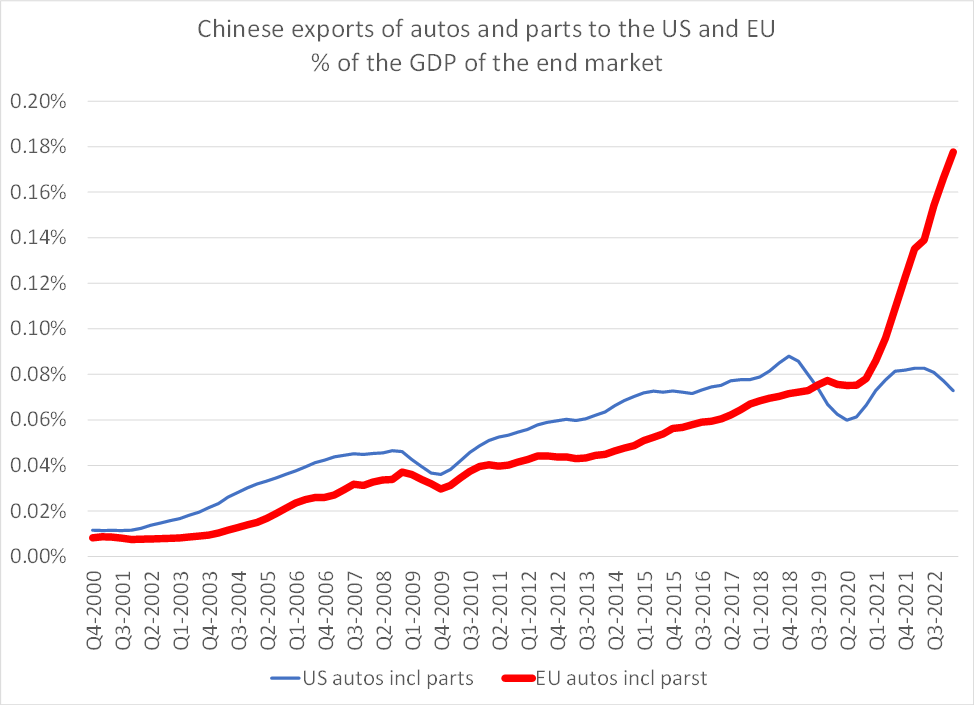
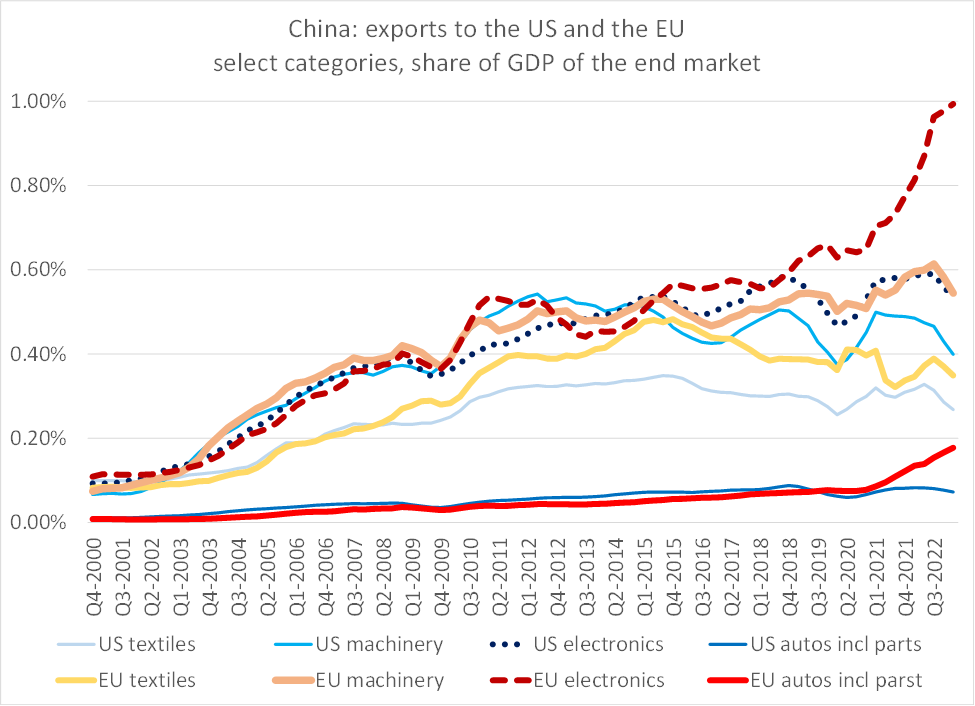
And my favorite presentation – a horse race between the US and the EU, using the Chinese export data scaled to the GDP of the final market.
Look at electronics and autos!
In machinery and textiles, the US and the EU numbers both turned down over the past few quarters, pointing to a Chinese or a global source of the slowdown.
But there is a "but for the tariffs" impact in electronics.
But for the tariffs, US imports of electronics from China (judged using the Chinese data) would have soared.
Same for autos now ...
So where do I end up -- the tariffs have had an impact, even if the impact up until recently wasn't obvious in the Chinese data. But for the tariffs, US imports from China likely would have tracked EU imports ...
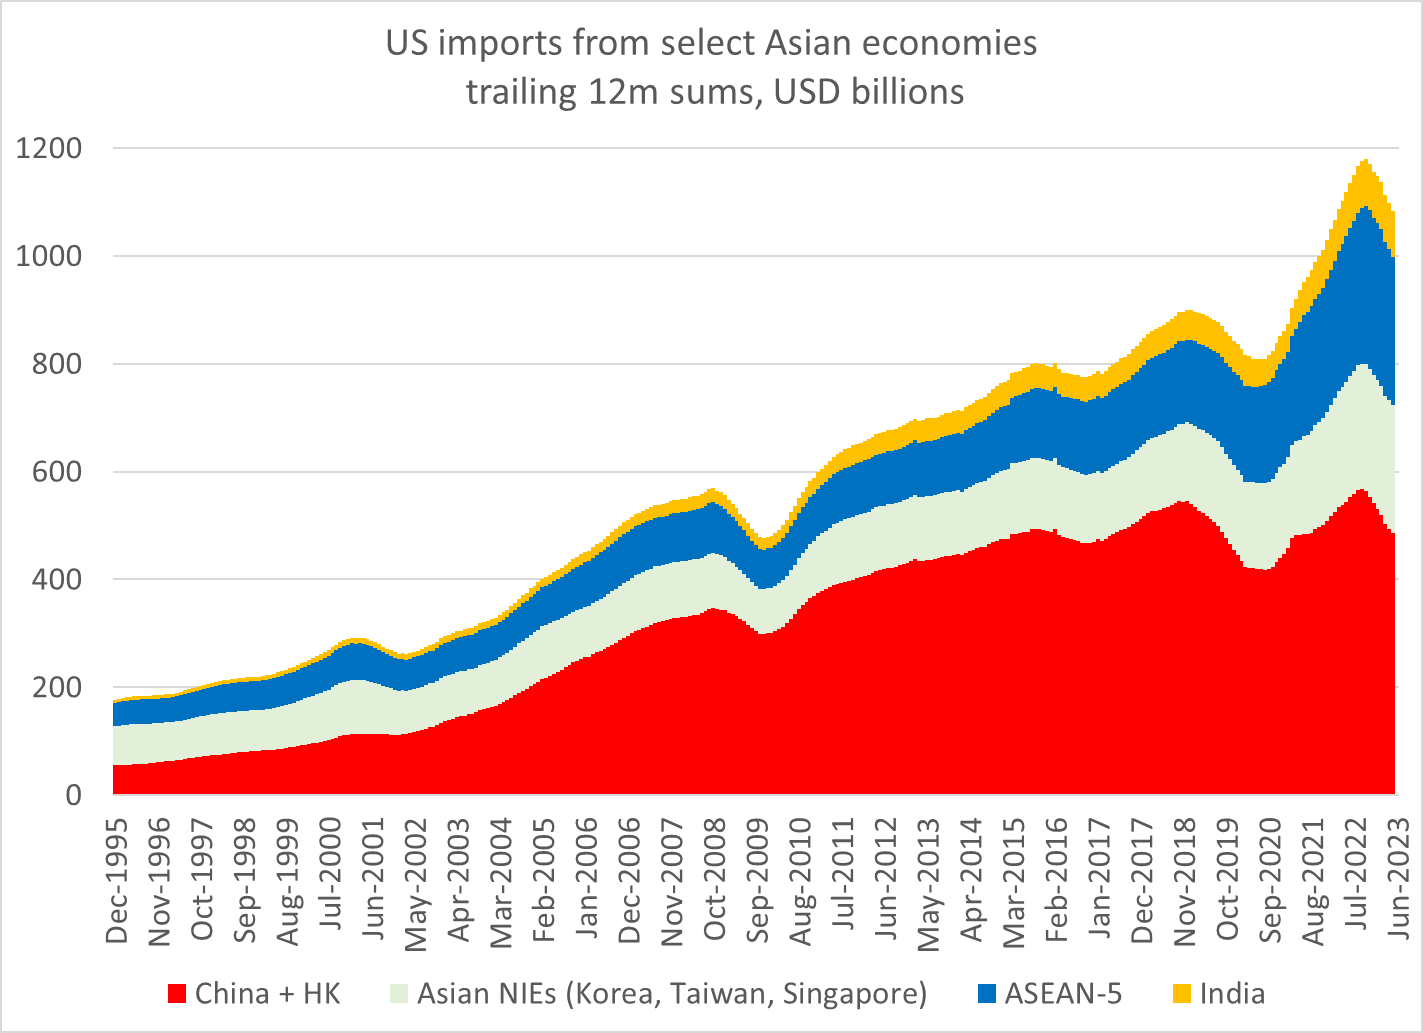
But I would also caution that the bilateral trade data is a very poor measure of actual trade. A lot of Chinese content now comes into the US market from SE Asia.
"Derisking" solar trade for example would mean more than importing panels made with Chinese polysilicon and wafers (if not cells) from Vietnam and Malaysia ...
Bilateral tariffs are pretty easy to evade.
And of course serious analysis here requires looking beyond the US data on its bilateral trade with China. The Chinese data is at least as important -- and right now both data sets do show a new down leg in trade.
Macro Thoughts
How I am thinking through the big picture and next macro move right now 🤝
Two major ideas:
1) I think inflation is skewed to the downside and the risk is inflation surprising to the downside on a cyclical basis (next 6-18 months).
2) The FED pause is dependent on the tension between inflation and labor market data.
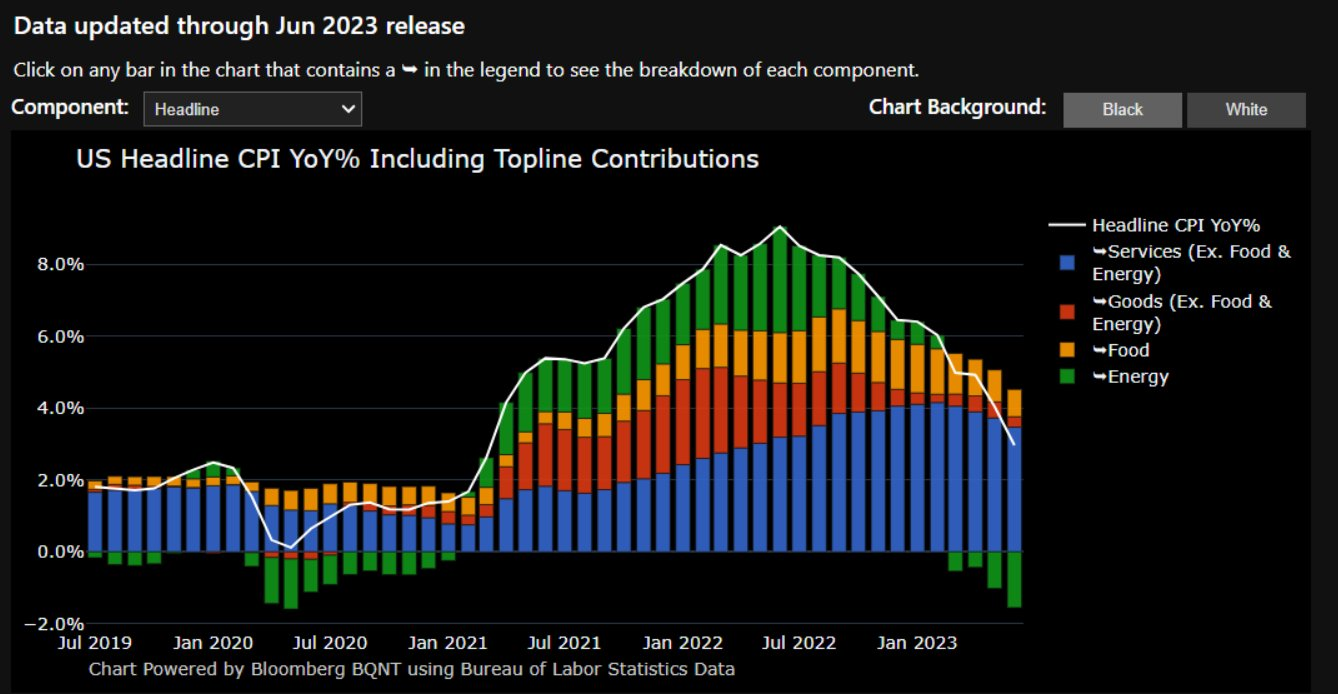
The most recent inflation print surprised to the downside but that is in the past. The key thing to note is services inflation is now clearly making consecutive prints to the downside.
People continue to mistake headline inflation coming down so fast as evidence that the FED has reached their inflation target. This is WRONG. The FED has clearly had a focus on core inflation and the labor market.
On top of this, core inflation is the primary variable moving rates. If headline was the "data point of truth" tell me why we are so elevated in rates still?
Headline inflation and rates:
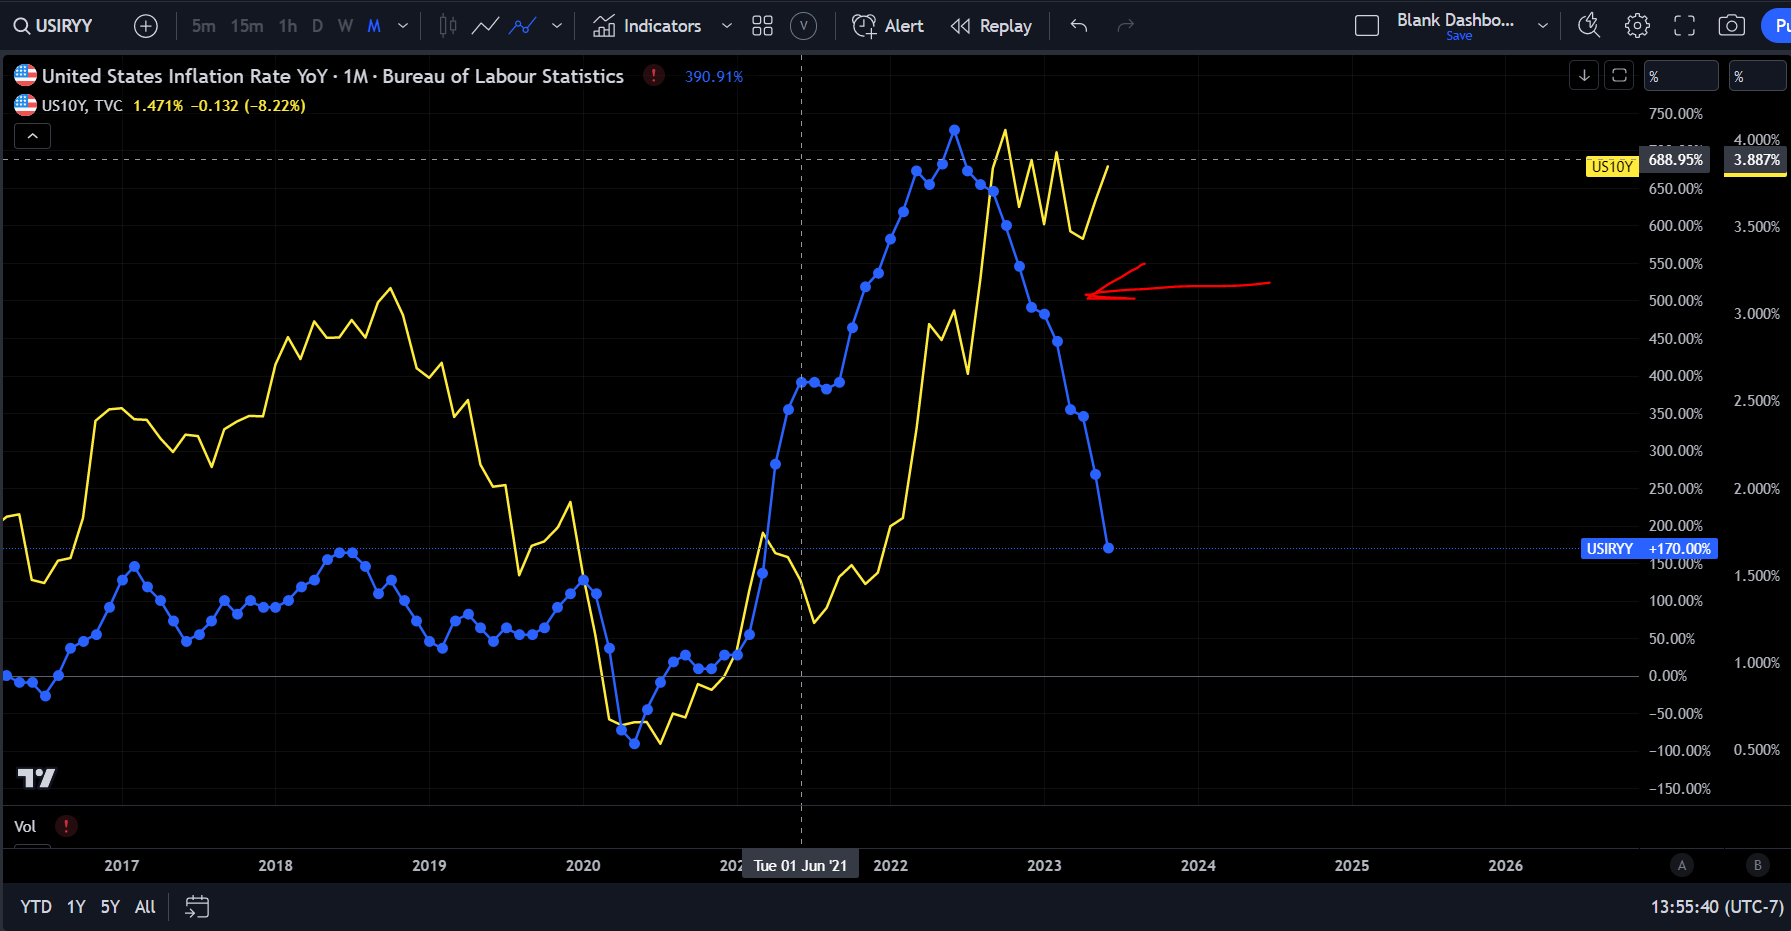
The one caveat to inflation being skewed to the downside is labor market deteriorating. If labor market data doesn't deteriorate considerably, this could create the preconditions for another acceleration in inflation.
This is what brings me to my second point on the FED. The FED has a little less pressure on them now that FED funds is above Core CPI. However, labor market recently surprised to the upside.
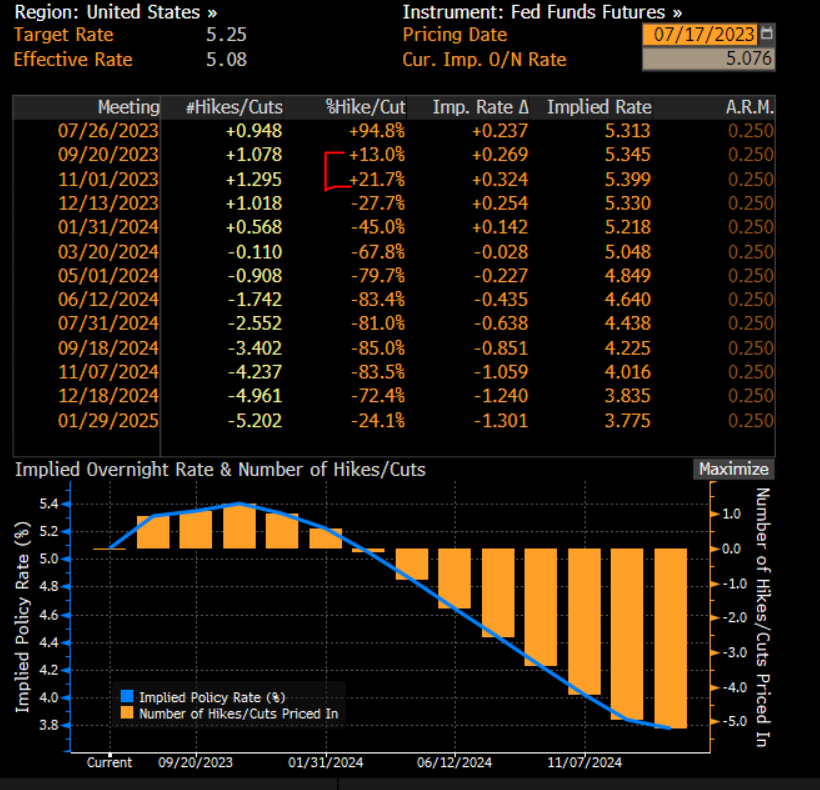
This creates a short term tail in my opinion The july rate hike is priced in and a "done deal." However, a final rate hike in either September or November isnt priced in yet.
If Powell draws a lot of attention to the labor market data in spite of inflation surprising to the downside, this could cause these contracts to reprice. This could create a final mini sell in bonds before an "official pause."
On top of this entire dynamic we have the rest of the forward curve pricing cuts into 2024 which is yet to be seen since we havnt seen a credit risk constraint put pressure on the FED.
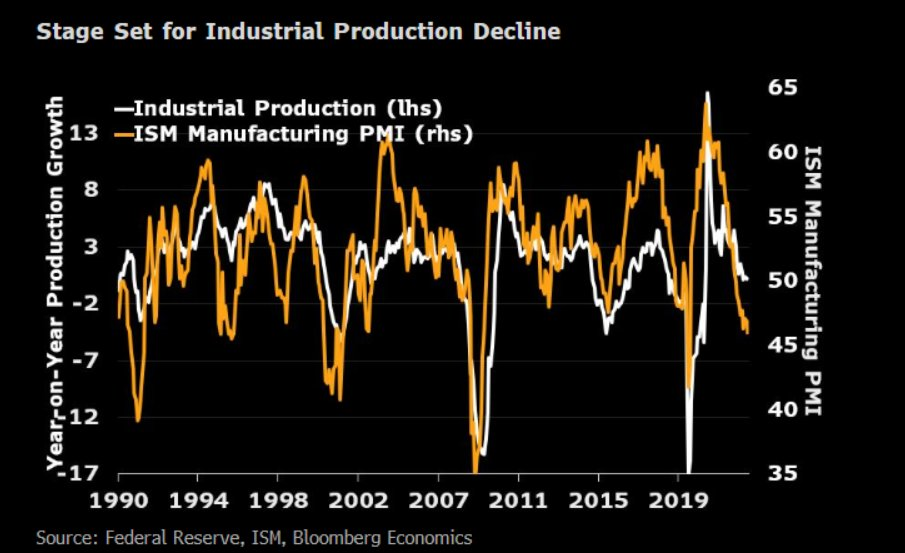
Retail sales and industrial production this week will be telling for this tension as it gets priced into bonds.
Several additional thoughts:
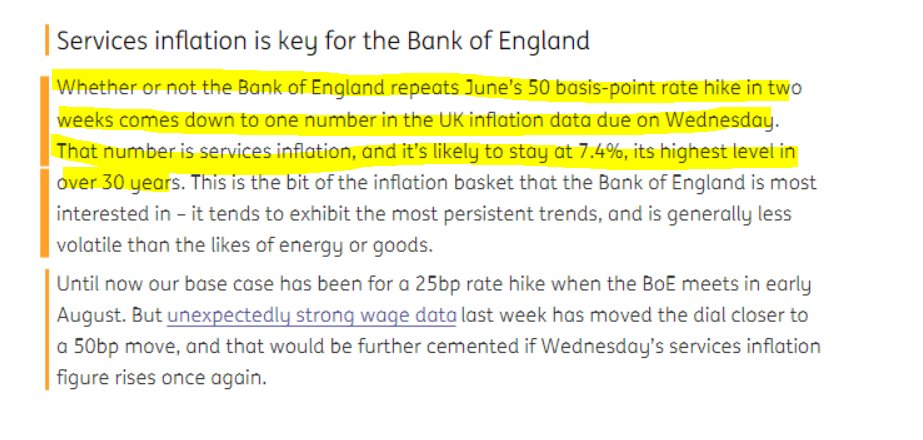
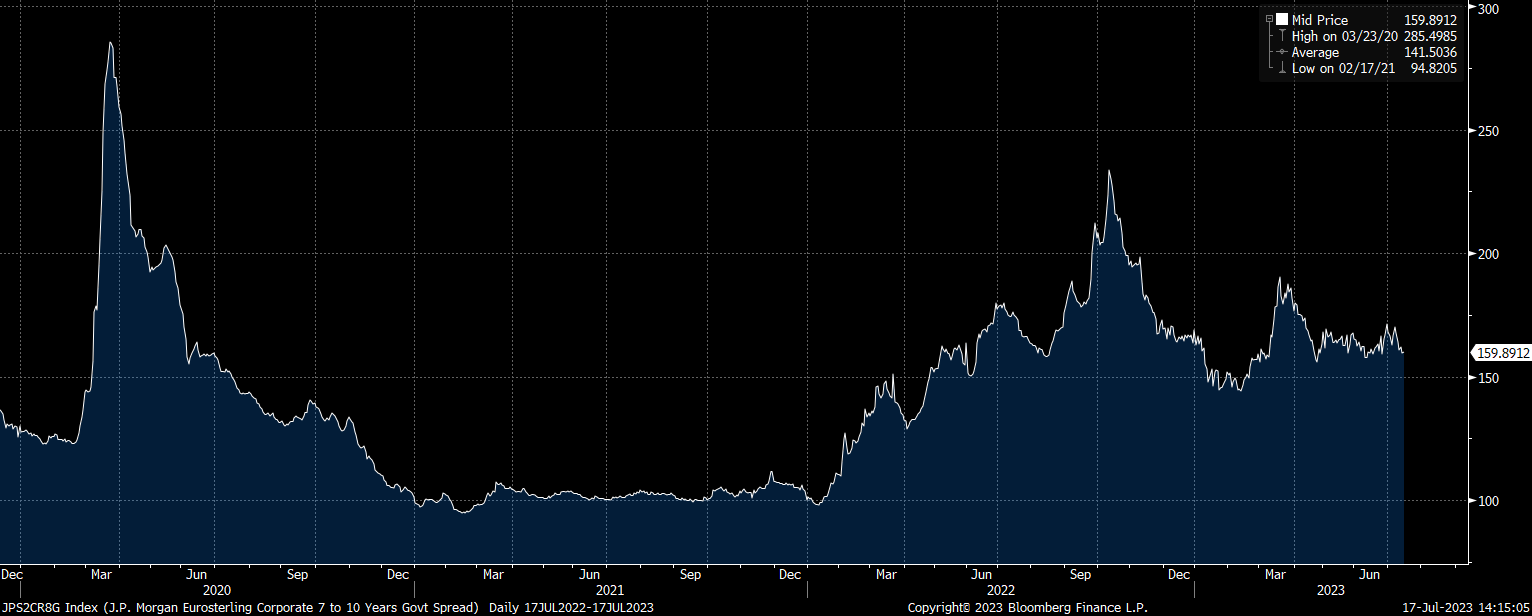
I have brought attention to the risks in the UK. I have taken some shorts on the FTSE but still remain defensive until credit risk begins to really spike.
I would definitely be watching this print in connection with US bonds.
UK:
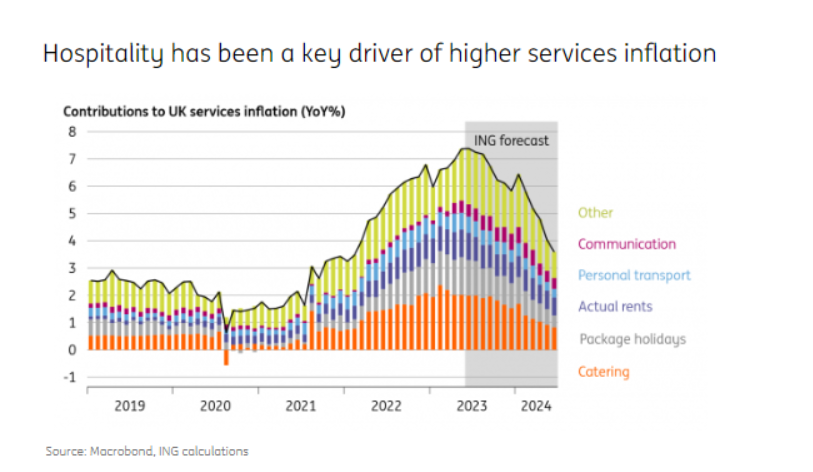
Market is pricing 50bps:
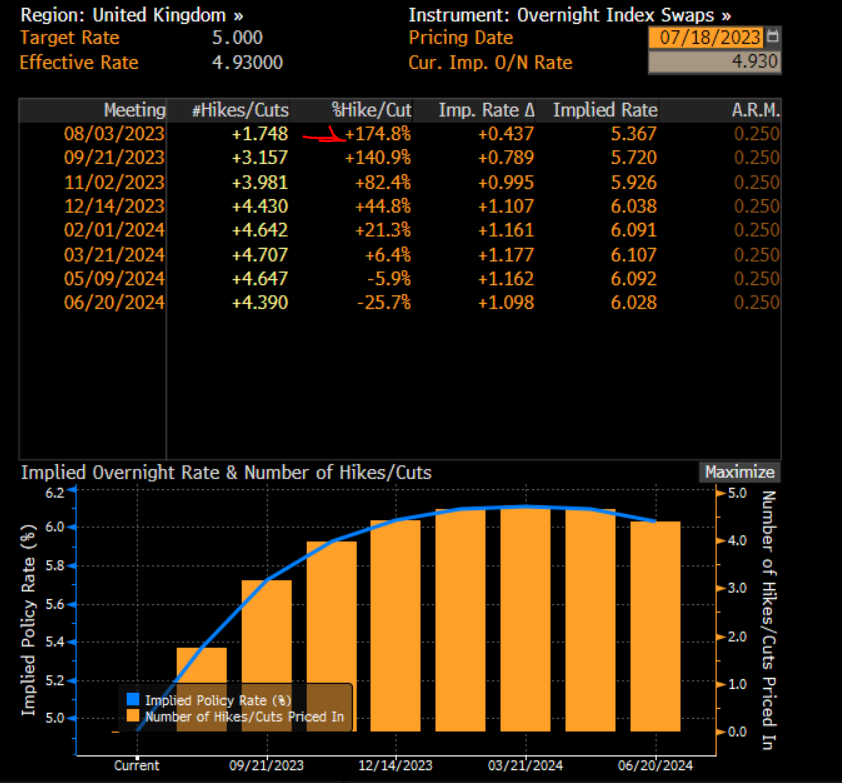
Once credit risk in the UK begins to spike again and the BoE is constrained to cut/pause, the Pound will have a massive reversal.
UK Credit risk:
How John Paulson made $15B betting
There are many contenders, but shorting this bubble may count as the greatest trade of all time 🫧
How John Paulson made $15B betting on the collapse of the US mortgage market during the greatest economic downturn since the great depression
You may have seen the movie ‘The Big Short’ and be familiar with Michael Burry, who made $700m for investors during the housing crash
But Burry’s trade pales in comparison to Paulson’s
Paulson ran his own hedge fund – Paulson & Co – which at the time was relatively unknown on Wall Street
The idea for his trade came from an Italian analyst at his firm, Paolo Pellegrini
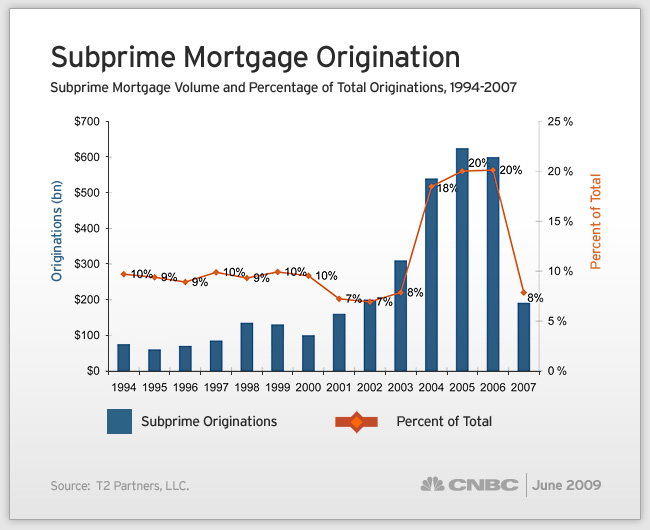
In 2005, he first noticed reckless lending practices in the subprime sector
A subprime mortgage is issued to borrowers with low credit ratings, typically <620 in the US, allowing lenders to charge a much higher interest rate
In 2006, 1 year before the crisis, institutions issued >$600B in subprime mortgages, more than 20% of all mortgage originations
Paulson began by researching how to buy puts on the S&P500
But these options were too expensive – parts of the market had begun “calling” a bubble – and Paulson wanted to focus specifically on the housing market
The magic of Paulson’s trade was in the structuring.
He approached Goldman Sachs, which created a synthetic Collateralized Debt Obligation (CDO) known as Abacus, and selected Mortgage-backed Securities (MBS) to make up the CDO
They wanted the riskiest sub-prime mortgages!
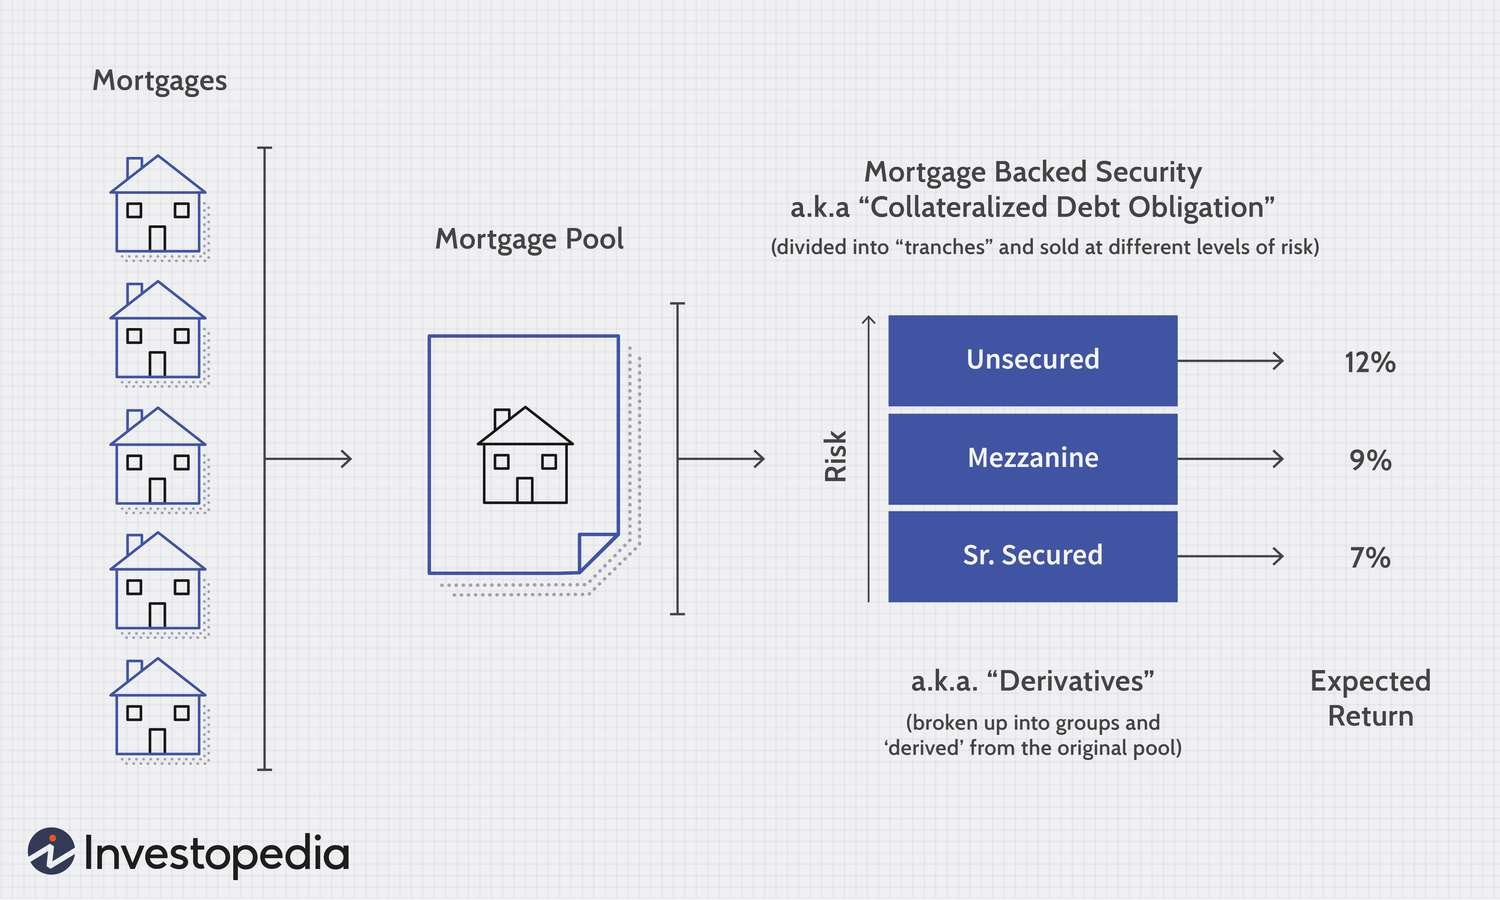
Before we move on, a quick primer on definitions:
CDO – structured financial product backed by a pool of loans and sold to investors, who receive the principal + interest payments from these loans.
MBS – similar to a CDO but focused solely on real estate loans i.e mortgages.
Returning to Paulson, Goldman selected the riskiest sub-prime MBS and packaged them together to create “Abacus”
Paulson then bought credit default swaps (CDS) against Abacus: effectively insurance against loan default
By 2007, the housing bubble had begun to burst and defaults on subprime mortgages were skyrocketing
As a result, the CDS that Paulson & Co. held were triggered.
The institutions that had sold these CDS, including major banks like Goldman Sachs, now had to pay Paulson & Co.
The Global Financial Crisis (GFC) ensued:
- Unemployment spiked to 10% by Oct 2009
- 8M foreclosures
- Home price declines of 40% on avg—steeper in some cities
- S&P 500 -38.5% in 2008
- Delinquency rates for Adjustable-Rate Mortgages (ARMs) climbed to nearly 30% by 2010
While Paulson came out a winner, controversy followed
Goldman was fined $550m & charged with allegedly misleading ABACUS investors by not disclosing Paulson’s role in selecting the underlying MBS or his intention to short them
Analysis Articles


글 잘 봤습니다, 감사합니다.