Market Depth
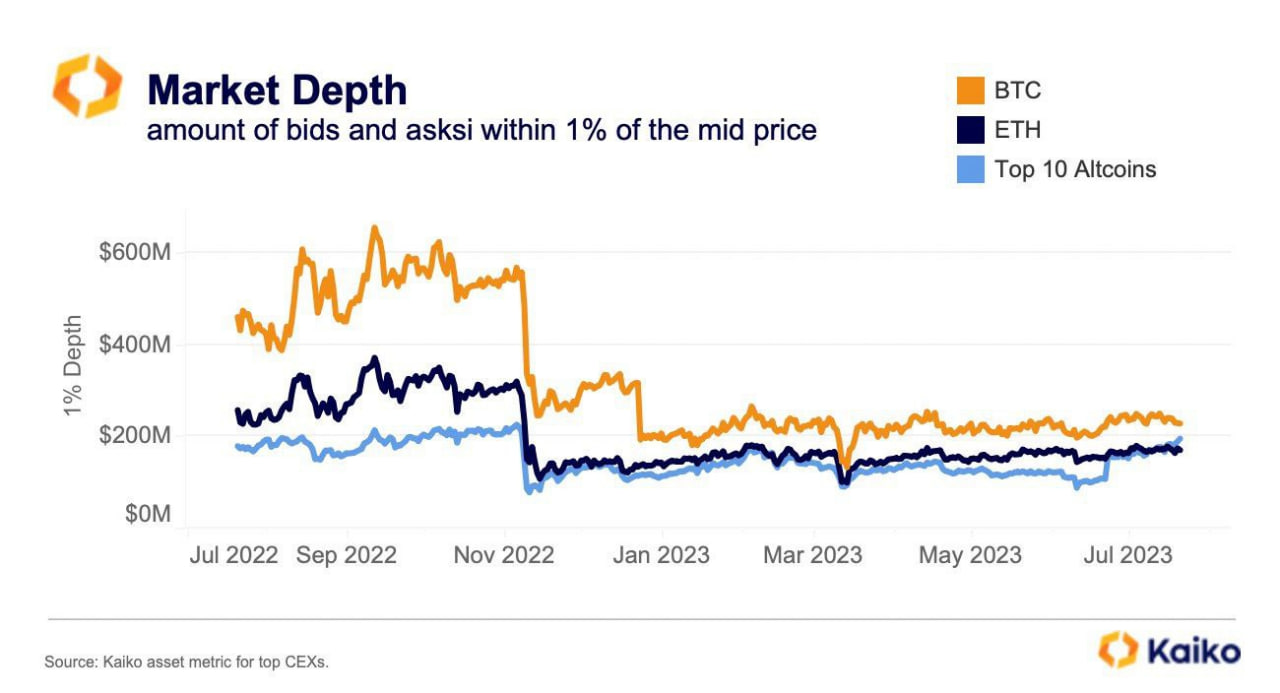
Despite market depth being only half of last year's level, the liquidity of the top 10 altcoins in USD has surpassed ETH's for the very first time
BTC Correlation
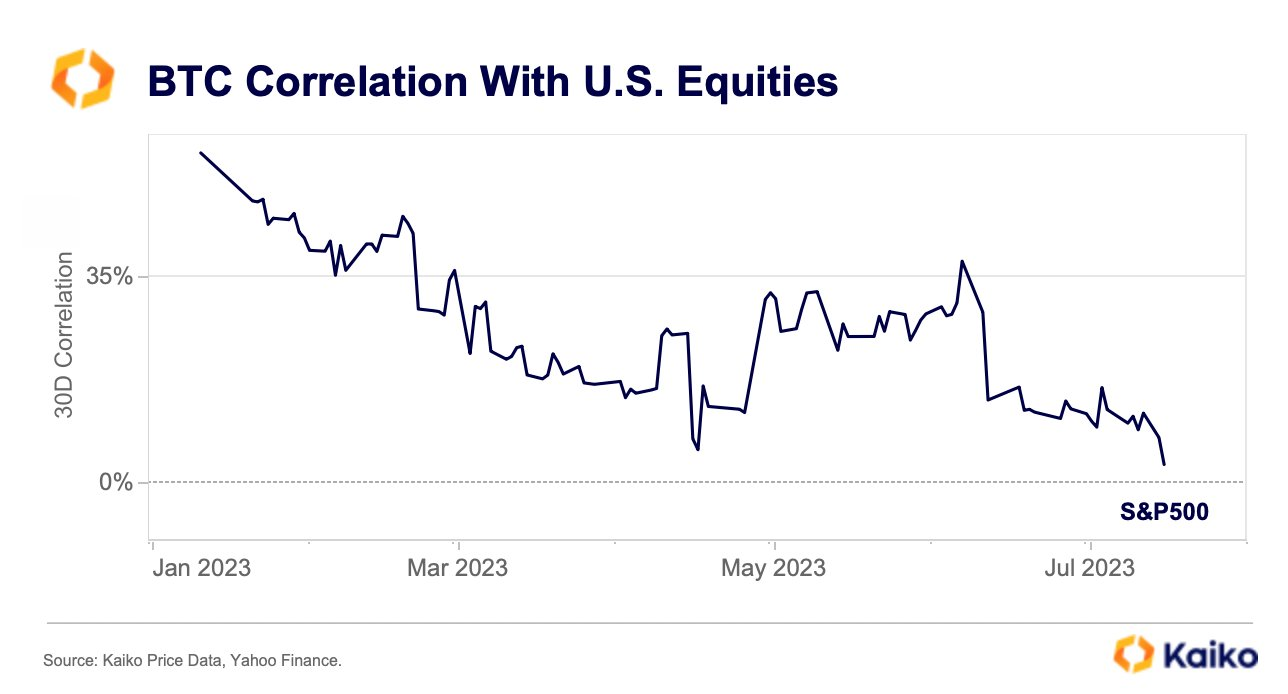
#Bitcoin 's correlation with the S&P 500 continued declining in July, hitting just 3% .
👉The last time it was this low was back in Aug 2021.
BTC Spot Volume
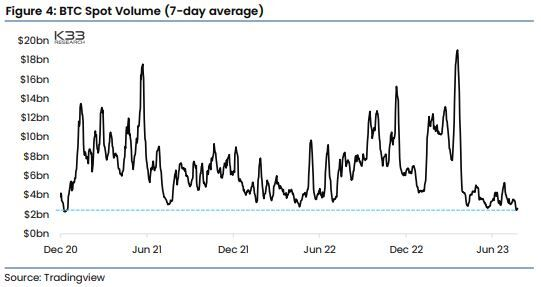
$BTC spot volume has fallen to 30-month lows
BTC Onchain Insight
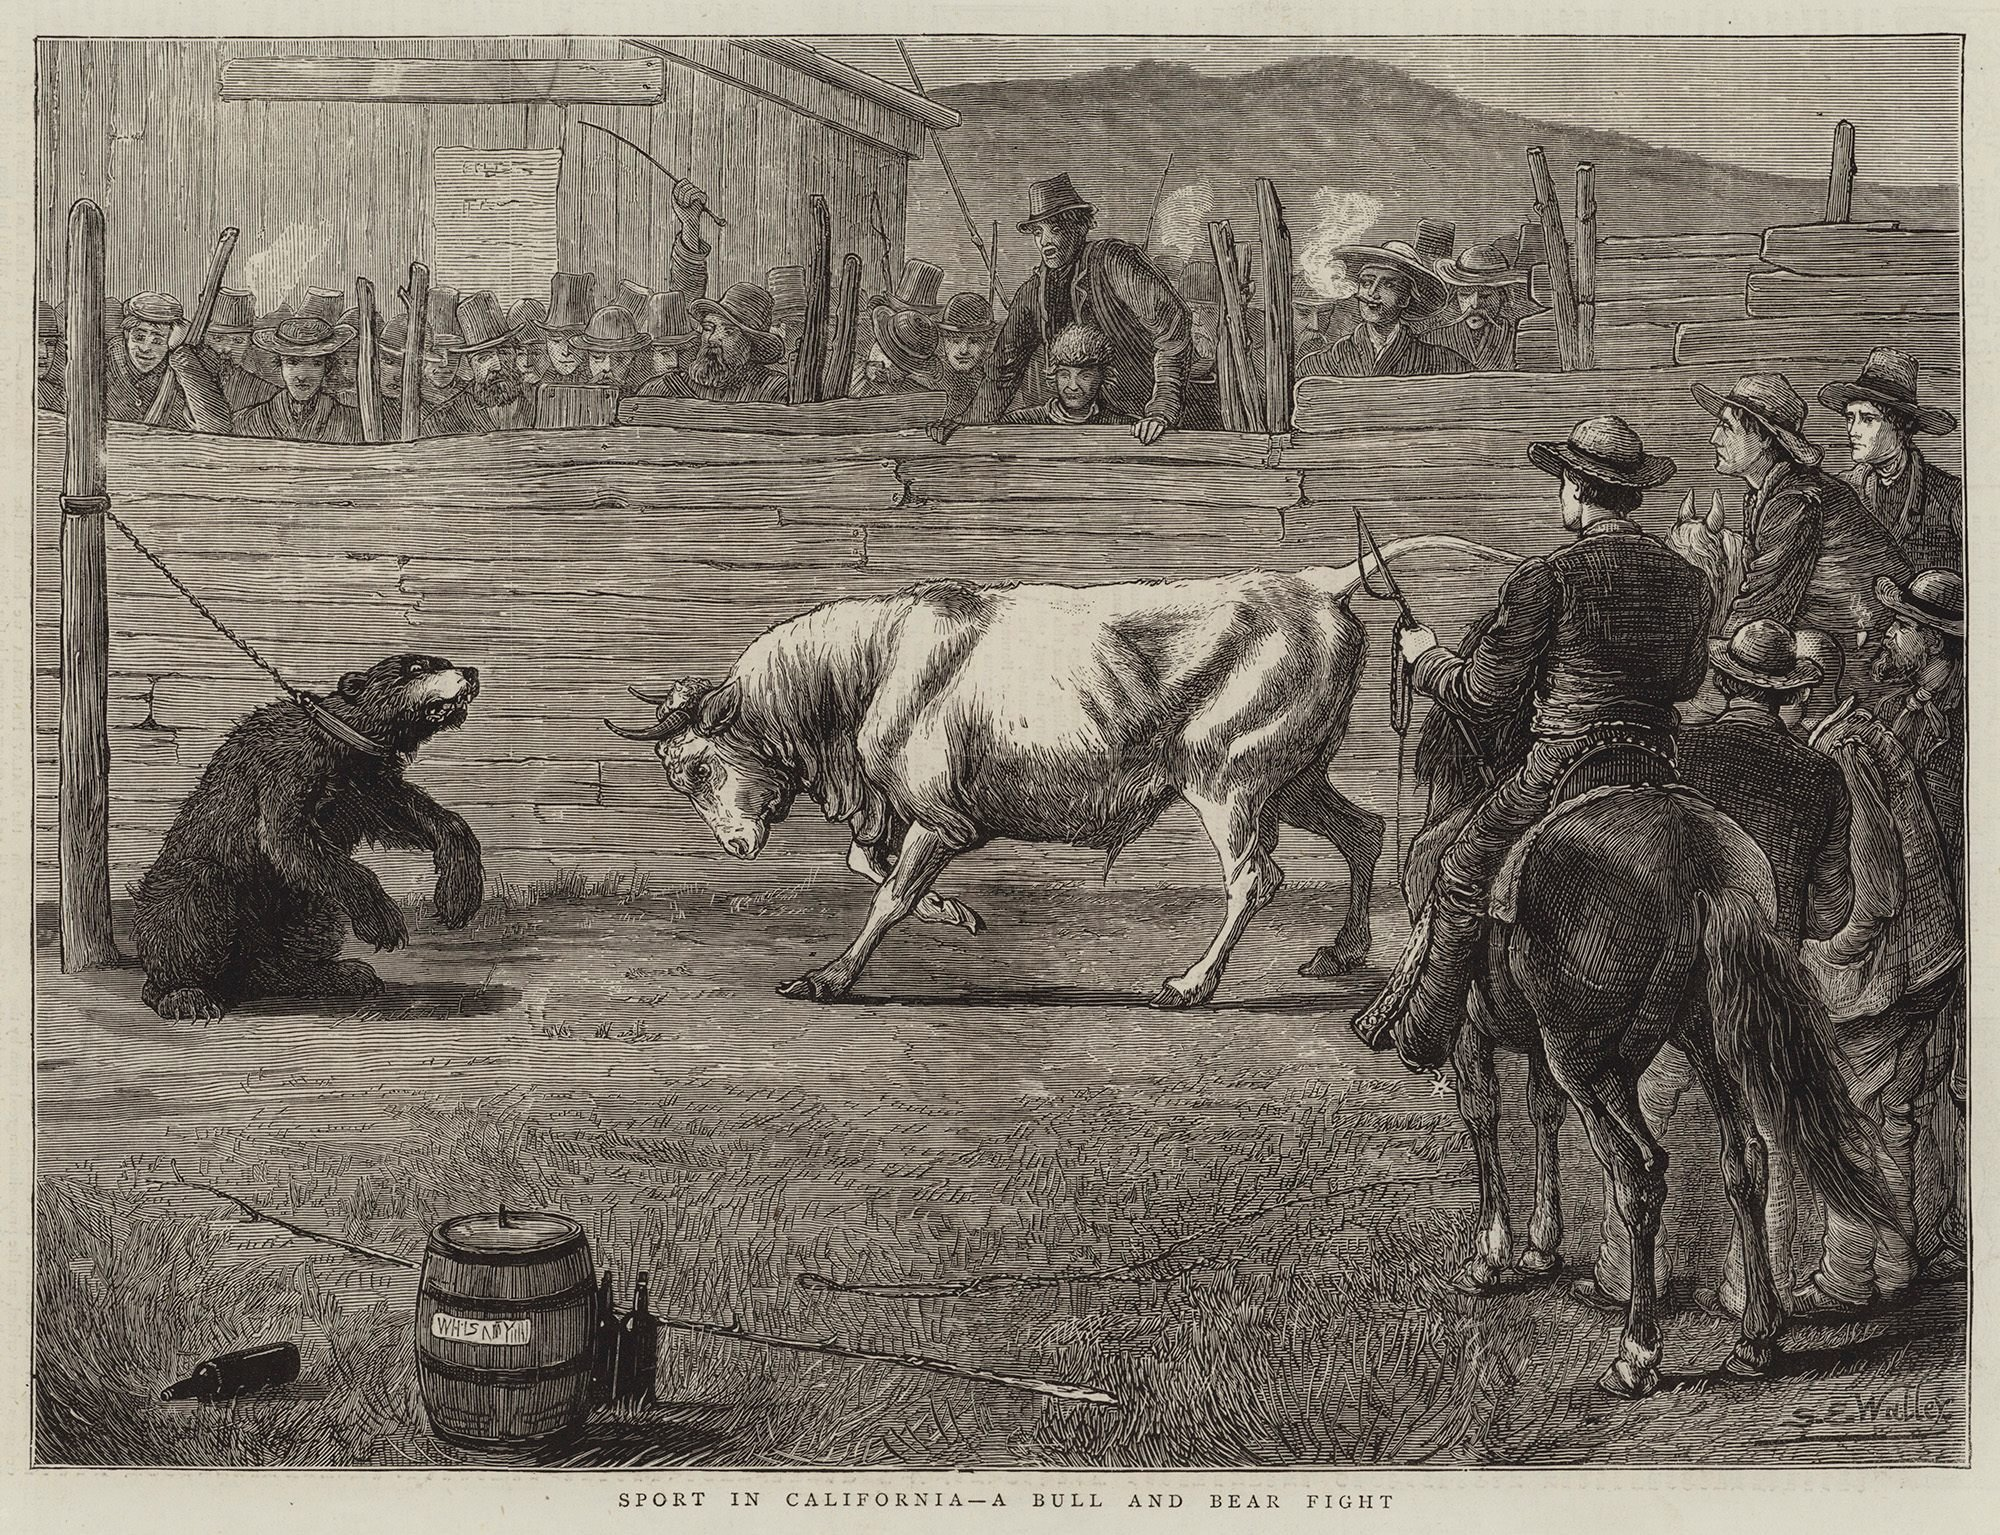
BULLS OR BEARS, WHO IS IN CHARGE?
This thread will give you an edge in tracing market sentiment from the perspective of new investors (demand). Simply put, it aims to answer the question: "Are the bulls gone, or is it just a correction?"
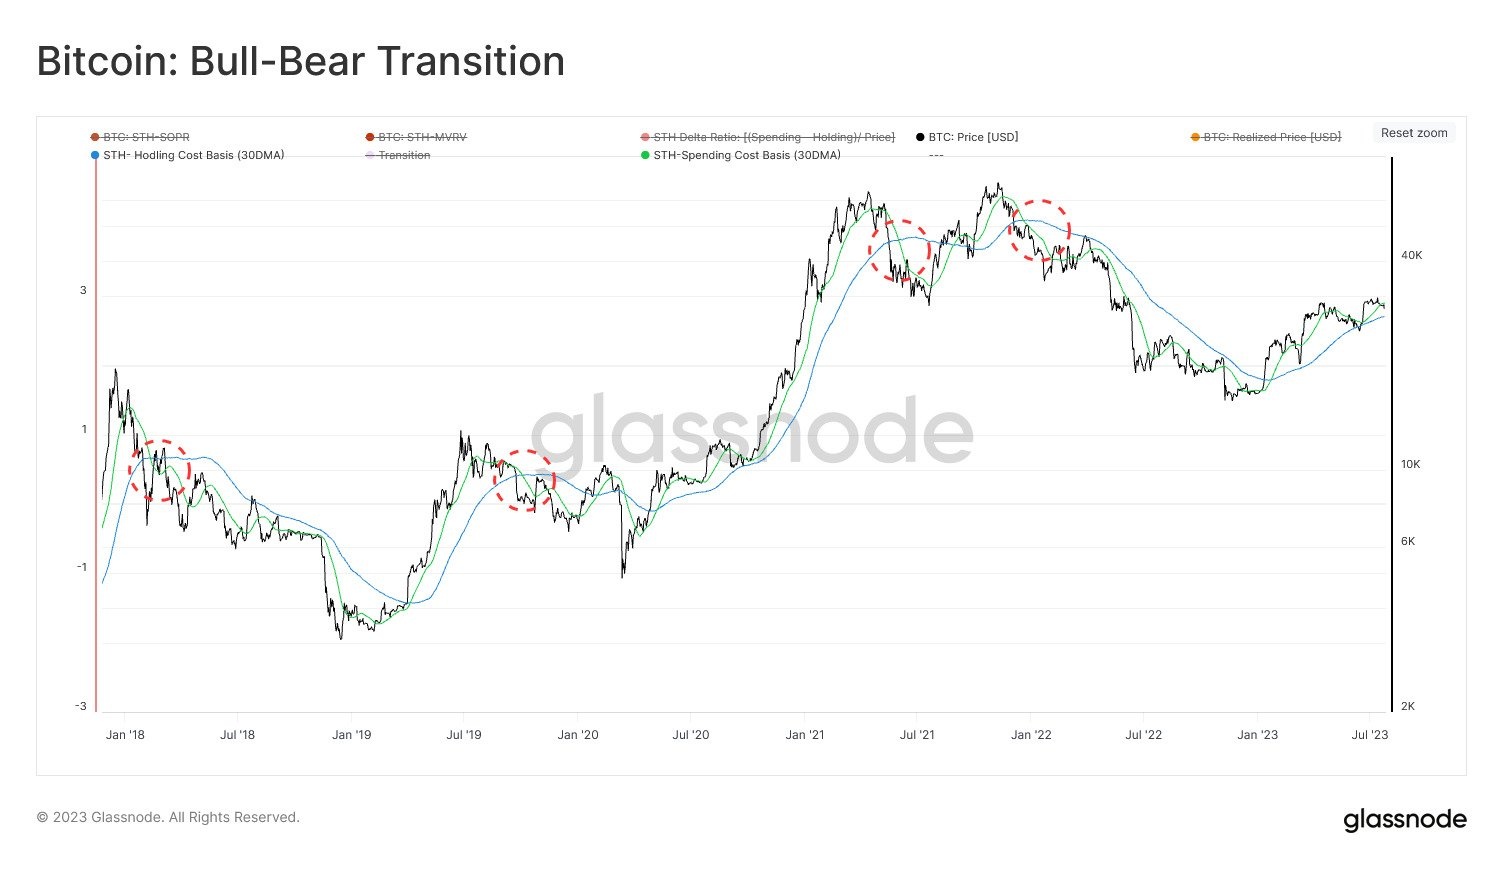
During a bull market, short-term corrections are common and expected. However, if a correction coincides with a significant decline in demand (buying pressure), it may be a sign of a mid to long-term bear market.
Let's look for these signals using the on-chain spell book!
To build this tool, we need to define two price lines:
New Holders’ Cost-basis 🔵: the acquisition price for recent investors.
Young Sellers’ Buy-Price 🟢: the purchase price for new investors who are selling today.
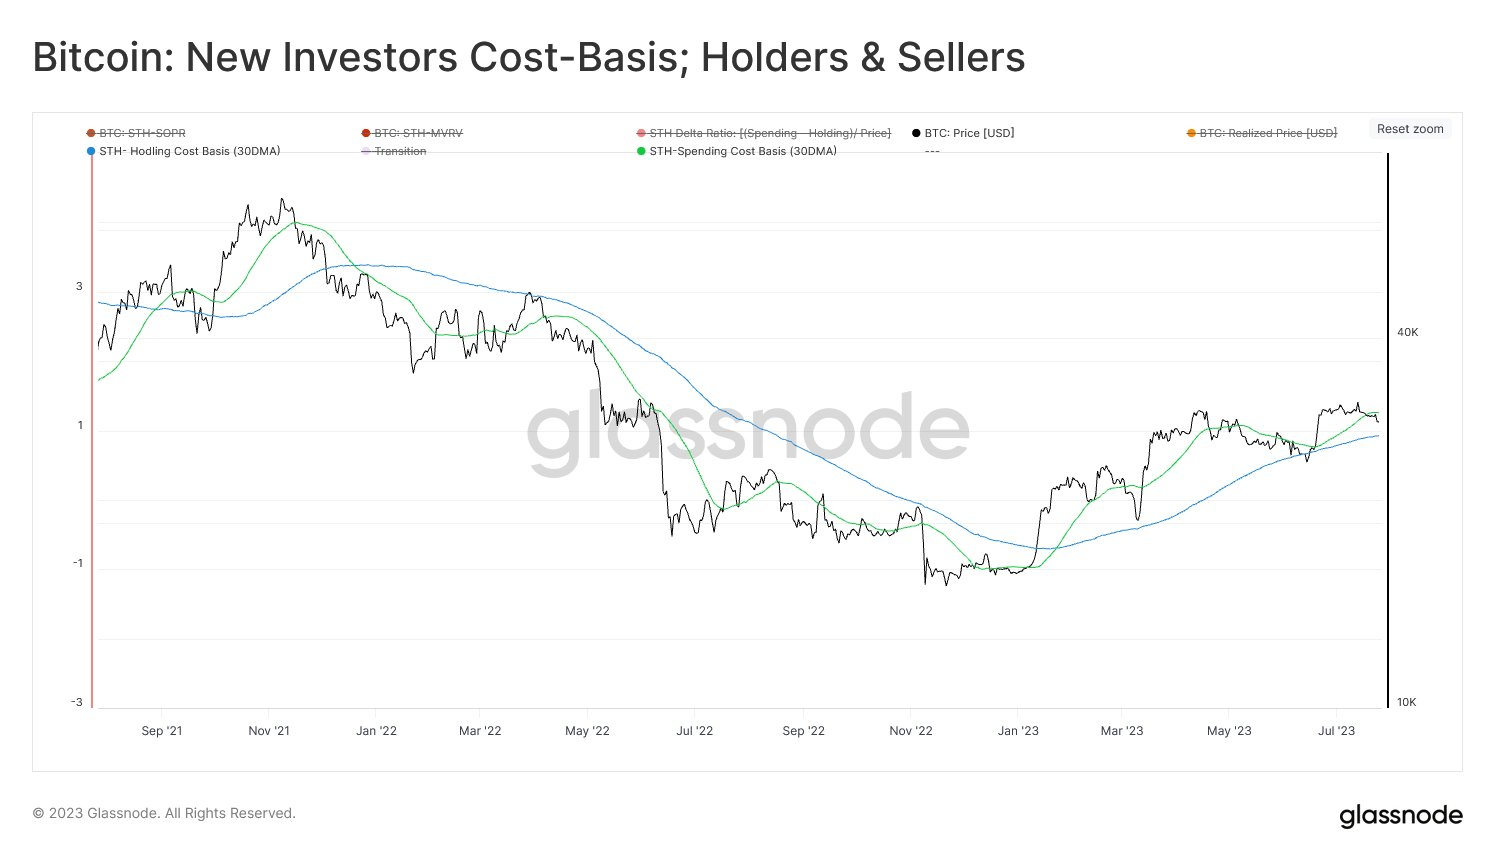
Now we can define our signal:
This indicator detects moments when the buy-price of new investors🟢 falls below the cost-basis of new holders 🔵.
Essentially, it identifies when new investors are losing "Confidence" in the bull market and begin selling aggressively.
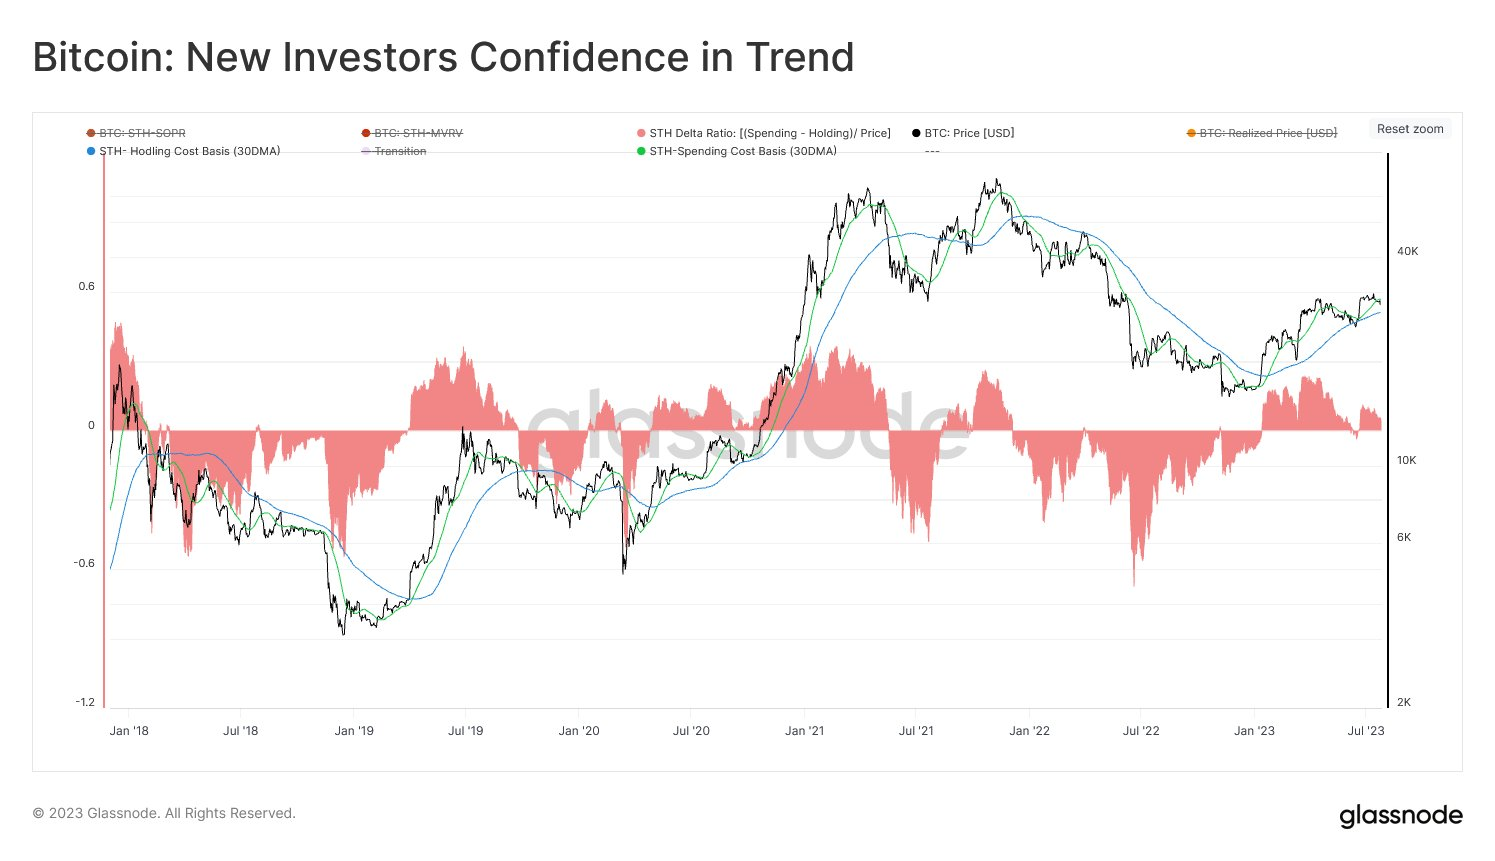
The appropriate name and purpose for this indicator is "New Investors' Confidence in Trend." Using the defined cost basis and buy price, we can formulate this indicator in the market as follows:
Confidence in Trend 🟥= ( Young Sellers' Buy Price🟢 - New Holders Cost Basis🔵) / Market Price ⚫️

Using Confidence in Trend (12 HR-MA)🟥:
-
When the value is below <-0.03, the market has always entered a mid to long-term bear market
-
When the value is above >+0.03, the market has shown the potential of a mid to long-term bull market
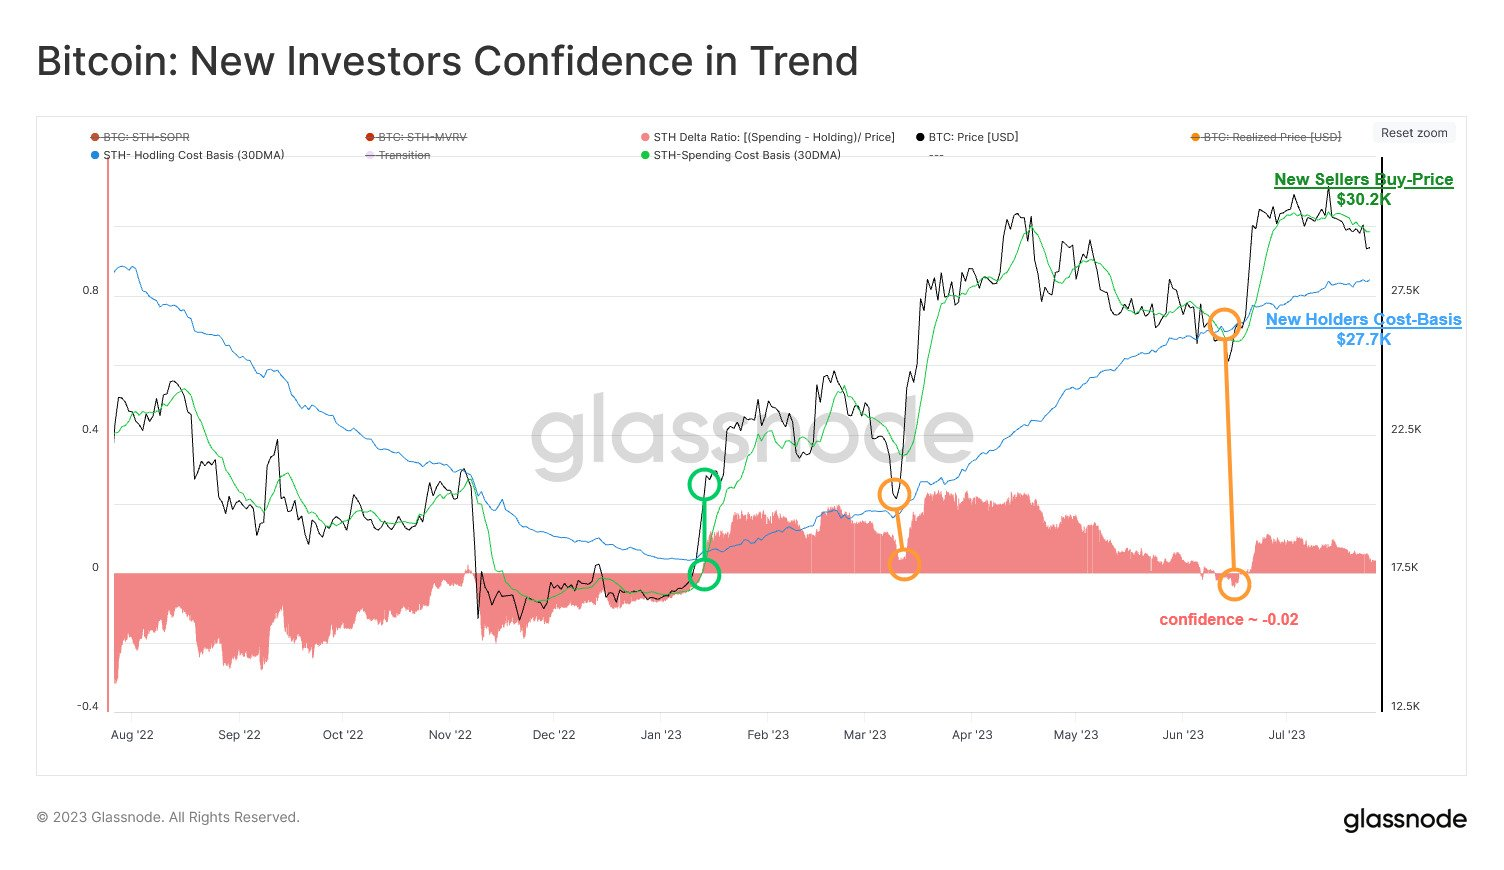
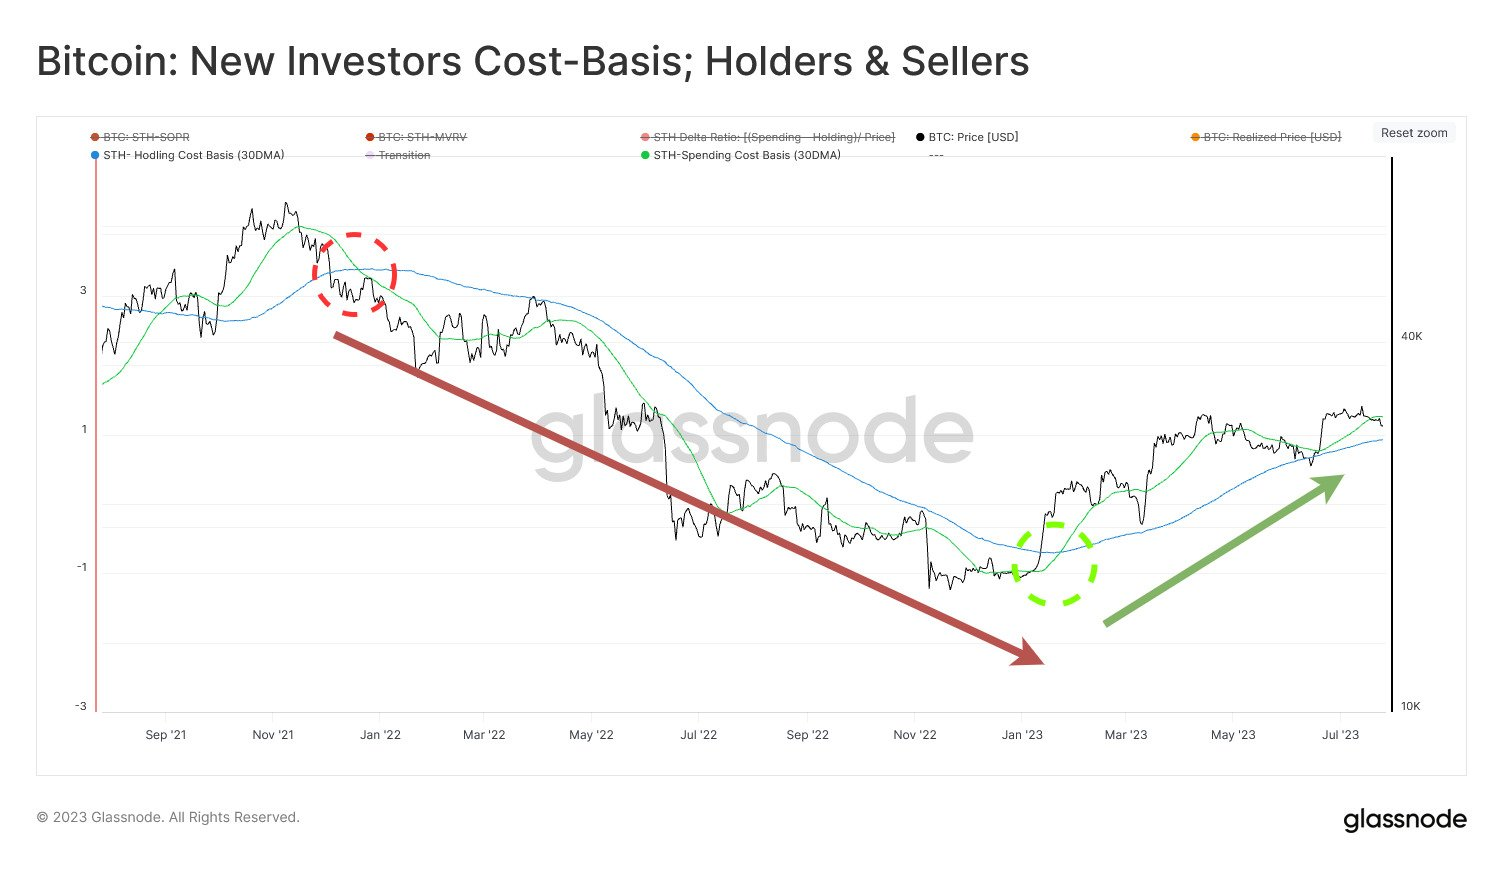
Currently,
New Holders’ Cost-basis🔵 $27.7k
Young Sellers’ Buy-Price 🟢 $30.2
Therefore, if the price drops below $27.7k for more than a week, indicating a significant decrease in new investors' confidence in the trend, it may signal a mid to long-term bear market.
On the other hand, if the price stays above $27.7k, the bulls still have a chance to get back on track with the uptrend.
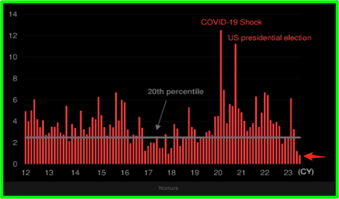
Realized Vol
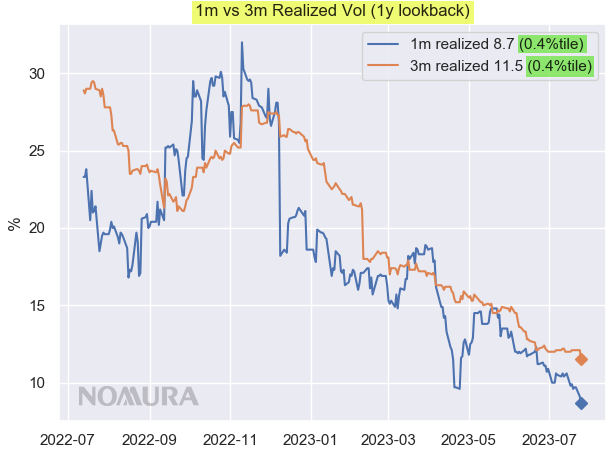
Realized volatility is about as low as it goes.
chart via Nomura's McElligott
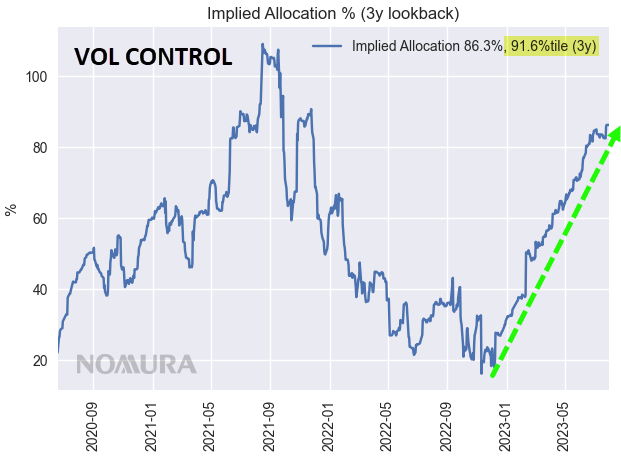
When vol inevitably returns, quants have plenty of stocks to dump...
Source Tweet - Eric Wallerstein
Various Measures of Skew
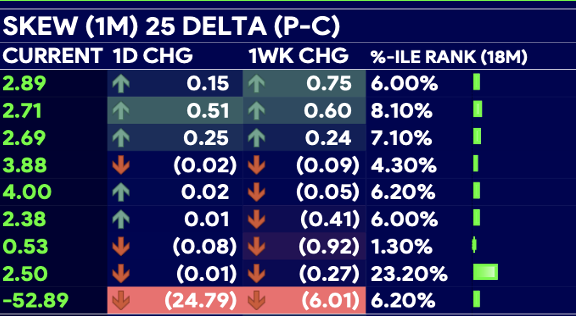
There are various measures of skew in the market...
Our benchmark that we use in our volatility dashboard is 1-month 25 delta skew. This measures the volatility difference between 25d PUTs and CALLs for a given asset. Right now for SPX, we see this in the 6th percentile.
But this is not the only measure of skew. A recent chart put out by Nomura, shows that 1-week skew going into FOMC is about as cheap as we've seen it in over a decade.
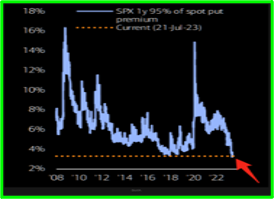
Even longer-dated skew as measured by the premium of 95% 1-year SPX puts is screening as cheap as it's been since 2008. This is partly due to the higher forwards that come from higher interest rates, but still worth noting.
So why so little skew?
To us, this is a clear sign that investors are still underweight as they have been caught wrong footed by how resilient the economy has been. Largely due to the fact that companies locked in such cheap borrowing in 2020/21 which immunised profits.
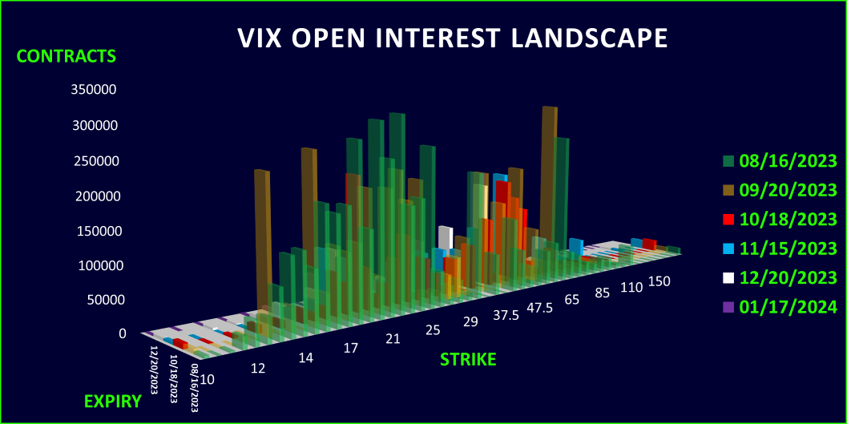
Lastly, some systematic hedging is still being done, but it's moving to the VIX complex which can be seen by huge call options volumes that keep getting rolled every month and keep VVIX elevated way above VIX. VIX hedges can act like re-striking puts as SPX rallies.
July FOMC Summary
Overall very vanilla event (the press conference is still going, but you can probably switch it off right now, I'll save you the stress with notes below)
-
Fed hike FFR by 25bps to 5.50%, the highest since Feb '21
-
Achieving 2% inflation still has a long way to go.
-
FOMC will take a data dependent approach on future hikes
-
The full effect of tightening is yet to be felt.
-
Getting back to the inflation target may require below trend growth and labor market softening
-
QT remains unchanged
-
Possible that they raise again in September, data dependency.
Overall very vanilla event (the press conference is still going, but you can probably switch it off right now)
EU M2
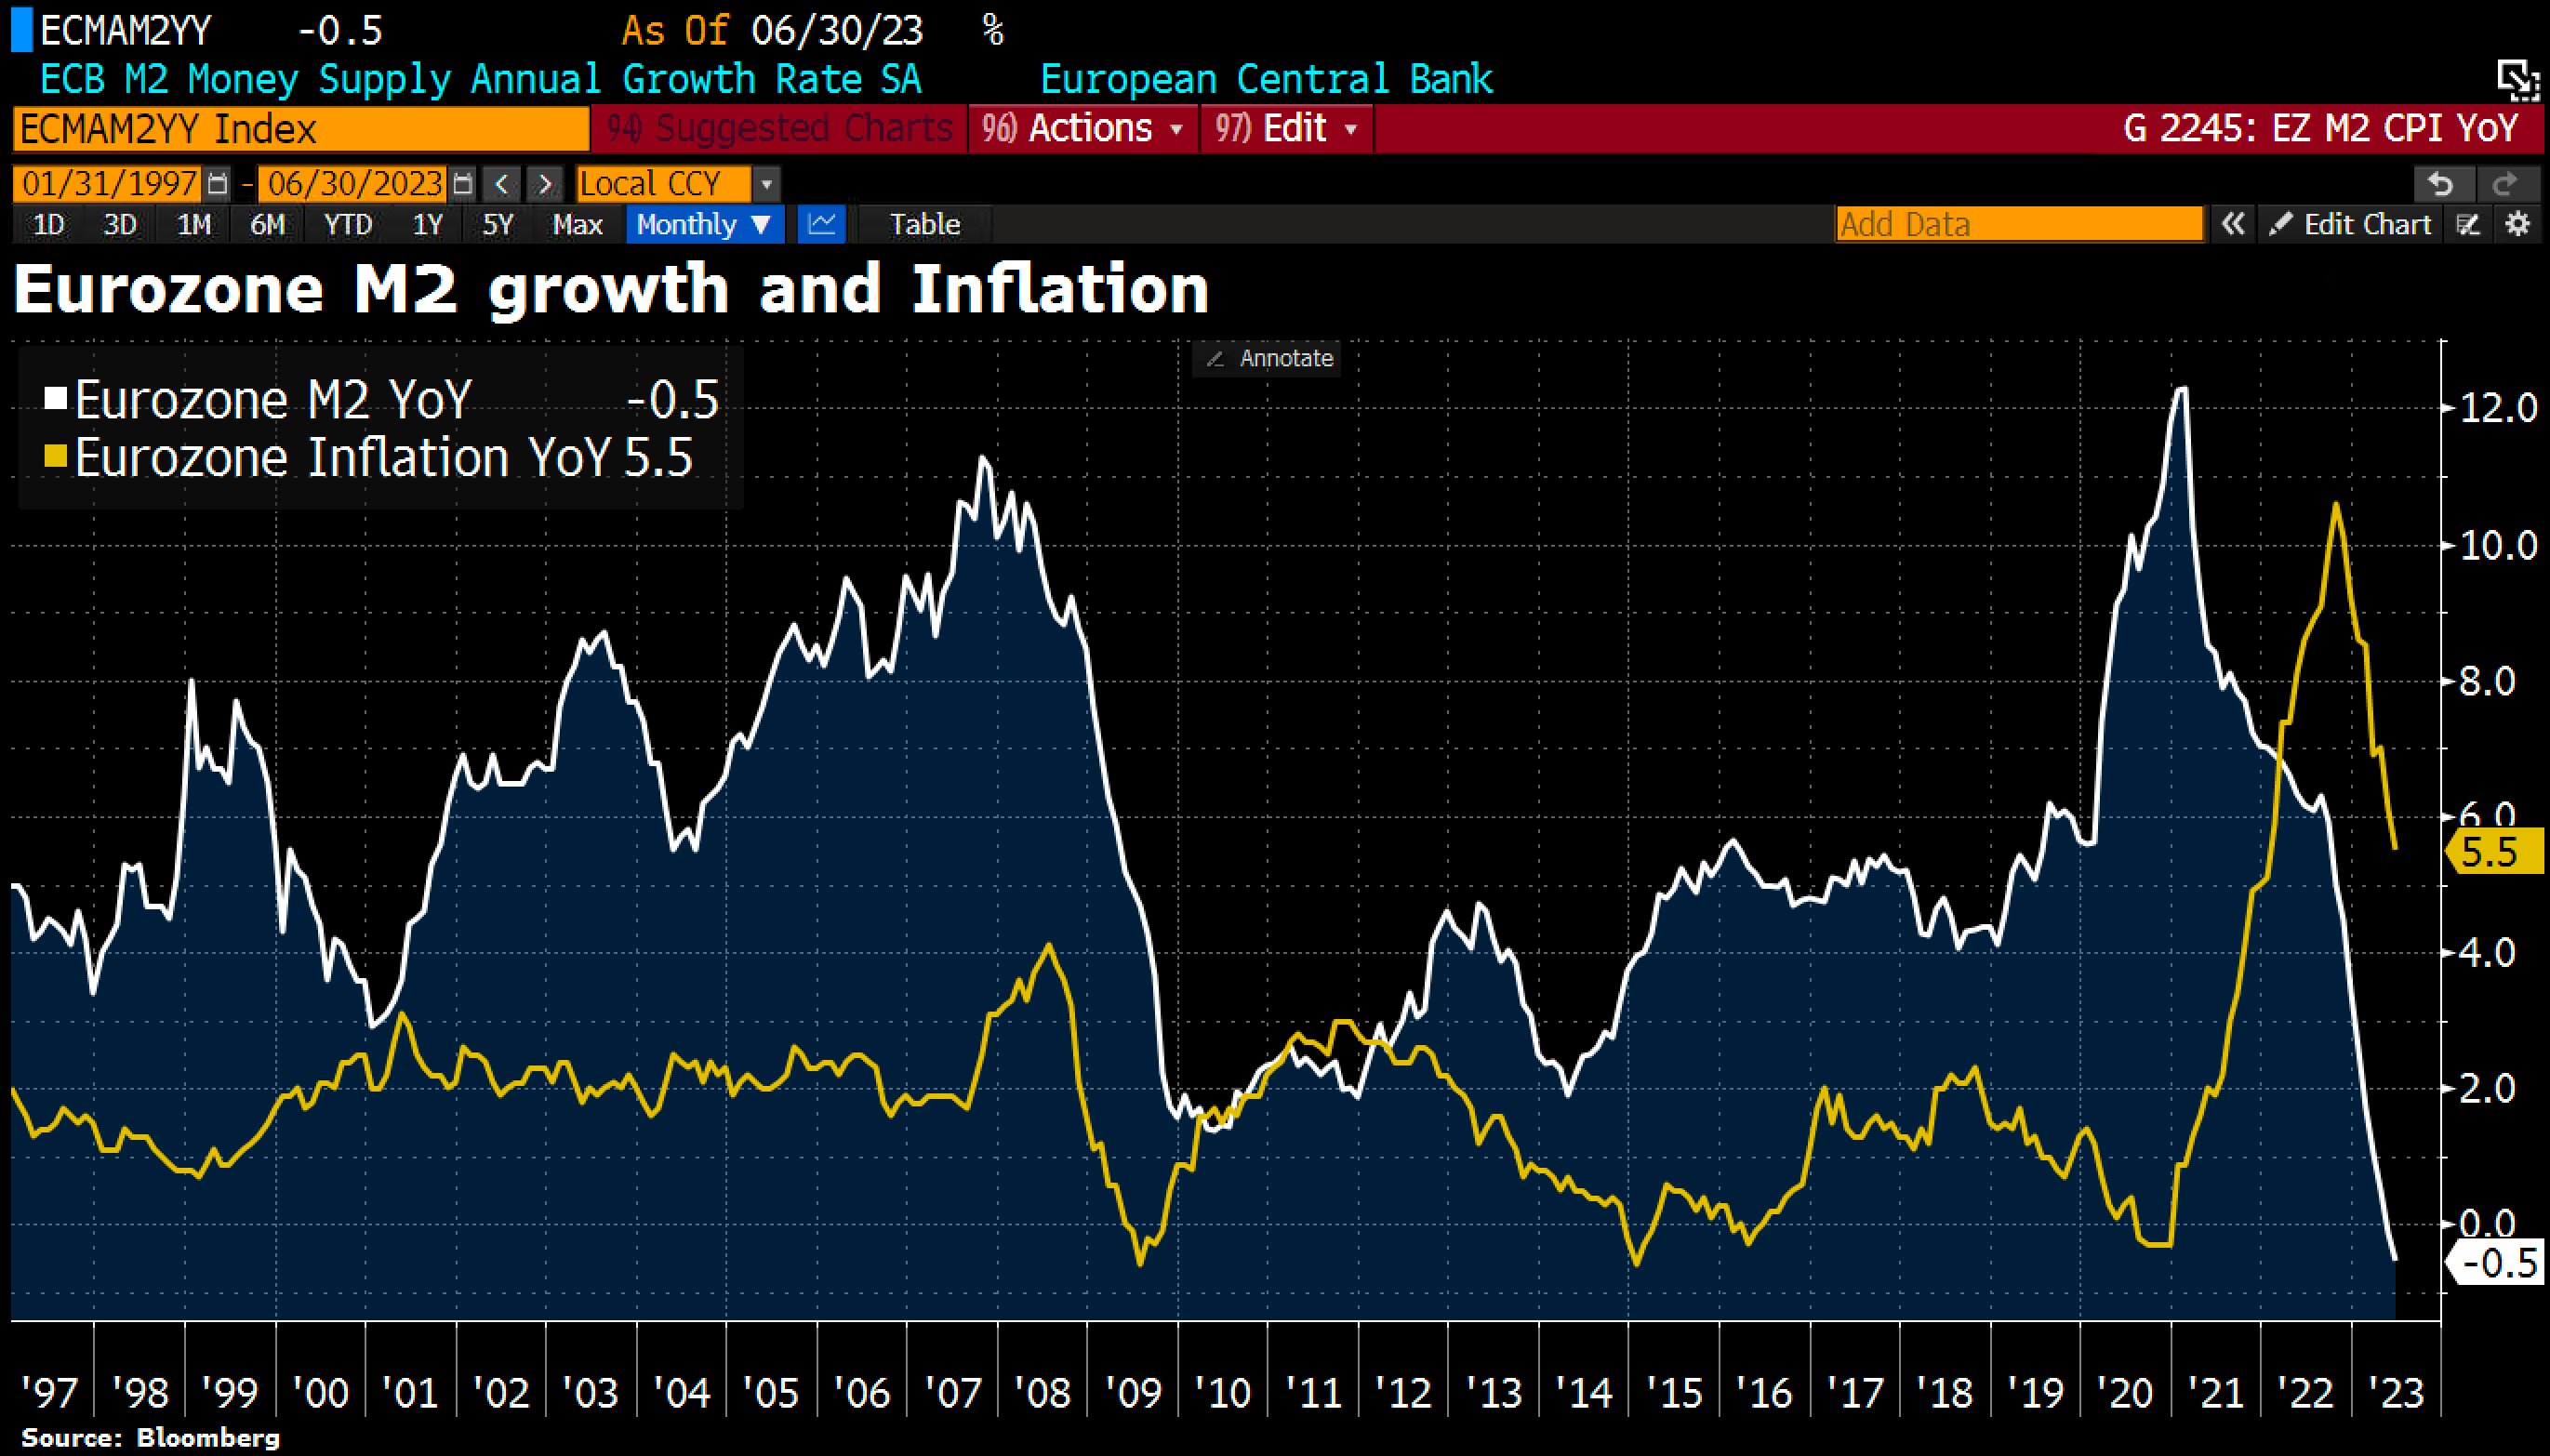
OOPS! #Eurozone M2 money growth turned NEGATIVE for the first time in Eurozone history, in a promising sign for #inflation. M2 growth revised to -0.1% in May from initially +0.3%, and falls deeper into negative territory in June to -0.5%.
Source Tweet - Holger Zschaepitz
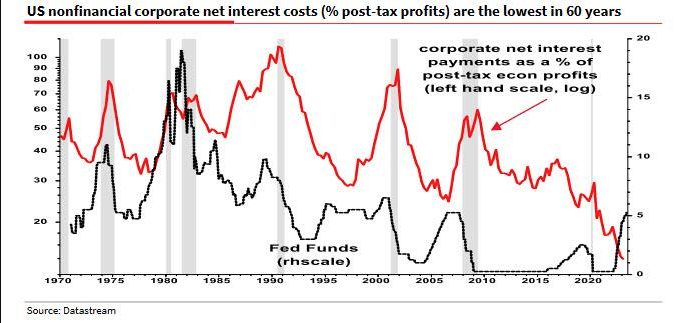
Interest Payments
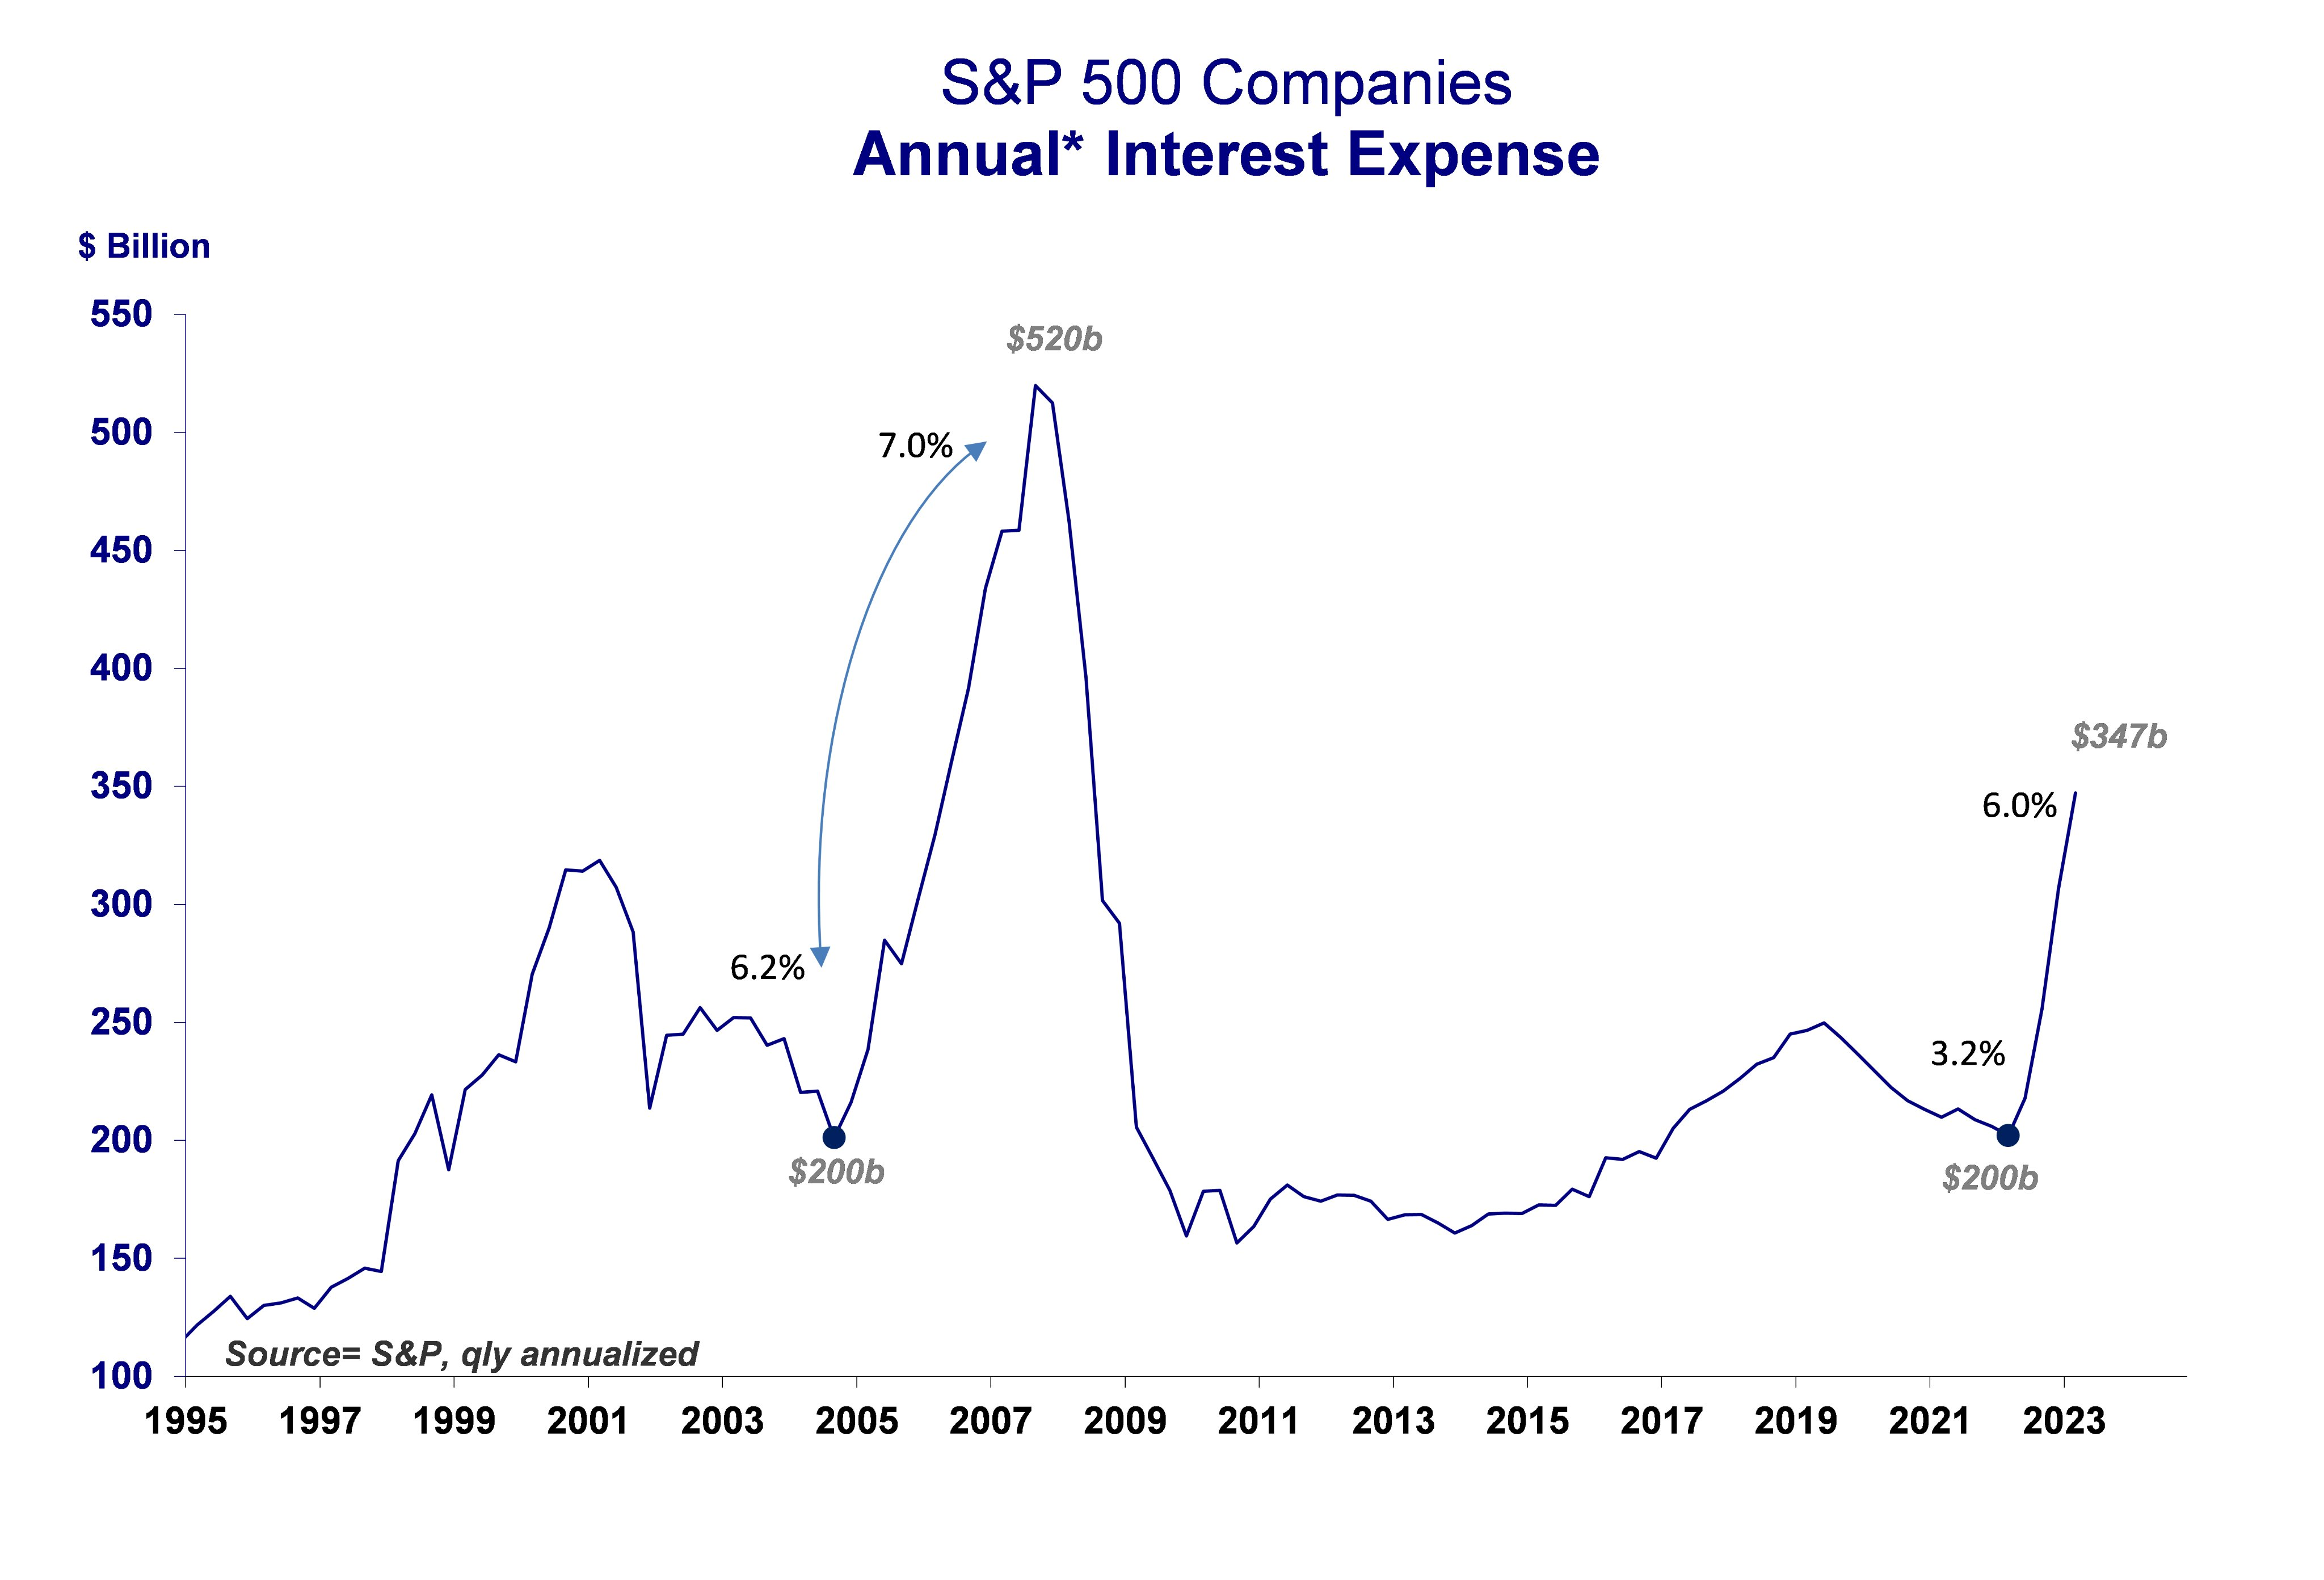
The chart showing Corp net interest payments declining is burning up the financial blogosphere. That data come from the BEA's NIPA accounts. Here is 1q data from S&P. The difference is every company that's too small to make it into the top 500. Those companies are filing for bankruptcy at the fastest pace since 2009. The collapse in Int Payments is no mystery. And it's emphatically NOT a good sign.
US Gasoline Price
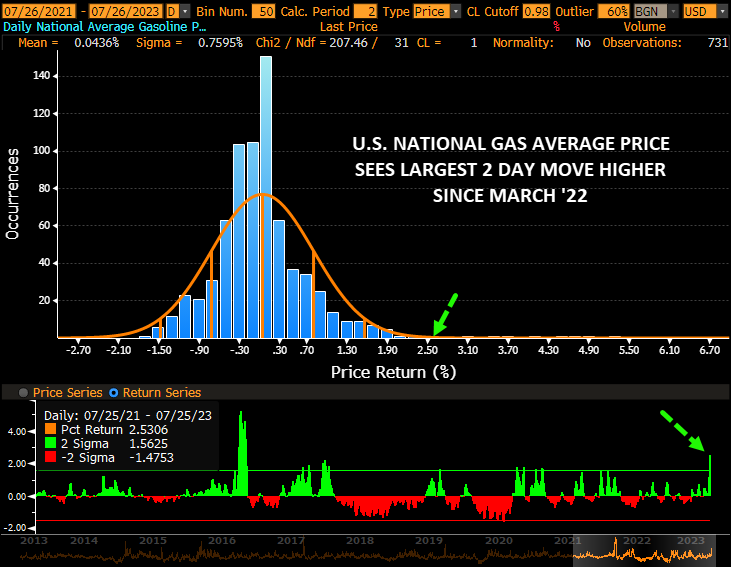
Largest 2-day jump in the national average US gasoline price since March 2022
Implied Policy Rate
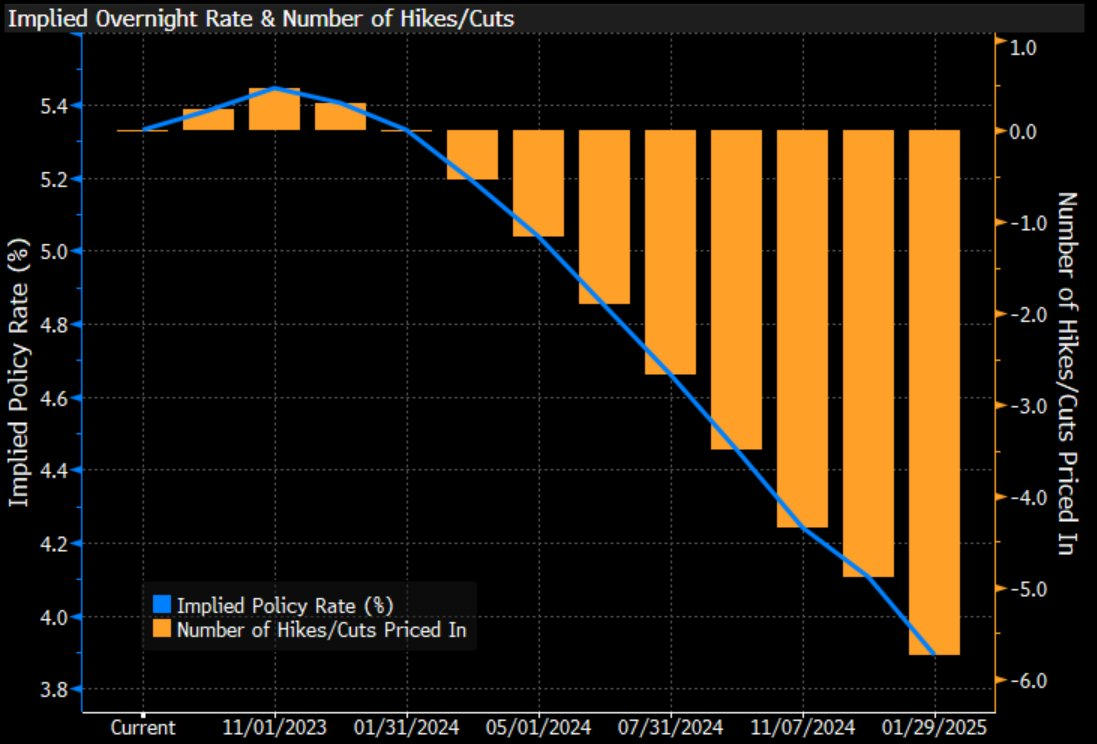
The market believes that the Fed delivered the cycle's last rate hike today, and that it will start cutting rates in May 2024.
Powell says future rate decisions will be strictly data-dependent, exposing front-term USTs to higher volatility.
Source Tweet - Althea Spinozzi
Gold
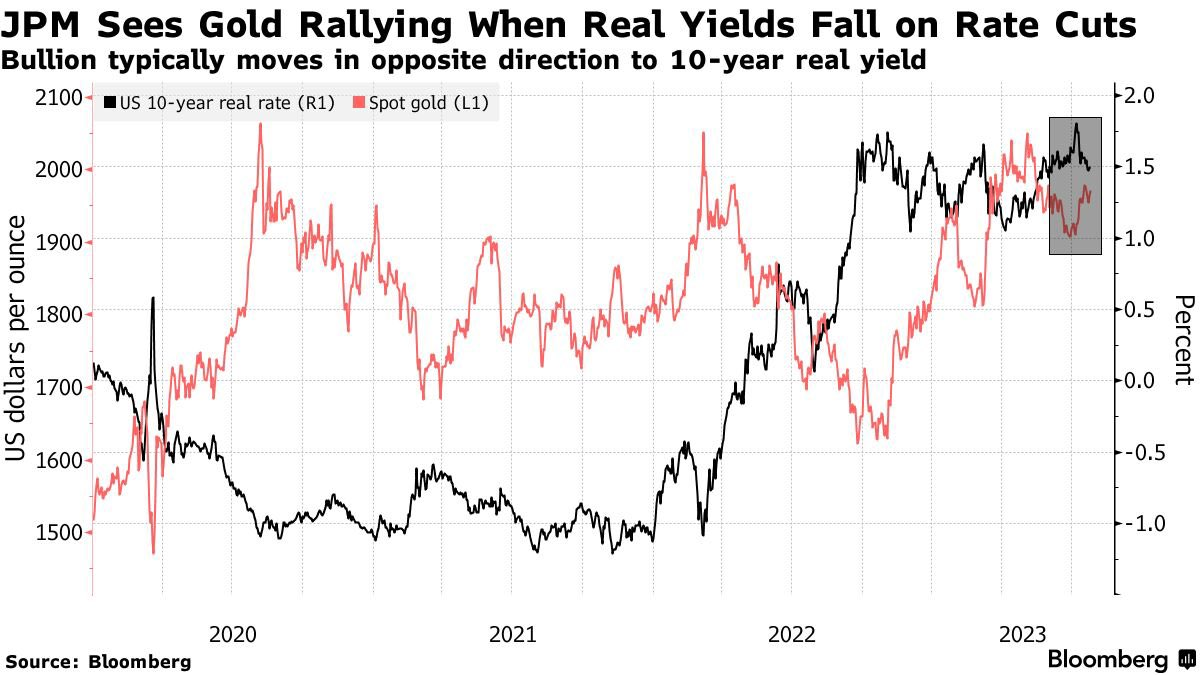
JP Morgan says Gold will rally past $2,000 by year end and hit an all-time high in 2024
Trucking Volumes
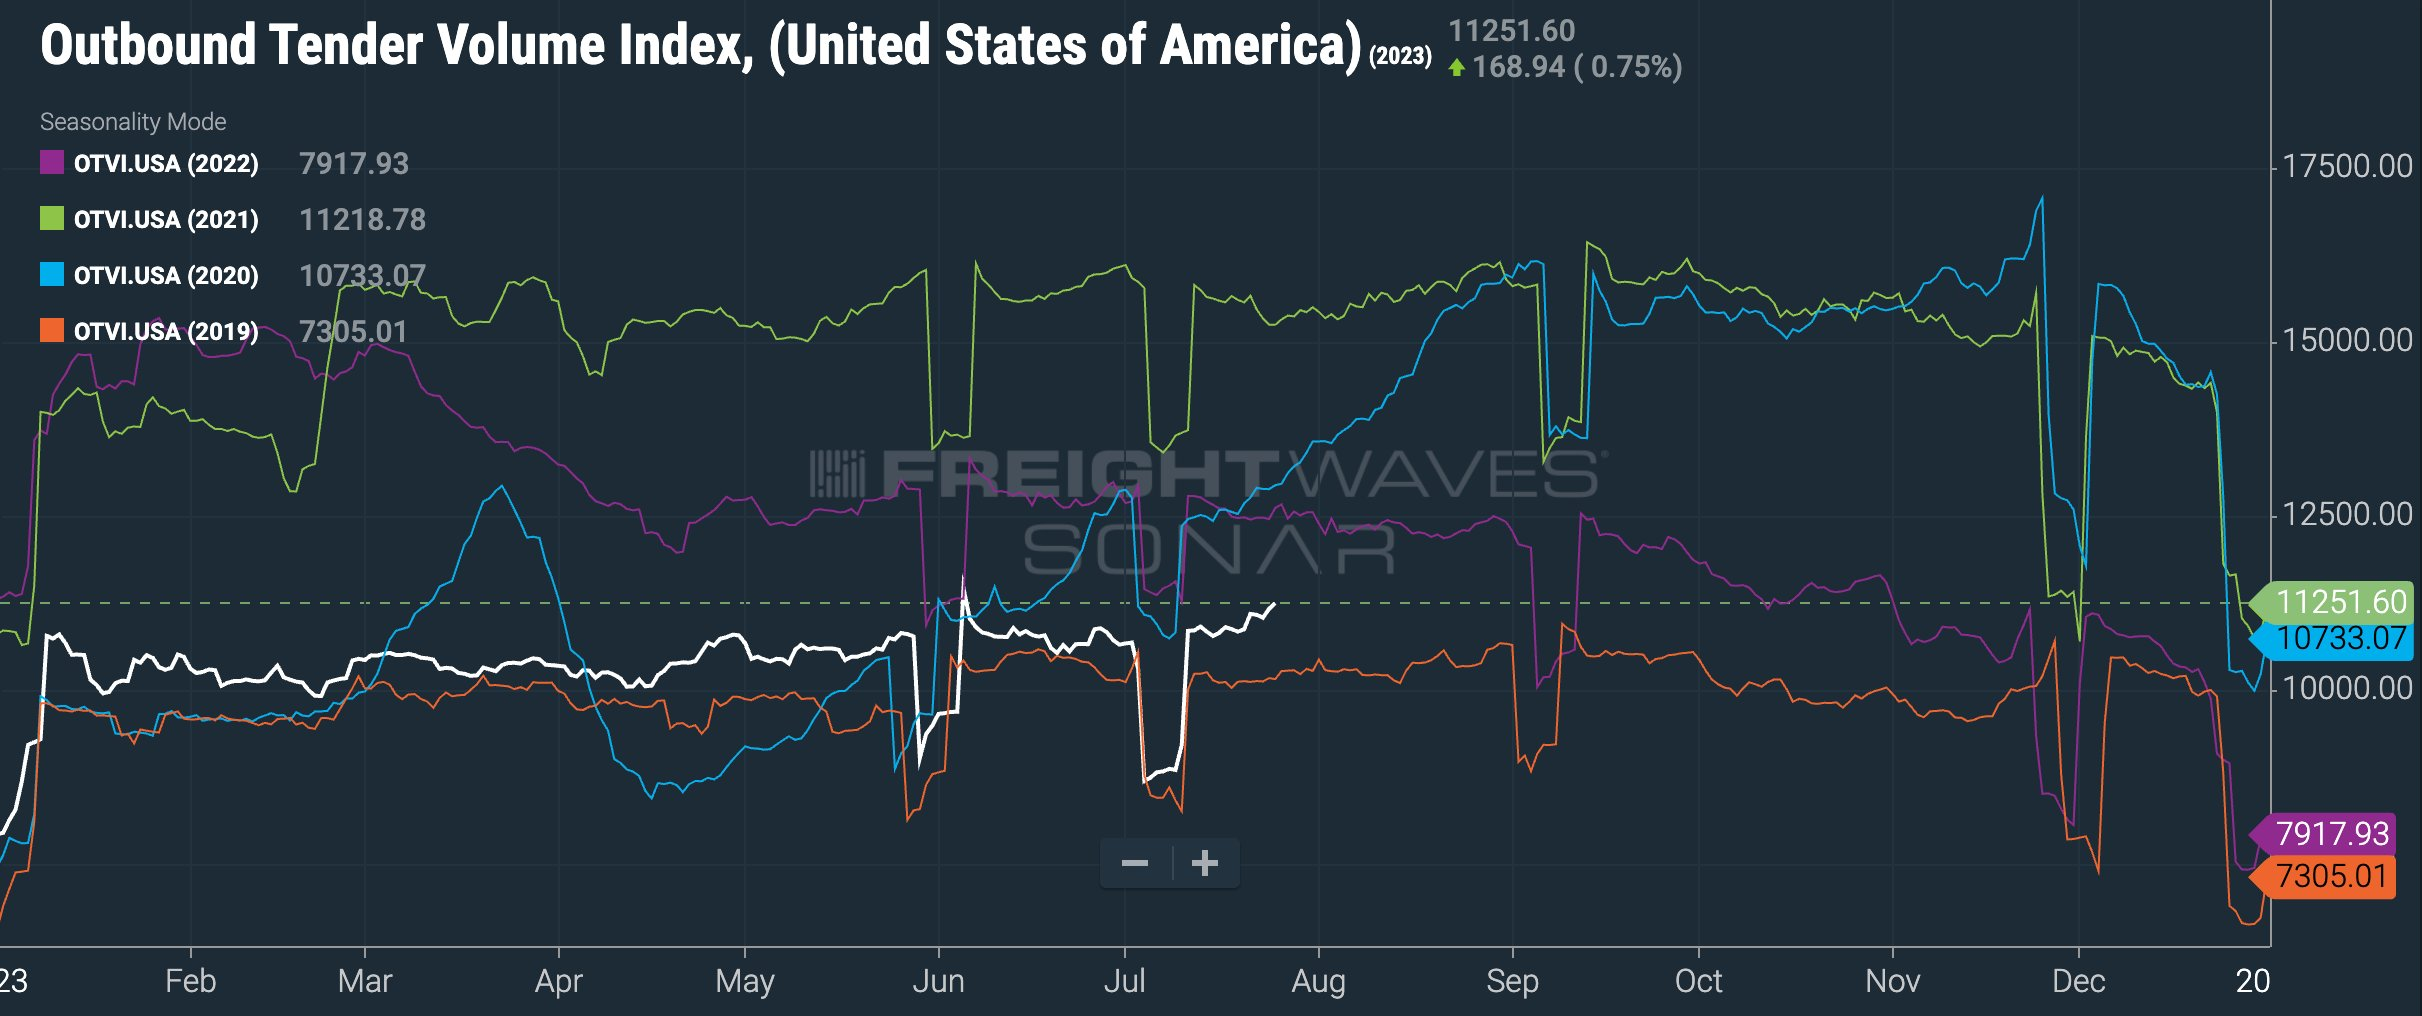
Trucking volumes across the US have started to show some life, as the OTVI breaks out to the highest levels all year.
July is usually a slow month, but not this year.
Luxury Transaction Volume

Some of the biggest drops in luxury home sales have been in areas that seemed unstoppable during pandemic
Luxury transaction volume in Miami: -40% YoY
Source Tweet - Gunjan Banerji
WSJ - The Luxury Home Market Confronts Its New Reality: Not Enough Buyers and Sellers
META Earning
A live $META thread of Q2 23 Earnings call:
- On Reels and Reels monetization:
"Reels plays exceed 200B per day across Facebook & Instagram...the annual revenue run rate across our apps now exceeding $10B from $3B last fall" - $META CEO
- Meta CEO reiterates commitment to BOTH the metaverse and AI:
"...we've been working on both of these 2 major priorities for many years in parallel now & in many ways. The two areas are overlapping and complementary" - $META CEO
- On the $META headcount:
"We ended the Q2 with over 71,400 employees down 7% from Q1. Our Q2 head count still included roughly half of the approximately 10,000 employees impacted by the 2023 layoffs. We expect that our Q3 head count will no longer include the vast majority of impacted employees"

- On ad revenues:
"Within AD revenue the online commerce vertical was the largest contributor to YoY growth, followed by entertainment & media and CPG. Online commerce benefitted from strong spend among advertisers in China, reaching customers in other markets" - $META CFO
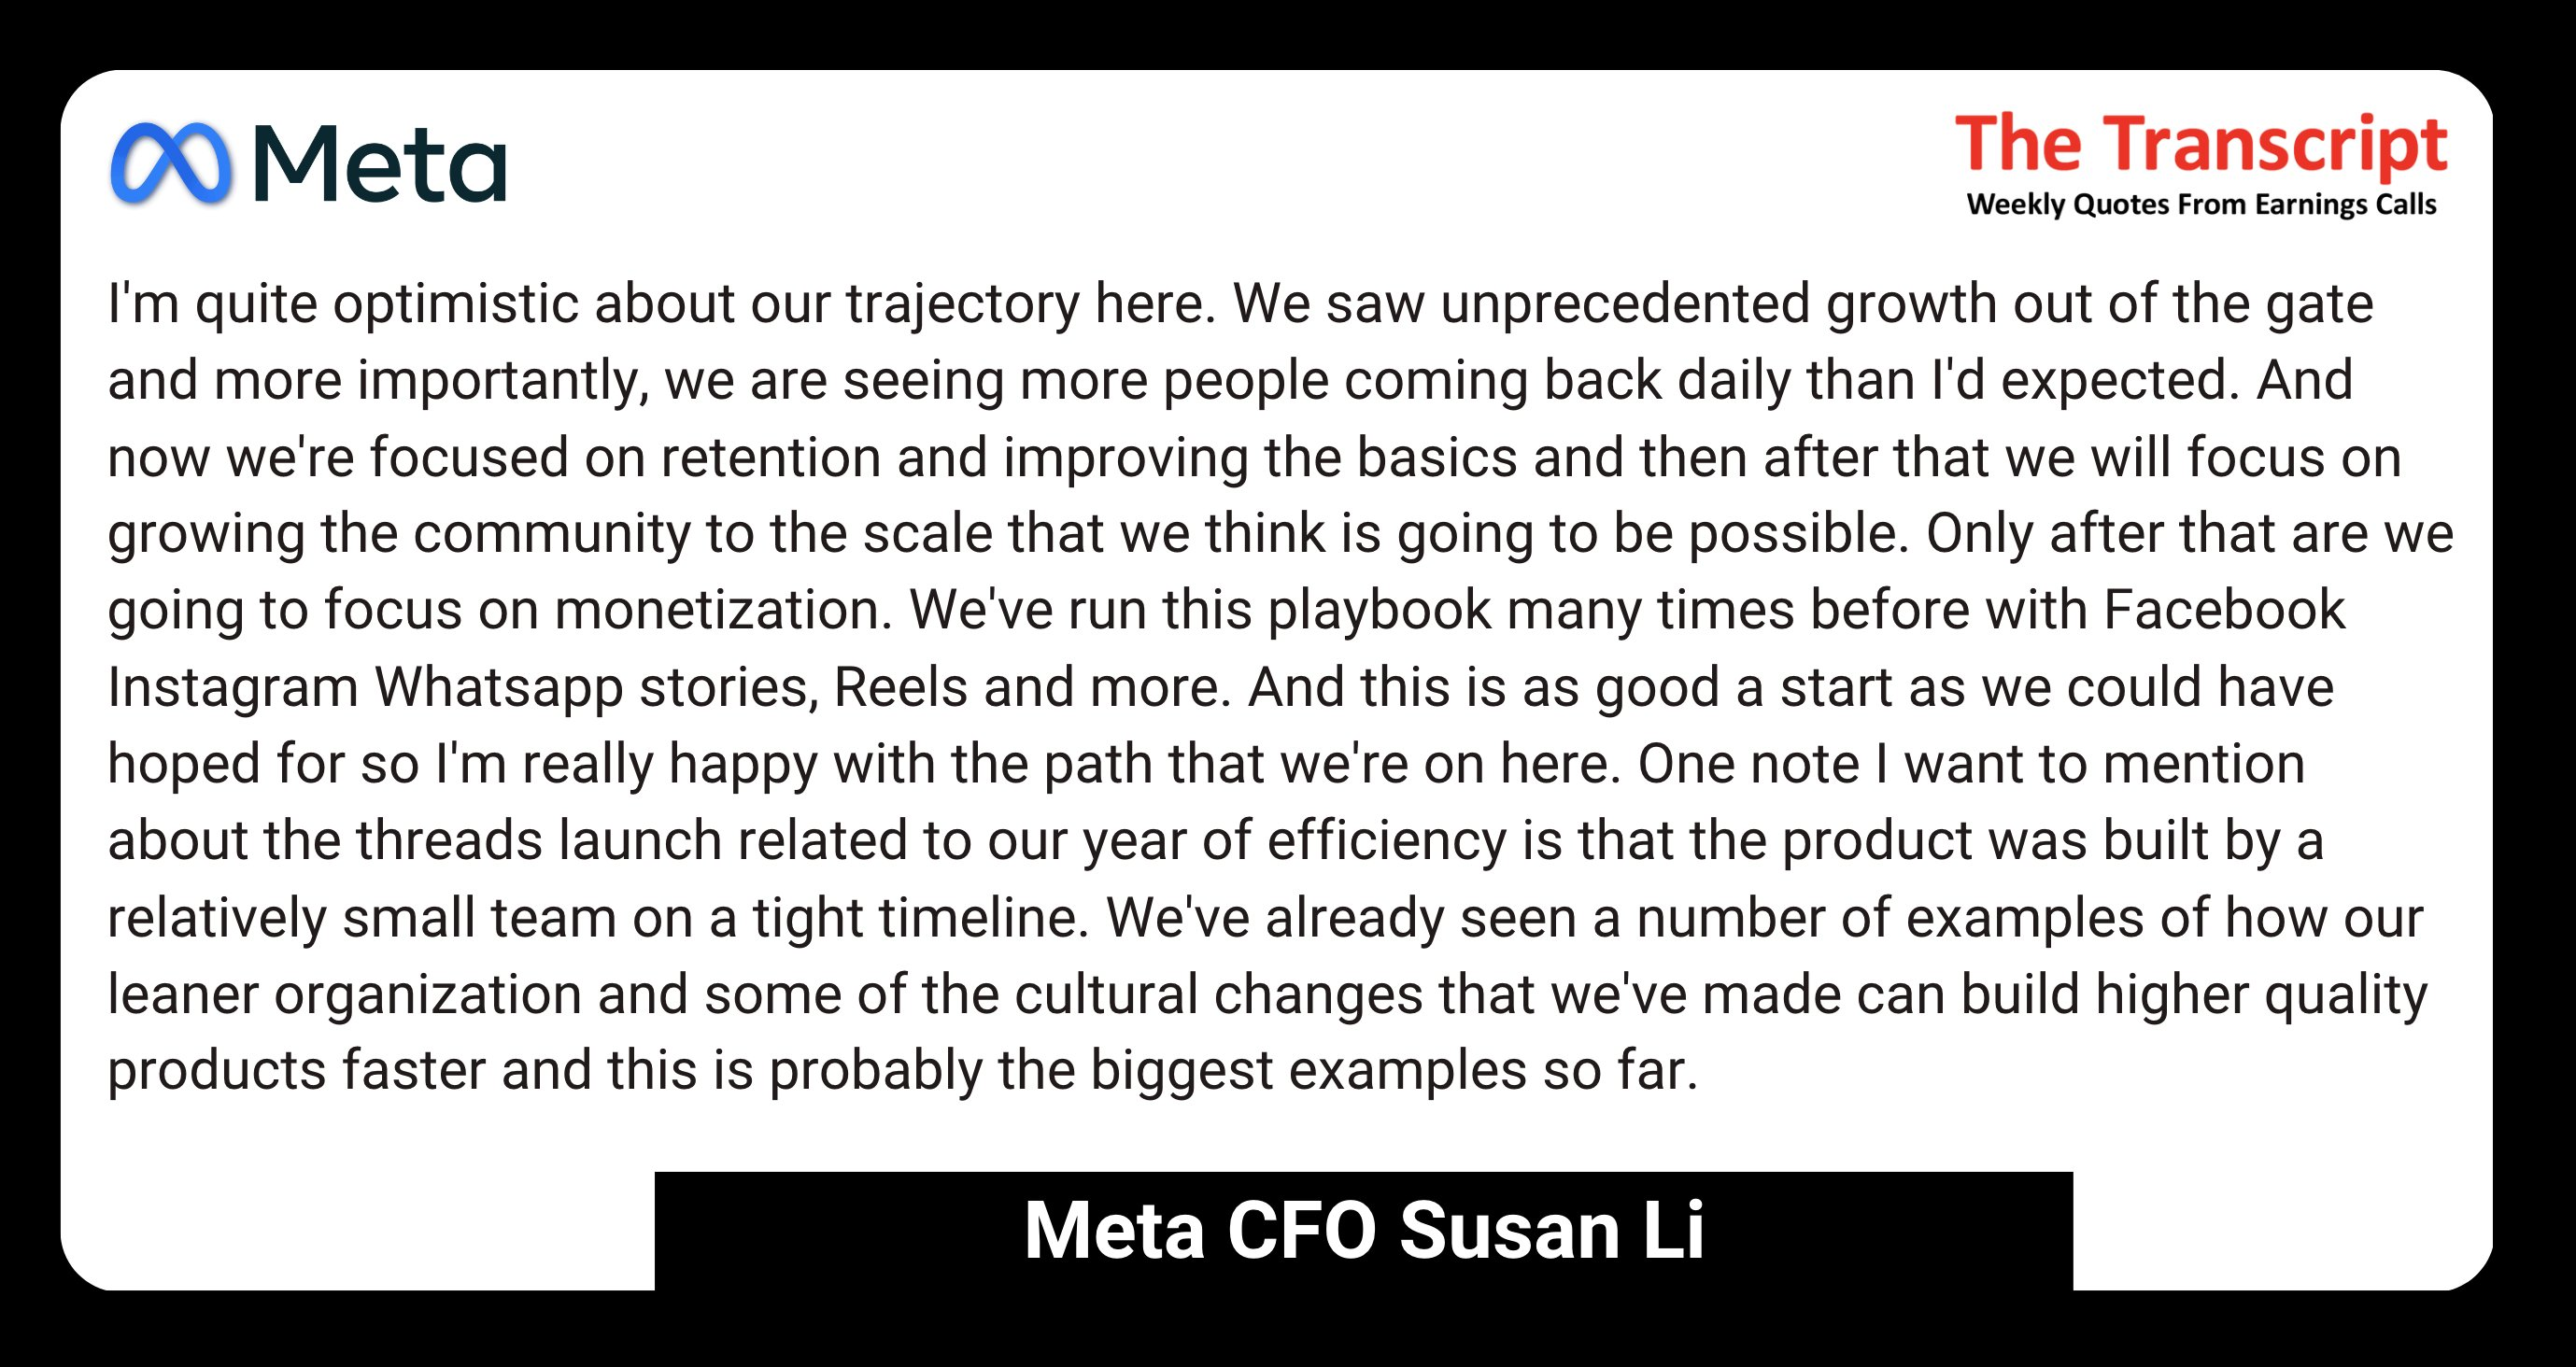
- On Threads:
"We saw unprecedented growth out of the gate and more importantly, we are seeing more people coming back daily than I'd expected. And now we're focused on retention and improving the basics" - $META CFO
- On partnering with $MSFT:
"We partnered with Microsoft specifically because we don't have public cloud offerings. So this isn't about us getting into that it's actually the opposite. We wanted to work with them because...we aren't planning on building out" - $META CEO
- On metaverse:
"I don't think theres much change there except that I'd say the signals that we're getting from the market are that it's certainly not getting adopted a lot faster than we expected. Sort of the somewhat sobering signal" - $META CEO
- On Threads:
"We're off to great start and I'm optimistic that over time this could be a fifth great app in the family of apps, but we have a lot of basic work to do" - $META CEO
- FX to be a tailwind in H2 23:
"Q3 22 revenue declined 4.5% YoY so we're really lapping a much weaker demand period, a year ago & we've certainly seen demand this year stabilize...we also are expecting that currency is going to flip to a three-point tailwind from a one-point headwind last quarter...at current rates, FX would be a larger tailwind in Q4 than we're expecting it to be in Q3." - $META CFO
National Debt/Inflation
Some analysts and economic theories say that the current interest on the US national debt contributes to inflation and could cause a resurgence in high inflation.
Let's run the math on this to see if this makes sense (HINT: it doesn't).
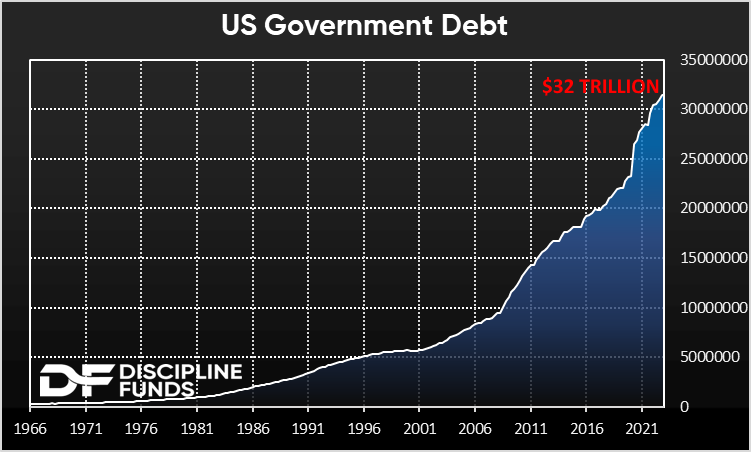
First, the government currently has $32 trillion of federal debt.
That's up 40% in just the last 3 years. And the Fed has raised rates from 0% to 5.5% so now the government has to pay interest on this mountain of debt.
BUT...the majority of govt debt isn't held by the domestic private sector.
According Treasury $12T is owned by the Fed and other parts of the government. And $7.3T is owned by foreign governments.
That leaves about $13T in the domestic pvt sector.
The CBO estimates that interest costs will be $750B in 2024. That would be a near doubling in interest costs from 2022.
But remember, most of this is just going to the Fed and foreign govts, not domestic private entities.
An Update to the Budget Outlook: 2023 to 2033
But the interest rate on govt debt doesn't all rollover with the Fed Rate. Much of it has been financed at the prior low rates so the average interest rate on the national debt now sits at 2.75%.
On the $13T debt held by the pvt sector that's a total interest cost of $360B.
That's a substantial increase from $185B in 2022 when rates were still at 0%. But is a annual domestic private interest payment of $360B really big enough to drive inflation in the future?
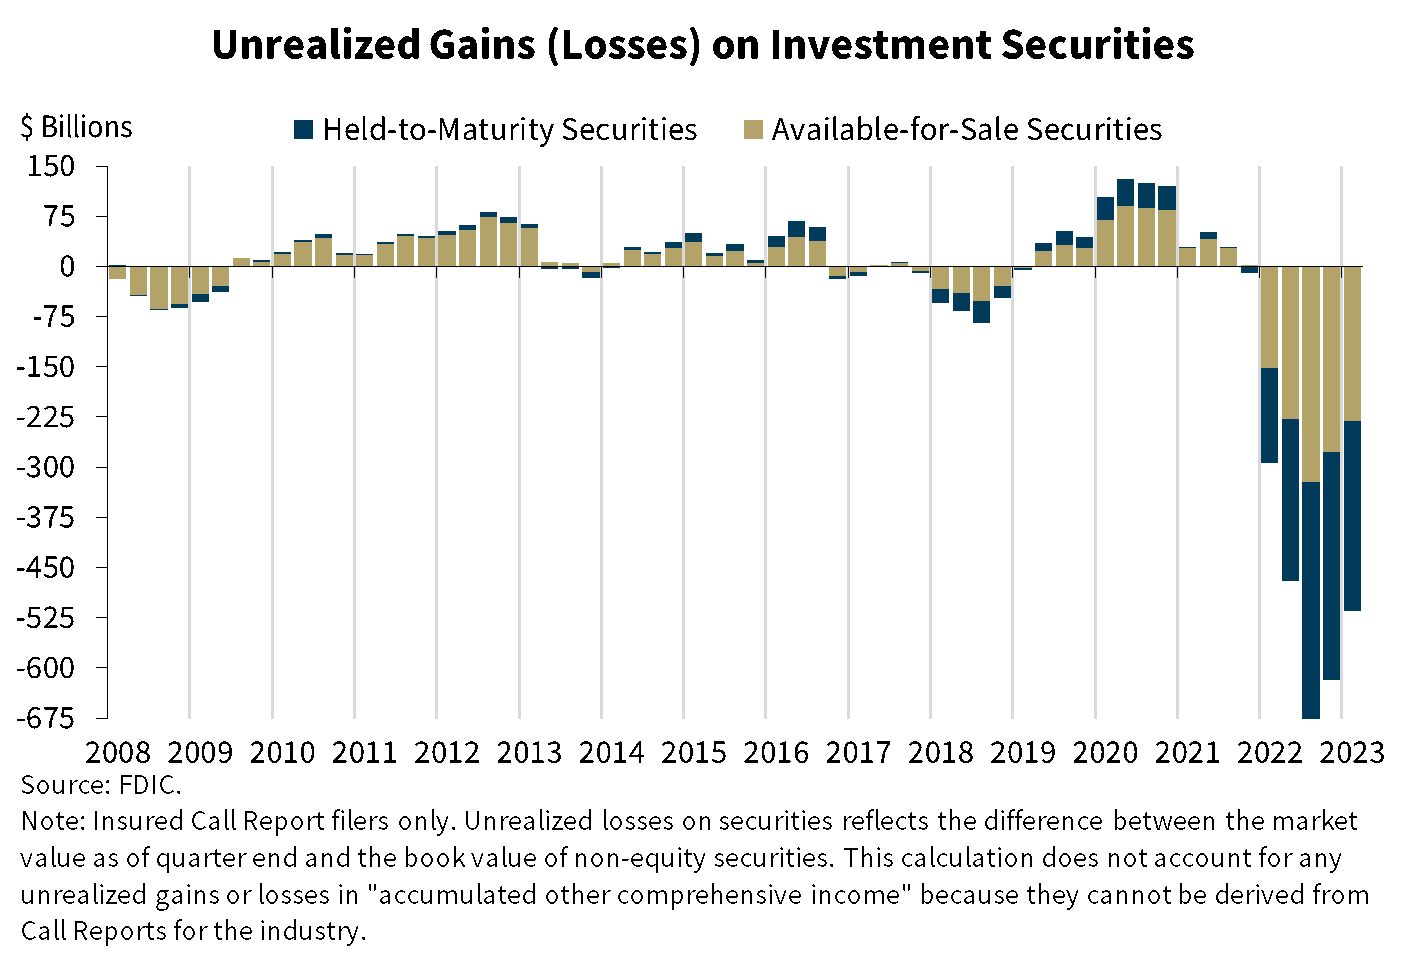
For perspective, the US bond market incurred unrealized losses of $4 TRILLION since the Fed raised interest rates.
According to the FDIC banks alone incurred unrealized losses of $515B.
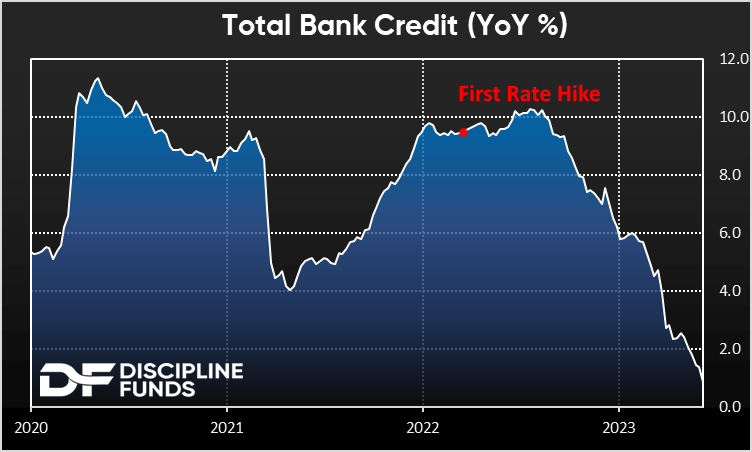
Equally important, total loans and credit have cratered since the Fed started raising rates. The 5 year average growth was 7%, now 0%.
That means there's $1.1 TRILLION of credit expansion that hasn't occurred since rate hikes slowed credit growth.
The contraction in credit and bond markets massively dwarfs the $360B in annual domestic pvt interest payments.
It's possible that credit rebounds and the economy adjusts, but the math is clear and so far the rate hikes are having a disinflationary impact.
Analysis Articles