Sites의 Head Markup에서 Script를 불러옵니다.
1. 사용하고 싶은 CodePen을 찾습니다.
https://codepen.io/haiiaaa/pen/rNVbmYy
2. Script의 경우 url을 Site Head MarkUp에 저장합니다

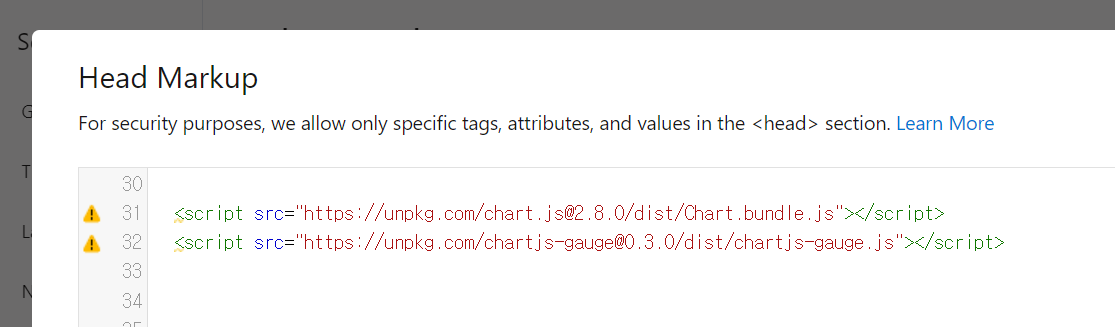
(백업 필수)
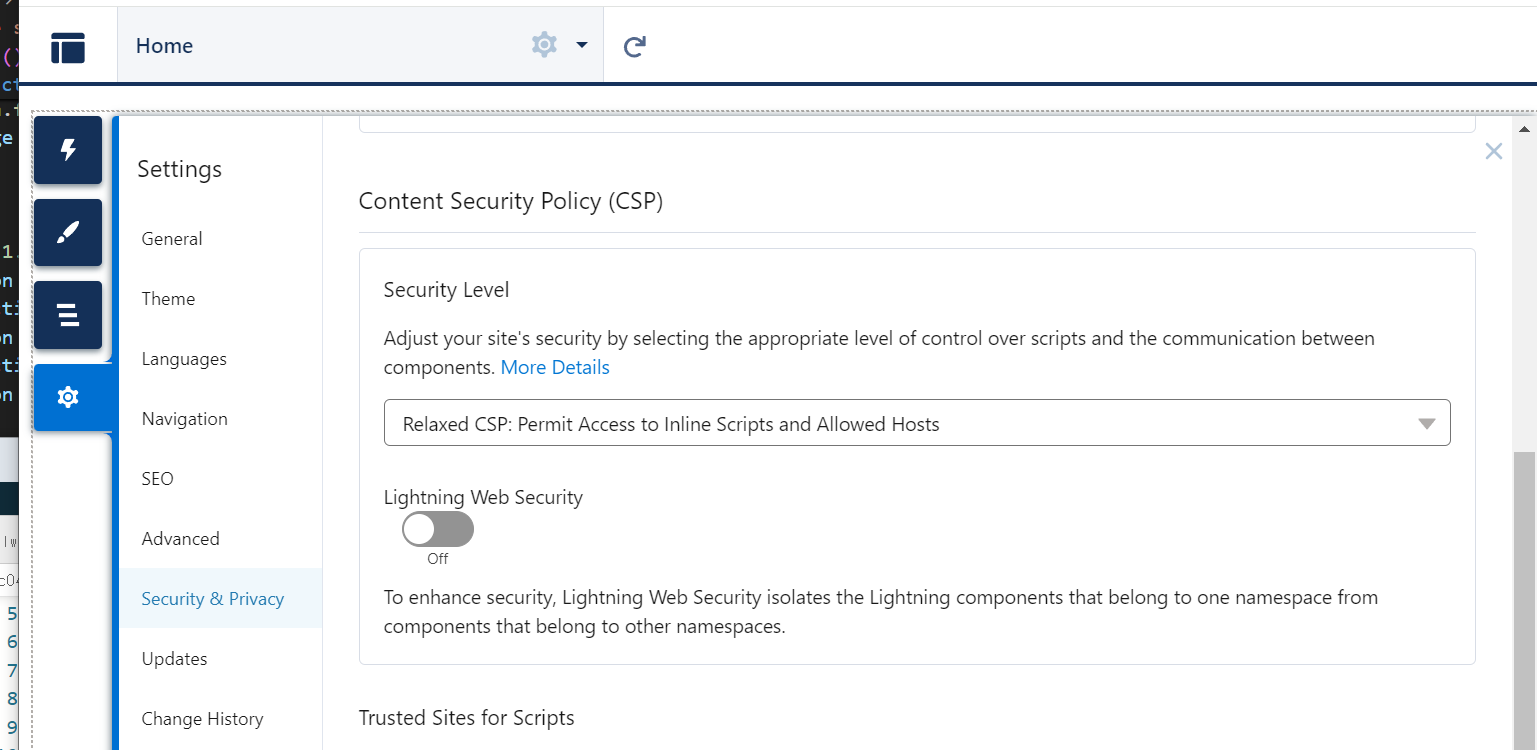
(CSP 설정도 잊지 맙시다.)
3. LWC를 생성합니다.
시험삼아 Lightning Studio Code로 작성했습니다.
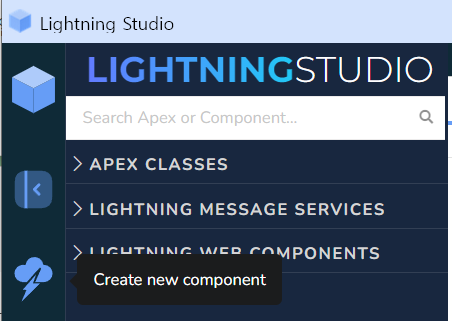
위에서 3번째, 번개치는 구름 모양을 눌러 만들어줍니다

Deploy 를 눌러 저장해줍니다.
(vscode와 함께 쓰는 경우 retrieve를 잊지 마세요)
4. 코드 작성 (일부 영역은 LWC에 맞춰 수정)
lwc041gauge.html
<template>
    <div class="chart" style="width:100%"></div>
</template>
lwc041gauge.js
import { LightningElement, track } from 'lwc';

export default class Lwc041gauge extends LightningElement {
    @track chartValue;
    @track isFirstRender = true;
    async renderedCallback() {
        if (this.isFirstRender) {
            this.createGauge();
            this.isFirstRender = false;
        }
    }
    createGauge() {

        // 기존 코드는 id값으로 canvas 영역을 찾았으나, class로 해당 영역을 감쌀 부분을 찾아 canvas태그를 추가하는 것으로 변경
        const canvas = document.createElement('canvas');
        this.template.querySelector('div.chart').appendChild(canvas);
        const ctx = canvas.getContext('2d');
        console.log('ctx : ', ctx);

        // 기존 코드는 window.myGauge에 값을 저장했으나, chartValue라는 변수에 값을 저장
        this.chartValue = new Chart(ctx, this.setConfig());//this.config
        console.log('this.chartValue, ', this.chartValue);
    }
    setConfig() {
        let config = {
            type: 'gauge',
            data: {
                //labels: ['Success', 'Warning', 'Warning', 'Error'],
                datasets: [{
                    data: [10, 25, 45, 100], // 영역 값 [a범위, a+b범위, a+b+c범위, a+b+c+d범위]
                    value: 12, // 실제 바늘이 이동하는 값
                    backgroundColor: ['green', 'yellow', 'orange', 'red'],
                    borderWidth: 2
                }]
            },
            options: {
                responsive: true,
                title: {
                    display: true,
                    text: 'Gauge chart'
                },
                layout: {
                    padding: {
                        bottom: 30
                    }
                },
                needle: {
                    // Needle circle radius as the percentage of the chart area width
                    radiusPercentage: 2,
                    // Needle width as the percentage of the chart area width
                    widthPercentage: 3.2,
                    // Needle length as the percentage of the interval between inner radius (0%) and outer radius (100%) of the arc
                    lengthPercentage: 80,
                    // The color of the needle
                    color: 'rgba(0, 0, 0, 1)'
                },
                valueLabel: {
                    formatter: Math.round
                }
            }
        };

        return config;
    }

}
5. Publish 후 화면 확인
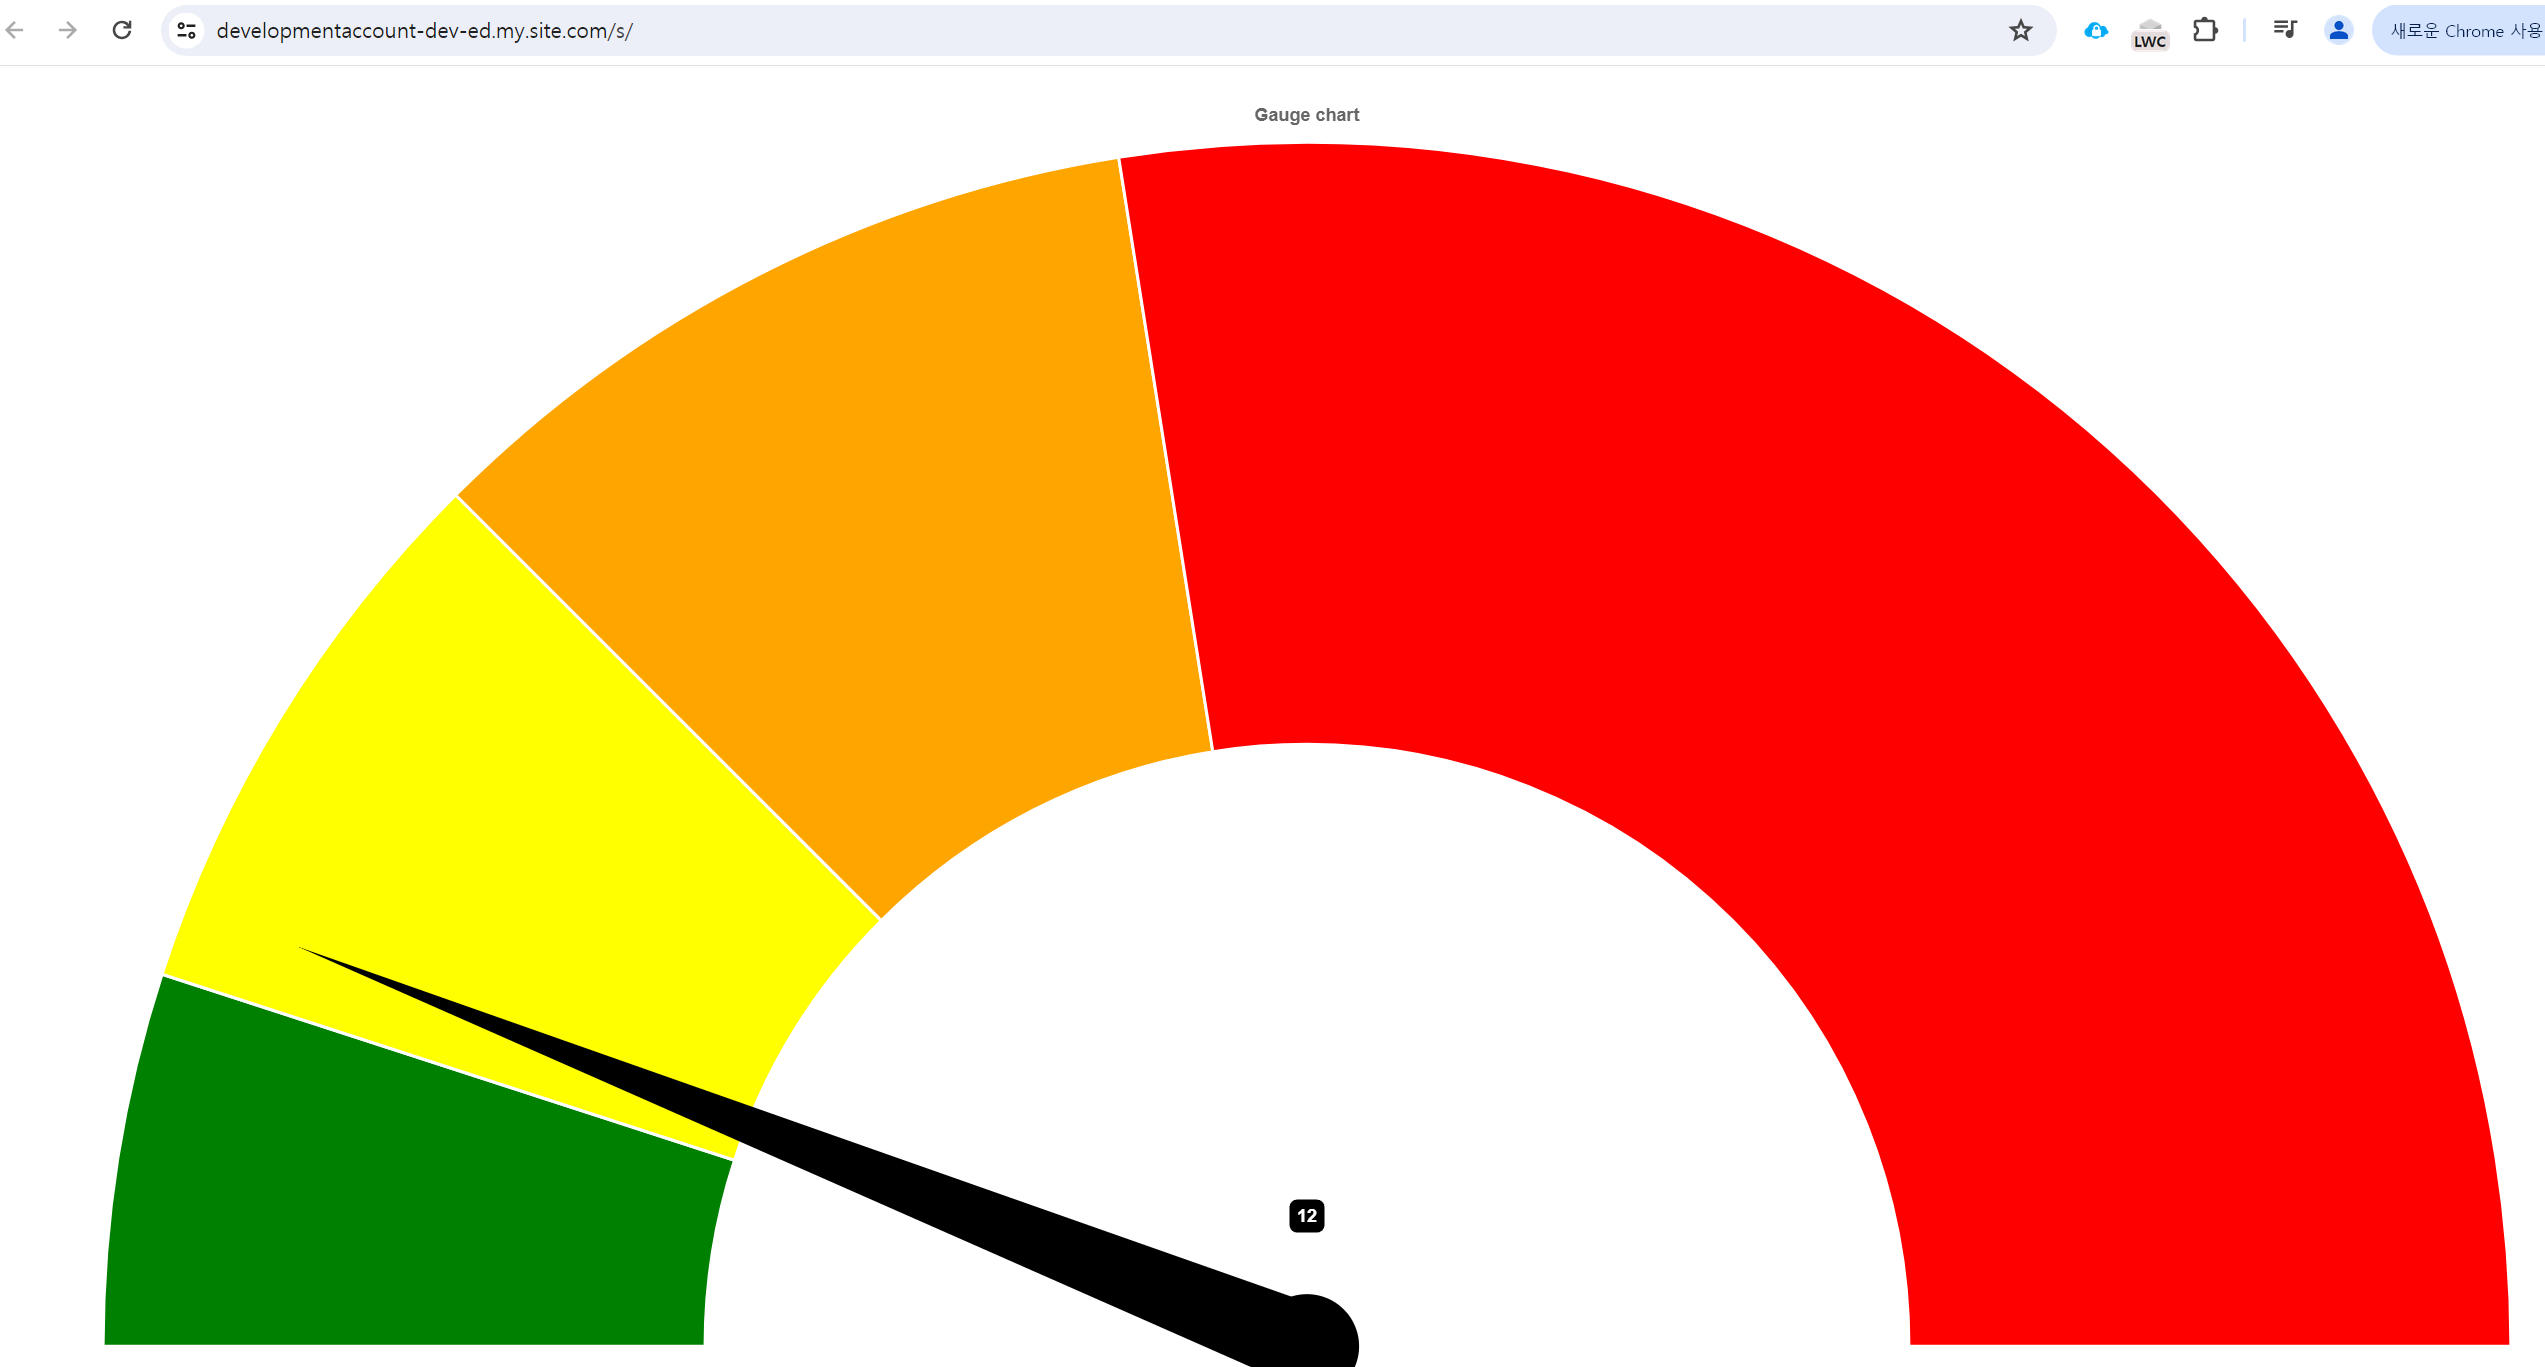
잘 나옵니다.

개인 공부 기록용.