한 주 돌아보기
👍 잘한 점
- Pre-과정과 빌드업 공통 과정을 복습하고 수업에 들어간 것
- 덕분에 수업 내용을 잘 따라갈 수 있었음
- 매일 코딩테스트 연습 문제 푼 점
- 30분 일찍 도착한 점
👎 아쉬웠던 점
- 복습에 너무 많이 시간을 할애해 원래 계획했던 다른 일(논문 읽기) 못한 점
- 직무 탐색을 거의 하지 않은 점
- 강사님이 직무 탐색과 이력서, 자기소개서 준비를 지금부터 해야 한다고 강조하셨는데 이걸 잘 지키지 못했다.
- 커리어 업 HR 튜터님께 뭘 질문해야 하는 건지 모르겠어서 적극적으로 참여하지 못했음
🔬 개선점
- 앞으로는 수업 내용만 복습하고 Pre-과정, 빌드업 공통 과정은 필요한 부분만 따로 찾아보기
- 직무 탐색, 이력서, 자기소개서, 포트폴리오 작성에 더 신경쓰기
- 커리어 업 과정에 더 집중하기
주말 학습 내용
자주 쓰는 code 정리
파일 위치 변경(Change Directory)
%cd라이브러리 불러오기
import _ as _
from _ import _ as _
보통 아래 4개는 기본으로 불러오고 시작
import numpy as np
import pandas as pd
import matplotlib.pyplot as plt
import seaborn as sns
csv 데이터 읽어오기
pandas.read_csv("파일 경로")인덱스 설정 따로 하고 싶을 경우
pandas.read_csv("파일 경로", index_col="인덱스로 쓰고 싶은 컬럼명")인코딩 감지
- 내용이 한글인 csv 데이터는 읽어오는 과정에서 인코딩이 필요할 수 있음
import chardet
with open("파일 경로", "rb") as f:
    data = f.read()
chardet.detect(data)
인코딩 감지 결과 반영
- 한글은 보통 EUC-KR, UTF-8, cp949 중 하나임
pandas.read_csv(
	"파일 경로"
    , encoding="감지된 인코딩"
    , index_col="인덱스로 쓰고 싶은 컬럼명"
)
파일 크기가 큰 경우
- low_memory=False 파라미터 추가
pandas.read_csv(
	"파일 경로"
    , encoding="감지된 인코딩"
    , index_col="인덱스로 쓰고 싶은 컬럼명"
    , low_memory=False
)
데이터 내용 확인(앞/뒤)
pandas.DataFrame.head()
pandas.DataFrame.tail()
데이터 크기 확인
pandas.DataFrame.shape()데이터 정보 확인
pandas.DataFrame.info()데이터 기술통계량 확인
pandas.DataFrame.describe()특정 컬럼의 기술통계량만 확인
pandas.DataFrame["컬럼명"].describe()상관계수 확인
pandas.DataFrame.corr()수치형 데이터가 아닌 컬럼이 함께 있을 때
- numeric_only=True 파라미터 추가
pandas.DataFrame.corr(numeric_only=True)특정 컬럼에 영향을 많이 미치는 컬럼 확인
- 절댓값 변경 후 내림차순 정렬
pandas.DataFrame.corr(numeric_only=True)["특정 컬럼명"].abs().sort_values(ascending=False)Pivot Table
- 데이터 요약표
pandas.DataFrame.pivot_table(
	values = "출력할 데이터로 사용할 컬럼명"
    , aggfunc = "그룹화 결과로 출력할 함수"
    , index = ["데이터 요약 시 함께 사용할 컬럼명"]
)
DataFrame.pivot_table(values=None, index=None, columns=None, aggfunc='mean', fill_value=None, margins=False, dropna=True, margins_name='All', observed=<no_default>, sort=True)
Parameters:
- values: list-like or scalar, optional
- Column or columns to aggregate.
- index: column, Grouper, array, or list of the previous
- Keys to group by on the pivot table index. If a list is passed, it can contain any of the other types (except list). If an array is passed, it must be the same length as the data and will be used in the same manner as column values.
- columns: column, Grouper, array, or list of the previous
- Keys to group by on the pivot table column. If a list is passed, it can contain any of the other types (except list). If an array is passed, it must be the same length as the data and will be used in the same manner as column values.
- aggfunc: function, list of functions, dict, default “mean”
- If a list of functions is passed, the resulting pivot table will have hierarchical columns whose top level are the function names (inferred from the function objects themselves). If a dict is passed, the key is column to aggregate and the value is function or list of functions. If margin=True, aggfunc will be used to calculate the partial aggregates.
- fill_value: scalar, default None
- Value to replace missing values with (in the resulting pivot table, after aggregation).
예시
df = pd.DataFrame({"A": ["foo", "foo", "foo", "foo", "foo",
                         "bar", "bar", "bar", "bar"],
                   "B": ["one", "one", "one", "two", "two",
                         "one", "one", "two", "two"],
                   "C": ["small", "large", "large", "small",
                         "small", "large", "small", "small",
                         "large"],
                   "D": [1, 2, 2, 3, 3, 4, 5, 6, 7],
                   "E": [2, 4, 5, 5, 6, 6, 8, 9, 9]})
table = pd.pivot_table(df, values='D', index=['A', 'B'],
                       columns=['C'], aggfunc="sum")
table
C large small
A B
bar one 4.0 5.0
two 7.0 6.0
foo one 4.0 1.0
two NaN 6.0멀티 인덱싱
- 다중 인덱싱이라고도 함
- 두 개 이상의 인덱스가 있을 때 데이터를 추출하는 방법
pandas.DataFrame.loc[(앞 인덱스명, 뒤 인덱스명), 컬럼명]pandas.DataFrame.apply()
- 각 행(또는 열)마다 함수를 반복적으로 적용
- 데이터프레임이나 시리즈의 각 행 또는 열에 대해 함수를 한 번씩 적용하고, 그 결과를 새로운 시리즈나 데이터프레임으로 반환하는 방식으로 작동
- 지정한 축(행 또는 열)을 따라 각각의 행(또는 열)을 함수에 전달 → 함수의 리턴값을 모아 새로운 시리즈 또는 데이터프레임 생성
- axis 파라미터에 따라 행/열 단위로 함수가 적용
- axis=0 (기본값): 각 열을 함수에 전달
- axis=1: 각 행을 함수에 전달
- 복잡한 조건이나 여러 컬럼을 동시에 활용하는 가공에 유용
- 반복문보다 코드가 간결하고 가독성이 높음
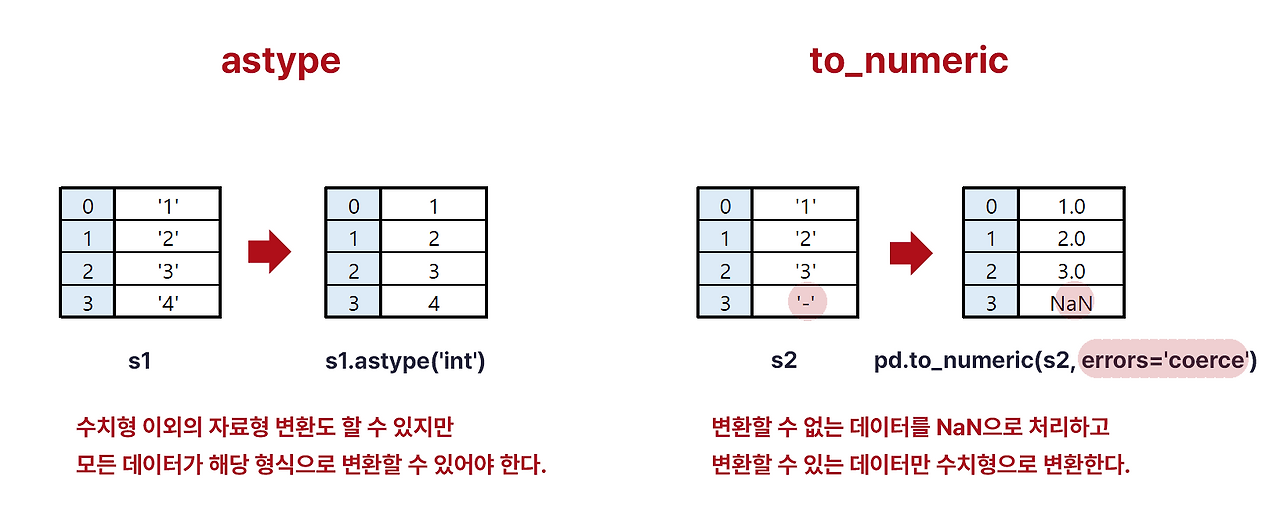
수치형 데이터로 변환
pandas.DataFrame.astype("dtype")
pandas.DataFrame.astype({"column": "dtype"})
pandas.to_numeric(arg)
pandas.to_numeric(arg, errors = "coerce") # 숫자형으로 바꿀 수 없는 값을 결측치(np.nan)로 대체- agg: scalar, list, tuple, 1-d array, or Series
- Argument to be converted.
| 기능 | astype | to_numeric |
|---|---|---|
| 데이터 프레임에 적용 | O | apply 함수로만 가능 |
| 실수의 정수 변환 | O (소수점 이하 내림 처리) | X |
| 메서드 형태로 적용 | O | X |
| 변환할 수 없는 데이터 처리 | 에러 발생 | NaN으로 변환(errors='coerce') |
고유값 반환
pandas.unique()개수 세기
- count, size, value_counts
- count
- NaN 값은 세지 않는다!
- 데이터프레임에 적용하면 각 컬럼에 몇 개의 데이터가 있는지 출력
- 시리즈 형태에도 적용 가능(특정 컬럼에 몇 개의 데이터가 있는지 확인)
- size
- NaN값 포함해서 센다
- value_counts
- 시리즈의 값이 정수, 문자열, 카테고리 값인 경우(데이터프레임에는 적용 불가)
- 각각의 값이 나온 횟수를 센다
- count
pandas.DataFrame.count()
pandas.DataFrame.size
pandas.Series.value_counts()
결측값 관련
pandas.isna(obj)
pandas.DataFrame.isna()
pandas.notna(obj)
pandas.DataFrame.notna()
pandas.DataFrame.fillna([value, method, axis, ...])
pandas.DataFrame.dropna(*[, axis, how, thresh, ...])
https://pandas.pydata.org/docs/reference/general_functions.html

2 B R 0 2 B