문제
국가지표 분석
(world_indexes.csv 다운 후 진행)
주어진 데이터에는 여러 가지 지표가 column에 포함되어 있습니다.
- 기대 수명: 'Life expectancy at birth- years'
- 인터넷 사용자 비율: 'Internet users percentage of population 2014'
- 숲 면적 비율: 'Forest area percentage of total land area 2012'
- 탄소 배출 증가율: 'Carbon dioxide emissionsAverage annual growth'
다음 중 가장 연관성이 깊은 지표를 찾아보세요.
1
기대 수명 - 인터넷 사용자 비율
2
숲 면적 비율 - 탄소 배출 증가율
3
인터넷 사용자 비율 - 숲 면적 비율
4
기대 수명 - 탄소 배출 증가율
5
기대 수명 - 숲 면적 비율
답안 (1번)
연관이 가장 높은것은 1번이다.
1.
df.plot(kind='scatter', x='Life expectancy at birth- years', y='Internet users percentage of population 2014')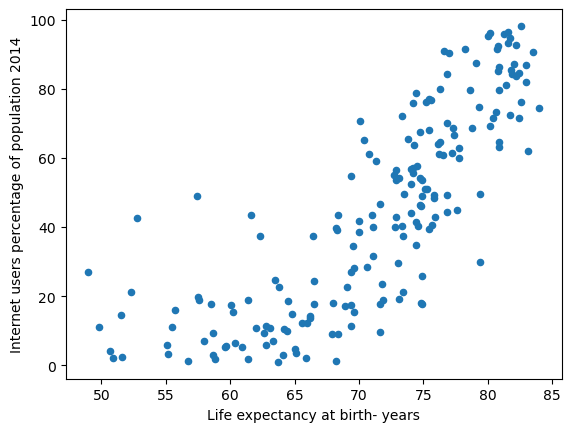
2.
df.plot(kind='scatter', x= 'Forest area percentage of total land area 2012', y='Carbon dioxide emissionsAverage annual growth')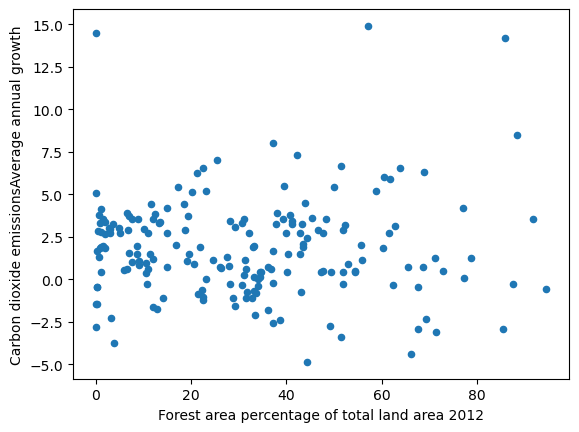
3.
df.plot(kind='scatter', x= 'Internet users percentage of population 2014', y='Forest area percentage of total land area 2012')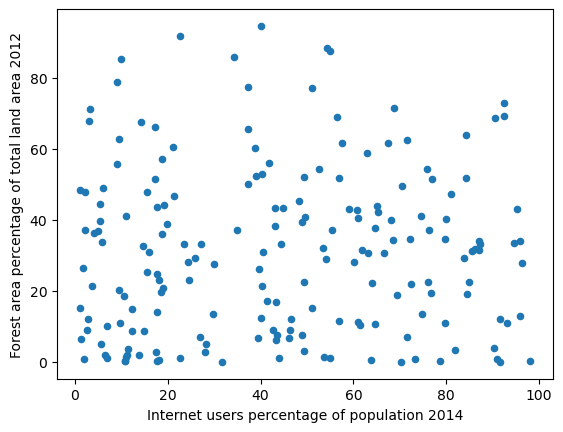
4.
df.plot(kind='scatter', x= 'Life expectancy at birth- years', y='Carbon dioxide emissionsAverage annual growth')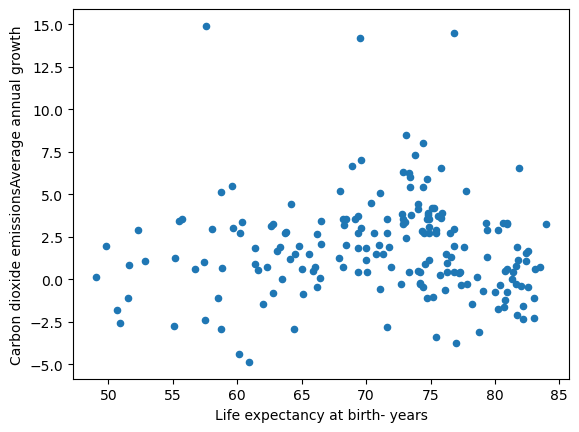
5.
df.plot(kind='scatter', x= 'Life expectancy at birth- years', y='Forest area percentage of total land area 2012')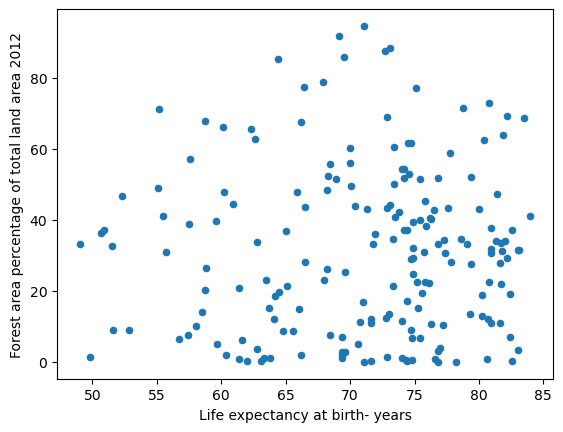

미래개발자