한 번 제대로 이해하고 가고 싶어서, 위의 원문을 직접 번역하면서 제 말로 다시 정리했습니다. 영어 원문과 한국어 번역이 더 정확할 수 있습니다. 더 정확한 내용을 보시려면 원문으로 들어가셔서 확인해주세요. 제 번역과 이해는 완벽하지 않을 수 있는 점을 참고 부탁드립니다.😊

전형적인 탐색적인 데이터 분석에서 우리는 Dataset을 나누고 세분화하여 집계한 뒤, 문제에 접근하는 방식으로 데이터를 이해합니다. 비슷하게 Hadley Wickham의 유명한 paper에서도 데이터 분석에 있어 split-apply-combine 전략이 가장 흔한 전략 중 하나라고 하네요.
Introduction
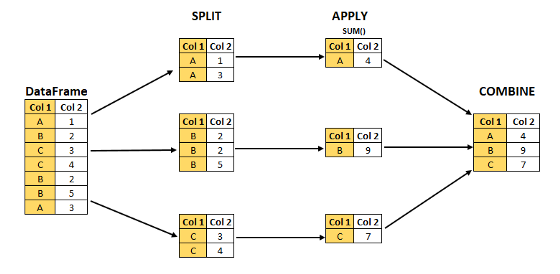
아래의 일러스트는 big problem을 풀기 위해 작고 관리하기 쉬운 조각으로 나누고(split), 이를 독립적으로 처리하고(apply), 이 조각을 다시 합치는(combine) split-apply-combine strategy 전략을 시도하고 있습니다.
Split-Apply-Combine 전략은 SQL의 Groupby 함수와 Tableau의 LOD, R의 plyr 등의 많은 도구를 통해 사용됩니다. 또한, 우리는 이 전략의 구현에 대해서만 논의할 것이 아니라 Feature Enginnering에서 이 전략을 관련하여 적용하는 것도 볼 것입니다.
파이썬에선 GroupBy를 사용하며 할 수 있고, 또한 Split-Apply-Combine 전략의 세 단계에서 한 가지 또는 더 많은 것을 포함할 수 있습니다. 이 3단계를 각각 나눠보도록 하겠습니다.
Feature A: Shows the Split-Apply-Combine using an aggregation function.
-
Split: 데이터를 일부 기준에 따라 데이터를 그룹으로 나누어서 GroupBy 객체를 만듭니다. 여기서 우리는 데이터를 그룹으로 Split하기 위해 column 또는 combination of columns(컬럼의 조합)을 사용할 수 있습니다.
-
Apply: 각 그룹을 독립적으로 처리하기 위한 함수입니다. 이 종류로는 Aggregate, Transform or Filter가 있습니다.
-
Combine: 데이터 구조에 맞게 결과를 합칩니다. 판다스의 Series와 DataFrame이 있습니다.
Dataset
이제 본격적으로 내용을 시작해 보려고 합니다. 어떤 가상의 데이터를 예로 만들어 보겠습니다.
직접 코드를 쳐서 확인하고 싶으신 분들은 해당 링크를 눌러주세요.
필요한 모듈을 불러와 봅시다.
>>> import pandas as pd
>>> import numpy as np
>>> import matplotlib.pyplot as plt
>>> import seaborn as sns
딕셔너리 자료형을 만들어줍니다.
>>> sales_dict={'colour':['Yellow','Black','Blue','Red','Yellow','Black','Blue',               'Red','Yellow','Black','Blue','Red','Yellow','Black','Blue','Red','Blue','Red'],
           'sales':[100000,150000,80000,90000,200000,145000,120000,
                    300000,250000,200000,160000,90000,90100,150000,142000,130000,400000,350000],
          'transactions':[100,150,820,920,230,120,70,250,250,110,130,860,980,300,150,170,230,280],
           'product':['type A','type A','type A','type A','type A','type A','type A',
                      'type A','type A','type B','type B','type B','type B','type B','type B','type B','type B','type B']}
딕셔너리를 DataFrame으로 바꿔주고, 변형된 DataFrame을 확인해 보겠습니다.
>>> data_sales=pd.DataFrame(sales_dict)
>>> data_sales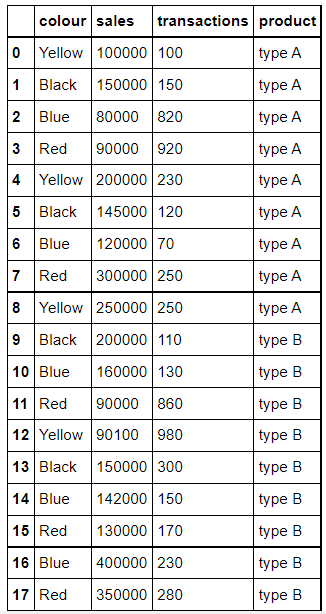
데이터프레임은 전체 데이터를 요약하는 역할을 합니다. seaborn 라이브러리는 데이터를 점진적으로 포함하면서 이걸 시각화하는데 사용됩니다.
더 많은 시각화 자료는 위의 링크를 들어가서 확인해주세요. 여기선 그 중에 색깔별로 transaction과 sales를 FacetGrid로 표현하였습니다.
>>> graph = sns.FacetGrid(data_sales, col="colour", height=4, hue="product",aspect=.5)
>>> graph.map(plt.scatter, "transactions", "sales");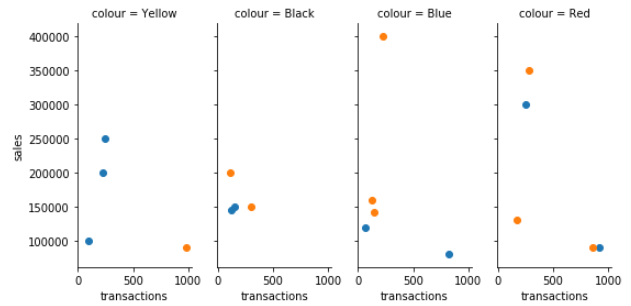
이제 이 데이터를 만들고 요약도 하였으니 그 후 Split-Apply-Combine 전략의 첫 번째 단계로 들어가겠습니다.
SPLIT: Create an object
앞에서 Split의 개념을 살짝 설명했지만, Split 한다는 건 각각의 객체를 만든다는 의미와 같습니다.
가장 먼저 dataframe의 column 'colour'를 바탕으로 'data_sales' 별로 그룹을 만들어 보겠습니다.
# Split: Groupby the column 'colour'

>>> data_gby = data_sales.groupby('colour')
print(type(data_gby))
데이터프레임에서 groupby() 함수를 적용하면 GroupBy 객체란 결과가 만들어집니다. 여기서 이 객체는 데이터프레임의 각 그룹으로 분리되었음을 생각할 수 있습니다. 각 그룹은 그룹의 네 가지 컬럼('Black', 'Blue', 'Red', 'Yellow')의 분류기준에 따라 만들어집니다.
이 GroupBy 객체는 딕셔너리의 key value로부터 그룹을 개별의 데이터로 저장합니다. 이 그룹 이름을 알기 위해서 우리는 'keys' 속성을 사용하거나 객체의 'groups' 속성을 사용할 수 있습니다.
# lets check the names of the groups

>>> data_gby.groups

{'Black': Int64Index([1, 5, 9, 13], dtype='int64'),
 'Blue': Int64Index([2, 6, 10, 14, 16], dtype='int64'),
 'Red': Int64Index([3, 7, 11, 15, 17], dtype='int64'),
 'Yellow': Int64Index([0, 4, 8, 12], dtype='int64')}
직접 눈으로 확인하니 더 명확하게 이해가 되는 것 같습니다. 우리는 루프를 실행하고 key, vlaue 쌍을 확인할 수 있습니다.
### 'key' is the name of the group and 'value' is the segmented rows from the original DataFrame.

>>> for key, value in data_gby:
    print('GroupName: ',key)
    print(value)
    print('-------------------------------------------')

    GroupName:  Black
   colour   sales  transactions product
1   Black  150000           150  type A
5   Black  145000           120  type A
9   Black  200000           110  type B
13  Black  150000           300  type B
-------------------------------------------
GroupName:  Blue
   colour   sales  transactions product
2    Blue   80000           820  type A
6    Blue  120000            70  type A
10   Blue  160000           130  type B
14   Blue  142000           150  type B
16   Blue  400000           230  type B
-------------------------------------------
GroupName:  Red
   colour   sales  transactions product
3     Red   90000           920  type A
7     Red  300000           250  type A
11    Red   90000           860  type B
15    Red  130000           170  type B
17    Red  350000           280  type B
-------------------------------------------
GroupName:  Yellow
    colour   sales  transactions product
0   Yellow  100000           100  type A
4   Yellow  200000           230  type A
8   Yellow  250000           250  type A
12  Yellow   90100           980  type B
-------------------------------------------
'key'는 group의 이름이고, 'value'는 원래 데이터프레임으로부터 나온 분할된 행입니다.
위의 예시를 통해, GropuBy 객체의 속성과 방법을 더 명확하게 이해하고 나아갔으면 합니다. 그 다음은 Apply입니다.
APPLY: Apply a function over the object
Apply 단계는 세 가지 방법으로 구성됩니다. : Aggregation, Transformation, & Filtering. 우리는 Aggregation을 사용한 경험이 더 많을테지만, 대부분의 사람들은 Transformation과 Filtering에 대해서는 많이 접해보지 못했을 수 있습니다. 여기서는 특히 Transformation에 중점을 두고 다룹니다.
AGGREGATION
GroupBy 객체를 사용하여 집계 함수를 적용하는데 이미 익숙하다는 걸 가정하고 함수의 기능에 대해 설명하겠습니다.
Aggregating in the Groups created by multiple columns
그룹을 만드는데 하나의 column만 사용되는 것은 아닙니다. 아까 4가지 색상을 기반으로 4개의 그룹을 만들었는데요. 여기서 카테고리를 더 추가하여 'product', 'colours'의 columns을 사용한다면, 총 8가지의 카테고리가 나올 것입니다.
ex) 'type A-Blue', 'type A-Black', ...
계산은 쉽습니다. 4가지 색상 x 2가지 제품 = 8 입니다.
>>> data_prod_colour_index=data_sales.groupby(['product','colour'], as_index=True).sum()         # Note: as_index=True
>>> data_prod_colour_index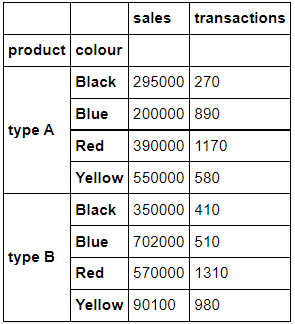
어떤 DataFrame이 조회되었나요?
위에서는 'product','colour'의 컬럼을 기준으로 집계 함수의 sum()을 사용하여, 조합으로 이루어진 제품별, 색상별의 'sales', 'transaction'의 합계를 얻습니다.
'as_index=True' 매개변수는 'product','colour'를 인덱스로 사용한다는 의미입니다. 반대로 False로 값을 입력하면 'product','colour'을 인덱스로 가져오지 않고 열로 가져옵니다.
이를 확인해 보겠습니다.
>>> data_prod_colour_Noindex = data_sales.groupby(['product','colour'],as_index=False).sum()
>>> data_prod_colour_Noindex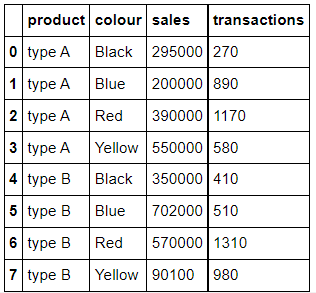
두 차이가 확연히 보이나요? index로 들어갈 것인지, column에 포함될 것인지의 차이를 확인할 수 있습니다.
Custom Aggregation grouped by Multiple Columns
앞의 예시는 오로지 모든 열에 집계 함수를 하나만 사용하는 경우였습니다. 근데 우리는 다른 열들을 다른 집계 함수로 aggregate하고 싶다면, 우리는 각각의 집계 함수를 맞게 사용하여 집계해야 할 것입니다.
우리는 column명을 'key'로 함수의 이름을 'value'로 지정하는 집계 함수를 만들기 위해 딕셔너리를 사용할 수 있습니다.
흥미로운 건, 우리는 이 multiple aggregation를 열에 전달할 수 있다는 점입니다! 🙄 말로는 정확한 이해가 어려울 수 있습니다. 또 코드로 만나보겠습니다.
## Custom Aggregation in GroupBy using Dictionaries. Without Groupby column as Index ('as_index=0').

>>> data_sales.groupby(['product','colour'], as_index=True).agg({'sales': np.sum, 'transactions':[np.median,'count']})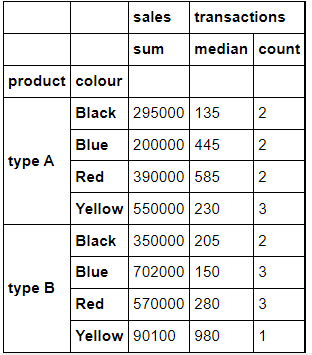
천천히 코드를 살펴봅시다!
'sales' 컬럼은 sum() 합을, 'transactions' 거래 컬럼은 numpy의 median과 count 값을 집계하고 싶다고 사용하였고, 'product', 'colour'는 인덱스로 사용하였습니다. 즉, 제품과 색상별로 판매의 합과 거래의 중앙값과 횟수를 조회하였습니다.
TRANSFORMATION
Transform 함수는 Feature Engineering의 아주 유용한 기능입니다. 이건 GroupBy 객체와 함께 사용되는 함수, 메소드입니다.
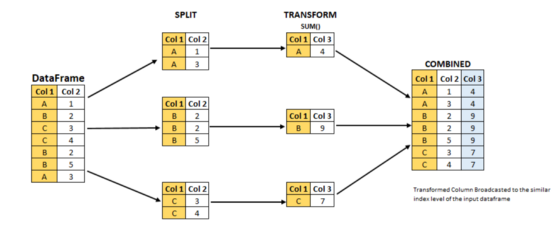
위 이미지는 transform 함수를 이용한 Split-Apply-Combine 전략을 나타낸 것입니다.
이미지로 확인해보면 TRANSFORMATION에서 데이터프레임의 shape이 줄어든 모습을 볼 수 있습니다. 근데 유의할 점이 있습니다. combine의 데이터프레임을 보면 결국은 input과 output의 row는 동일하다는 점입니다.
출력값은 SPLIT과 TRANSFORMATION이 일어나는 동안 데이터프레임의 길이를 유지합니다.
먼저, Apply 단계에서 Transfomr 함수가 적용되고, 이 단계에서 row는 줄어듭니다. 그 다음에는 Combine 단계인데 Apply 단계의 결과가 원래처럼 다시 되돌아 옵니다. input stage의 데이터프레임 길이와 동일하게 데이터프레임을 만듭니다.
코드로 다시 정리해봅시다. 기승전코드!!!
### Apply the transform function (standard deviation:std()) on the sales column grouped by product column
### It is to be noted that the output has the same number of rows as in input

>>> data_sales['sales_product_std'] = data_sales.groupby('product',as_index=True)['sales'].transform('std')
>>> data_sales.loc[:,['colour','product','sales','transactions', 'sales_product_std']]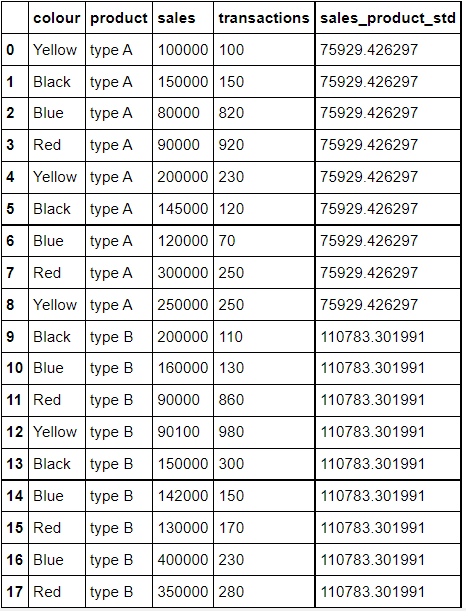
위의 코드를 이해하기 위해 천천히 보겠습니다.
'product' 별로 그룹화 된 'sales' 열의 std를 구하면서 'sales_product_std' 열을 만듭니다.
## Using custom function to transform. Standardization of column 'sales' grouped by column 'colour'

>>> data_sales['sales_stdzed_colour'] = data_sales.groupby('colour')['sales'].transform(lambda x: (x-x.mean())/x.std())
>>> print(data_sales.loc[:,['colour', 'sales', 'sales_stdzed_colour']])

    colour   sales  sales_stdzed_colour
0   Yellow  100000            -0.770946
1    Black  150000            -0.433682
2     Blue   80000            -0.794706
3      Red   90000            -0.824083
4   Yellow  200000             0.513429
5    Black  145000            -0.626430
6     Blue  120000            -0.478090
7      Red  300000             0.872558
8   Yellow  250000             1.155617
9    Black  200000             1.493795
10    Blue  160000            -0.161474
11     Red   90000            -0.824083
12  Yellow   90100            -0.898099
13   Black  150000            -0.433682
14    Blue  142000            -0.303951
15     Red  130000            -0.500913
16    Blue  400000             1.738221
17     Red  350000             1.276520
lambda를 사용했네요. lambda 안에서 데이터프레임 각 행에 평균(mean)과 표준편차(std)를 나눈 값들을 구한 'sales_stdzed_colour'의 새로운 열이 추가되었습니다. 구하는 두 가지 식을 사용하였습니다. 'colour'별로 그룹을 묶고, 'sales'의 x-x.mean())/x.std() 값을 구한 열이 추가된 것입니다.
## Calculation of Group level mean and its broadcasting on to the original data frame.

>>> data_sales['X.mean'] = data_sales.groupby('colour')['sales'].transform('mean')
## Calculation of Group level std dev and its broadcasting on to the original data frame.
>>> data_sales['X.std'] = data_sales.groupby('colour')['sales'].transform('std')## Simple row wise standardization based on X, X.mean , and X.std columns
>>> data_sales['simple_stdzed'] = (data_sales['sales']-data_sales['X.mean'])/data_sales['X.std']## Print both the transformed column and the column with simple calculation and see the difference between the two.
## Both the columns 'simple_stdzed', and 'sales_stdzed_colour' are exactly similar.
## Mean and Std Dev has been calculated based on groups thus we can see the values(X.mean,X.std) repeating for same colours.
>>> print(data_sales.loc[:,['colour', 'sales','X.mean','X.std','simple_stdzed','sales_stdzed_colour']])
colour sales X.mean X.std simple_stdzed sales_stdzed_colour
0 Yellow 100000 160025 77858.862694 -0.770946 -0.770946
1 Black 150000 161250 25940.637360 -0.433682 -0.433682
2 Blue 80000 180400 126336.059777 -0.794706 -0.794706
3 Red 90000 192000 123773.987574 -0.824083 -0.824083
4 Yellow 200000 160025 77858.862694 0.513429 0.513429
5 Black 145000 161250 25940.637360 -0.626430 -0.626430
6 Blue 120000 180400 126336.059777 -0.478090 -0.478090
7 Red 300000 192000 123773.987574 0.872558 0.872558
8 Yellow 250000 160025 77858.862694 1.155617 1.155617
9 Black 200000 161250 25940.637360 1.493795 1.493795
10 Blue 160000 180400 126336.059777 -0.161474 -0.161474
11 Red 90000 192000 123773.987574 -0.824083 -0.824083
12 Yellow 90100 160025 77858.862694 -0.898099 -0.898099
13 Black 150000 161250 25940.637360 -0.433682 -0.433682
14 Blue 142000 180400 126336.059777 -0.303951 -0.303951
15 Red 130000 192000 123773.987574 -0.500913 -0.500913
16 Blue 400000 180400 126336.059777 1.738221 1.738221
17 Red 350000 192000 123773.987574 1.276520 1.276520위의 코드가 이해가 되었나요? 그렇다면 transform 작업을 이해하신 겁니다. 저는 이제 이해를 넘어 직접 칠 수 있게끔 만들어야겠지만요😊
FILTERING
필터링은 이름 그대로입니다. 데이터프레임에서 그룹을 필터링하는데 사용됩니다. 필터링이 그럼 무엇인지 바로 코드로 보고 갑시다!
If we want to filter the dataframe such that it contains only those colours that has average number of transaction greater than the average of some other colour.
만약 다른 색상들의 평균보다 거래 수가 많은 색상만 포함 할 수 있도록 데이터프레임을 필터링하고 싶다면,
>>> grouped = data_sales.groupby('colour')

>>> Blue_avg_transaction= grouped['transactions','sales'].mean().loc['Blue','transactions']
>>> Black_avg_transaction= grouped['transactions','sales'].mean().loc['Black','transactions']
>>> Yellow_avg_transaction= grouped['transactions','sales'].mean().loc['Yellow','transactions']
>>> Red_avg_transaction= grouped['transactions','sales'].mean().loc['Red','transactions']

>>> print('Blue_avg_transaction: ', Blue_avg_transaction)
>>> print('Black_avg_transaction:', Black_avg_transaction)
>>> print('Yellow_avg_transaction: ', Yellow_avg_transaction)
>>> print('Red_avg_transaction:', Red_avg_transaction)


Blue_avg_transaction:  280
Black_avg_transaction: 170
Yellow_avg_transaction:  390
Red_avg_transaction: 496
## The output shows that
filt_df = grouped.filter(lambda x: x['transactions'].mean() > Black_avg_transaction)
print(filt_df.iloc[:,[0,2]])여기서는 어떤 필터가 생겼나요? lambda x: x['transactions'].mean() > Black_avg_transaction 을 보면 비교 연산자를 통해 조건에 맞는 값만 필터링하여 출력할 수 있도록 해주었습니다.
필터링은 방법을 이해하기 쉽습니다! 그래서 바로 SPLIT-APPLY-COMBINE 전략의 마지막 단계로 가겠습니다.
COMBINE
이미 앞에서 combine 섹션은 이미 다루어졌습니다. 그러나 여기엔 공유하고 싶은 중요한 사항이 있다고 합니다!
## Aggregation function mean() applied on only one column 'sales'. Also note as_index=True.
>>> d1 = data_sales.groupby('colour',as_index=True)['sales'].mean()
>>> type(d1) ## The output is Pandas Series

pandas.core.series.Series
>>> print(d1)
colour
Black 161250
Blue 180400
Red 192000
Yellow 160025
Name: sales, dtype: int64## Aggregation function mean() applied on only two columns
>>> d2 = data_sales.groupby('colour',as_index=True).agg({'sales':np.mean, 'transactions': np.sum})
>>> type(d2)
pandas.core.frame.DataFrame>>> print(d2)
sales transactions
colour
Black 161250 680
Blue 180400 1400
Red 192000 2480
Yellow 160025 1560## Aggregation function mean() applied on only one column 'sales'.But now the result is dataframe bec parameter as_index=True
>>> d3 = data_sales.groupby('colour',as_index=False)['sales'].mean()
>>> type(d3) ## The Output is Pandas DataFrame
pandas.core.frame.DataFrame>>> print(d3)
colour sales
0 Black 161250
1 Blue 180400
2 Red 192000
3 Yellow 160025Aggregation은 항상 데이터프레임의 형태로 만들어지는 것은 아닙니다! 이건 주로 'as_index' 매개변수를 설정하는 것에 따라 달라집니다. 이 매개변수가 True이면 집계 함수를 적용하는 열에 따라 형태가 달라집니다.
d1은 'as_index=True'을 통해 'colour'가 인덱스로 들어가며 열이 하나만 남게 되면서 Series 형태가 만들어집니다.
d2는 'as_index=True'지만 뒤의 집계함수가 'sales':np.mean, 'transactions': np.sum으로 'sales'와 'transactions' 두 열이 생기며 데이터프레임의 형태가 만들어집니다.
d3는 'as_index=False'을 통해 'colour'와 'sales'가 열로 들어가며 데이터프레임 구조가 만들어집니다.
End Note
저는 이 글을 읽고 정리를 해보며 Split-Apply-Combine 전략에 대해 이해가 되었고, groupby 함수와 함께 사용할 수 있는 다른 방법을 접하면서 이해되었고 많이 도움이 될 것 같습니다!
아주 좋은 정리 글이었던 것 같습니다! 모두에게 도움이 되었길 바랍니다!🙏

퀄리티 린다G..