.gif)
타이타닉 승선 명단 분석
- 타이타닉은 영국의 화이트 스타 라인이 운영한 북대서양 횡단 여객선이다. 1912년 4월 10일 영국의 사우샘프턴을 떠나 미국의 뉴욕으로 향하던 첫 항해 중에 4월 15일 빙산과 충돌하여 침몰하였다. 타이타닉의 침몰로 1,514명이 사망하였다. [위키백과]
분석 내용 요약
- 목표 : 승객 변수를 분석하여 생존율과의 상관관계 확인
- 주요개념 이해 : 상관 분석, 상관 계수(피어슨 상관 계수), 히트맵
- 데이터 수집 : 탑승자 명단은 seaborn 빌트인 예제 활용
- 데이터 준비 : 결측치 확인 및 치환(중앙값, 최빈값)
- 데이터 탐색 : 정보 확인, 차트 확인
- 데이터 모델링 : 모든 변수 간 상관 계수, 두 변수 간 상관계수
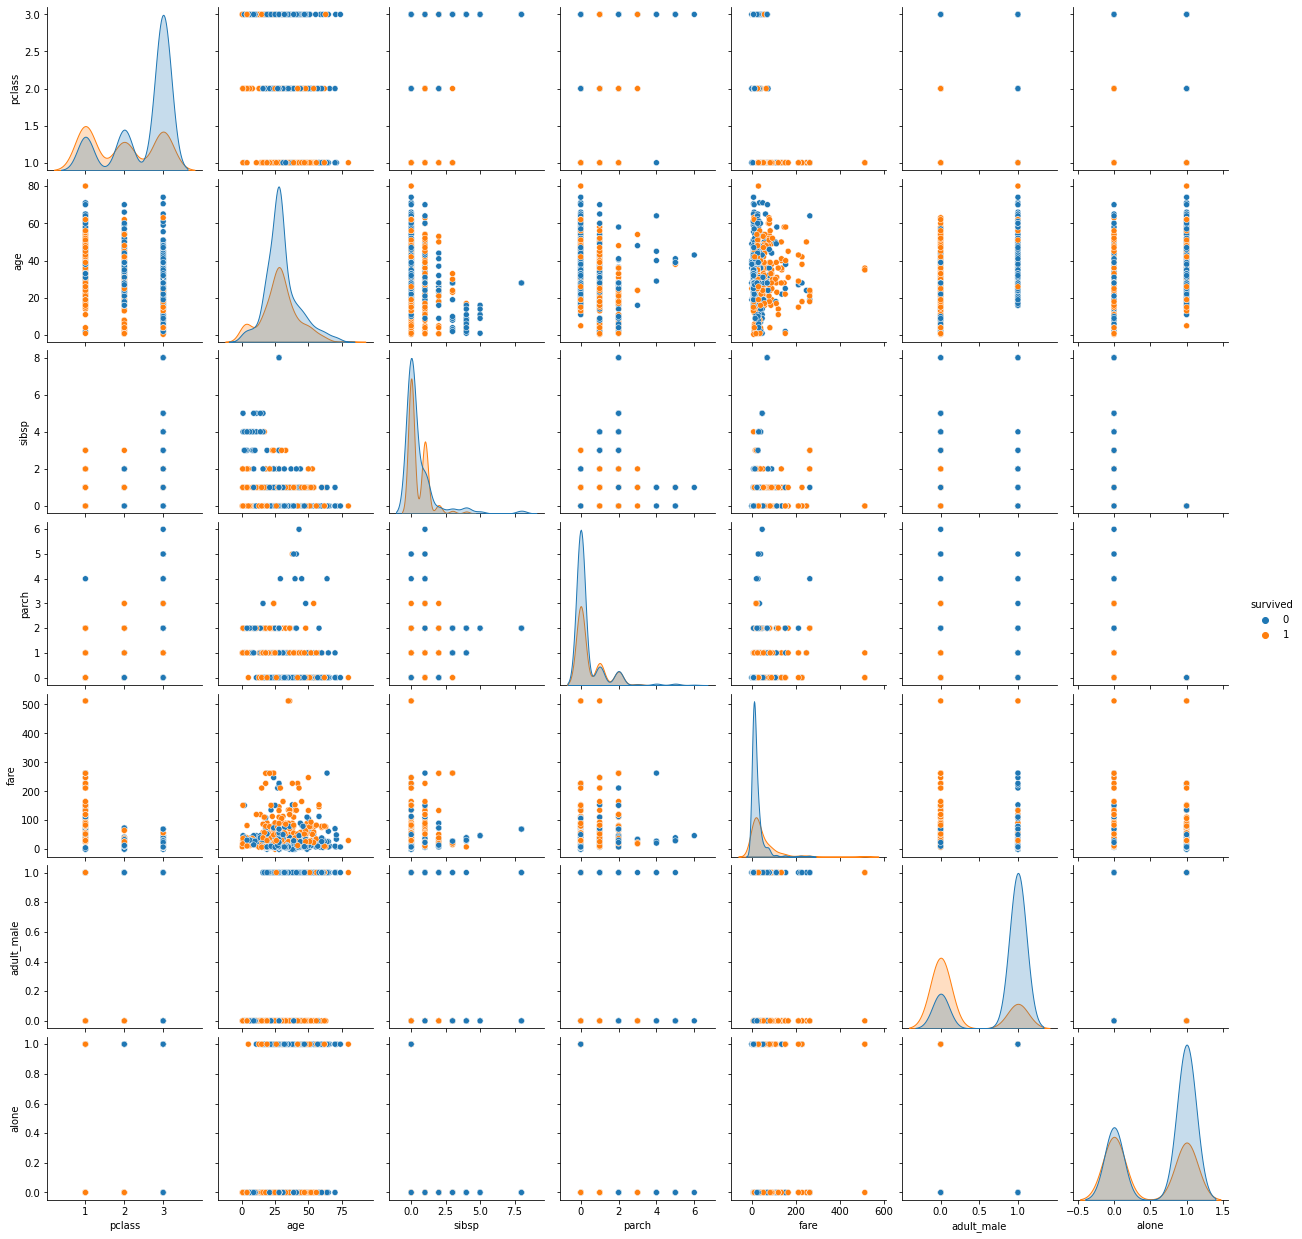
- 변수 간의 상관 관계 시각화 : 전체 산점도, 변수 간 상관관계, 히트맵
핵심 개념
- 상관 분석
- 두 변수가 어떤 선형적 관계가 있는지 분석하는 방법론
- 단순 상관 분석
- 두 변수가 어느 정도 강한 관계에 있는지 측정
- 다중 상관 분석
- 세 개 이상의 변수 간 관계의 강도를 측정
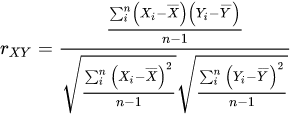
- 피어슨 상관 계수의 결과 해석
- r값은 x와 y가 완전히 동일하면 +1, 반대방향으로 완전히 동일하면 -1, 상관이 없거나 선형관계를 전혀 가지지 않으면 0을 가진다.
타이타닉 승선 명단 확인 및 전처리
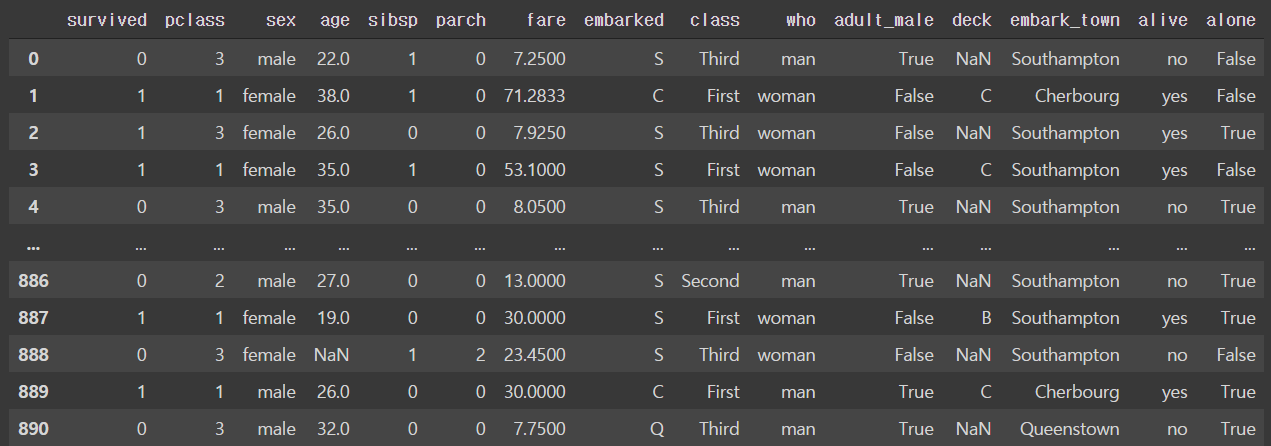
import seaborn as sn

titanic = sns.load_dataset('titanic') # 타이타닉 데이터
titanic.info() # 기본정보 확인
# • survived: 생존 유무 {1: 생존}
# • pclass, class: 선실 등급
# • sibsp: 동승한 형제자매와 배우자 수
# • parch: 동승한 부모/자식 인원수
# • embarked, embark_town: 탑승 항구
# • adult_male: 성인 남성 여부
# • alone: 동반자 동행 여부 { True/False }

> <class 'pandas.core.frame.DataFrame'>
RangeIndex: 891 entries, 0 to 890
Data columns (total 15 columns):
#   Column       Non-Null Count  Dtype
---  ------       --------------  -----
 0   survived     891 non-null    int64
 1   pclass       891 non-null    int64
 2   sex          891 non-null    object
 3   age          714 non-null    float64
 4   sibsp        891 non-null    int64
 5   parch        891 non-null    int64
 6   fare         891 non-null    float64
 7   embarked     889 non-null    object
 8   class        891 non-null    category
 9   who          891 non-null    object
 10  adult_male   891 non-null    bool
 11  deck         203 non-null    category
 12  embark_town  889 non-null    object
 13  alive        891 non-null    object
 14  alone        891 non-null    bool
dtypes: bool(2), category(2), float64(2), int64(4), object(5)
memory usage: 80.6+ KB

# 데이터 확인
titanic
# 결측치 확인
# age, embarked(탑승지), deck(플랫폼 번호), embark_town(탑승 마을) 결측 발생
titanic.isnull().sum()
> survived         0
pclass           0
sex              0
age            177
sibsp            0
parch            0
fare             0
embarked         2
class            0
who              0
adult_male       0
deck           688
embark_town      2
alive            0
alone            0
dtype: int64


# age 평균
titanic['age'].mean()
29.69911764705882

# age 중앙값
titanic['age'].median()
28.0

# deck 원소 개수 확인
titanic['deck'].value_counts()
C    59
B    47
D    33
E    32
A    15
F    13
G     4
Name: deck, dtype: int64

# embarked 원소 개수 확인
titanic['embarked'].value_counts()
S    644
C    168
Q     77
Name: embarked, dtype: int64

# 결측치 처리 하기
# 결측치 중앙값 혹은 최빈값으로 결측치 대체
titanic['age'] = titanic['age'].fillna(titanic['age'].median())
titanic['embarked'] = titanic['embarked'].fillna(titanic['embarked'].mode()[0])
titanic['deck'] = titanic['deck'].fillna(titanic['deck'].mode()[0])
titanic['embark_town'] = titanic['embark_town'].fillna(titanic['embark_town'].mode()[0])

# 결측치 재 확인
titanic.isnull().sum()
>survived       0
pclass         0
sex            0
age            0
sibsp          0
parch          0
fare           0
embarked       0
class          0
who            0
adult_male     0
deck           0
embark_town    0
alive          0
alone          0
dtype: int64
타이타닉호 생존율 분석
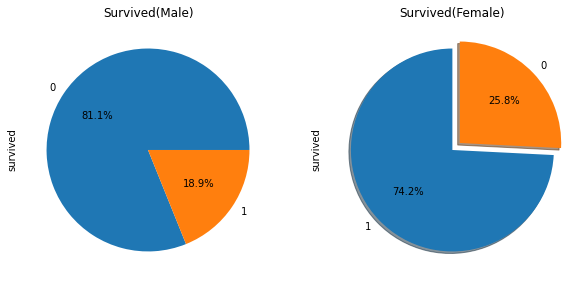
파이 차트 그리기
import matplotlib.pyplot as plt
f, ax = plt.subplots(1,2, figsize=(10,5)) # 10x5 크기에 1행 2열 그래프
titanic['survived'][titanic['sex']=='male'].value_counts().plot.pie(
    autopct='%.1f%%',
    ax=ax[0] # autopct : 자동으로 퍼센트 입력
)
titanic['survived'][titanic['sex']=='female'].value_counts().plot.pie(
    explode=[0,0.1], # 파이차트에서 분리되는 간격 설정
    shadow=True, # 그림자 설정
    autopct='%.1f%%', # autopct : 자동으로 퍼센트 입력
    startangle=90, # 축이 시작되는 각도 설정
    counterclock=True, # True: 시계방향순 , False:반시계방향순
    ax=ax[1]
)
ax[0].set_title('Survived(Male)')
ax[1].set_title('Survived(Female)')
plt.show()
카운트 차트 그리기 - 등급별 생존자 수
import seaborn as sns
sns.countplot(
    'pclass',
    hue='survived', # 색깔에 따른 비교(survived)
    palette='pastel', # 색상 (파스텔 톤)
    data=titanic
)
plt.title('Survived by Pclass')
plt.show()
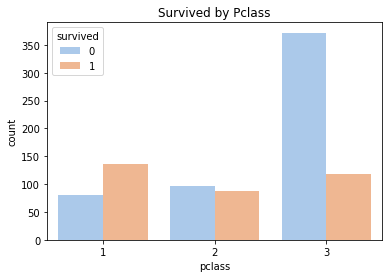
- 3등 선실의 사망자 수가 가장 많다.
- 1등 선실의 생존자 수가 가장 많다.
- 3등 선실의 생존자 수는 2등 선실의 생존자 수보다 많다.(3등 선실에 탑승자가 원래 많기 때문일 수도 있음)
상관 관계 분석
titanic_corr = titanic.corr(method='pearson')
titanic_corr
>	survived	pclass	age	sibsp	parch	fare	adult_male	alone
survived 1.000000	-0.338481	-0.064910	-0.035322	0.081629	0.257307	-0.557080	-0.203367
pclass	-0.338481	1.000000	-0.339898	0.083081	0.018443	-0.549500	0.094035	0.135207
age	-0.064910	-0.339898	1.000000	-0.233296	-0.172482	0.096688	0.247704	0.171647
sibsp	-0.035322	0.083081	-0.233296	1.000000	0.414838	0.159651	-0.253586	-0.584471
parch	0.081629	0.018443	-0.172482	0.414838	1.000000	0.216225	-0.349943	-0.583398
fare	0.257307	-0.549500	0.096688	0.159651	0.216225	1.000000	-0.182024	-0.271832
adult_male -0.557080	0.094035	0.247704	-0.253586	-0.349943	-0.182024	1.000000	0.404744
alone	-0.203367	0.135207	0.171647	-0.584471	-0.583398	-0.271832	0.404744	1.000000

sns.heatmap(titanic_corr,
            annot=True, # 박스안 데이터 값 자동 입력
            vmin=-1,vmax=1, # 최소 최대 색깔 지정
            cmap='RdBu'  # 색깔 테마 선택
       )
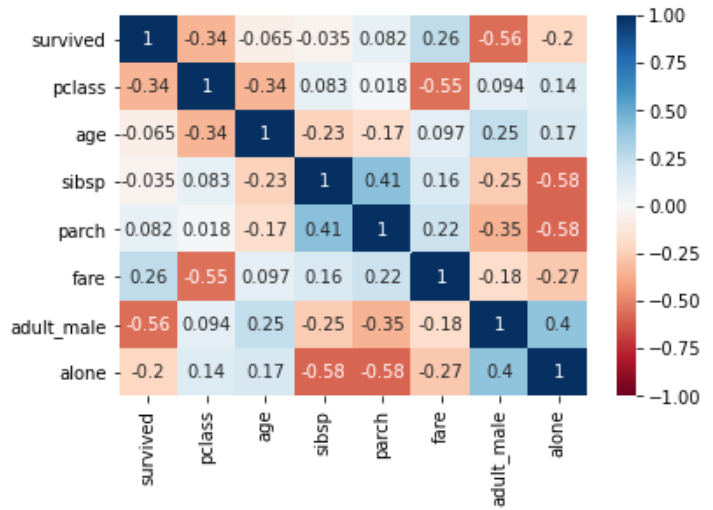
- 숫자가 낮은 등급(1 < 2 < 3) 일수록 생존률이 높다.
- 나이가 어릴수록 생존률이 높다
- 동승한 형제자매와 배우자 수가 적을수록 생존률이 높다.
- 동승한 부모/자식 인원수가 많을수록 생존률이 높다.
- 요금이 높을 수록 생존률이 높다.
- 성인 남성이 아닐수록 생존률이 낮다.
- 동반자 동행하지 않으면 생존률이 높다.
결과 시각화
히트맵 그리기 - 성별 희생자에 대한 Pivot 분석
# 타이타닉 데이터를 원하는 인덱스와 컬럼으로 피벗테이블 생성
titanic = titanic.pivot_table(index='survived',columns='sex',aggfunc='size')
> sex	female	male
class
First	94	122
Second	76	108
Third	144	347

# 새로 정의한 피벗테이블을 활용하여 히트맵 그리기
sns.heatmap(titanic,
            cmap=sns.light_palette('crimson',as_cmap=True),
            annot=True,
            fmt='d', # 정수로 표현
            square=True # 정사각형으로 표현
            )
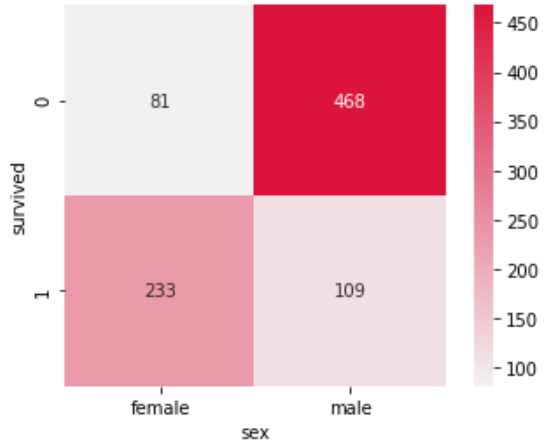
- 성별에 따라 생존률을 비교해보면, 상대적으로 여성의 생존률이 더욱 높은 것을 확인할 수 있다.
다음 시간에는 Opinet 사이트를 활용하여, 각 지역의 주유소 기름 값을 실시간으로 수집하는 작업을 수행하겠다.
