5.1 트리계열 모델로 회귀 예측하기
5.1.1 사이킷런의 분류와 회귀
Cheat sheet
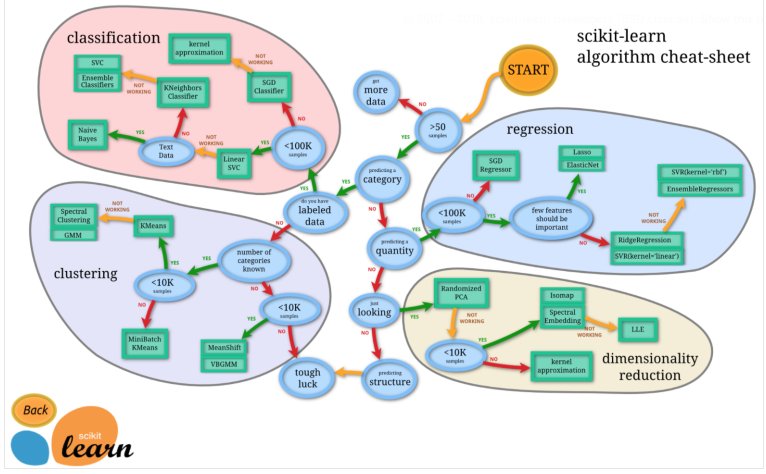
로직을 따라가다 종착지에 있는 모델을 쓰기!
5.1.2 인슐린 수치를 회귀로 예측하기
전처리했던 데이터가 아닌 원본 데이터 사용
import pandas as pd
import numpy as np
import seaborn as sns
import matplotlib.pyplot as plt
df = pd.read_csv('/content/drive/MyDrive/edwith/프로젝트로 배우는 데이터 사이언스/diabetes.csv')
print(df.shape)
df.head()
- 이전엔 당뇨병 발병 여부를 예측하는 Classification Problem, 이번엔 인슐린 수치를 예측하는 Regression Problem
- 전처리한 데이터엔 파생변수도 많았기 때문에 원본을 이용
학습, 예측 데이터셋 나누기
- 0으로 된 값들을 회귀로 예측해 대체해주기
(df.Insulin > 0).value_counts()
- 0 이하인 것들이 374개나 된다. 상당히 많은 수치!
- 결측치 혹은 아예 잘못된 값이기 때문에 올바른 분석을 위해서 대체를 해주는게 맞음!
train = df[df.Insulin > 0].copy()
test = df[df.Insulin <= 0].copy()
train.shape, test.shape
- 0보다 큰 값들은 Trian으로, 이하인 것들은 Test로 넣어주고 shape은 위와 같음
- 0인 것들을 학습에서 제외시키고 제대로 된 데이터셋들로 모델을 생성한 후에 채워줄 것이라 이런 식으로 train / test를 split 함.
- 0인 데이터가 train에 포함된다면 잘못된 데이터를 학습한 결과가 반영되기 때문!! 주의!!
학습/예측에 사용할 컬럼
feature_names = test.columns.tolist()
feature_names.remove('Insulin')
feature_names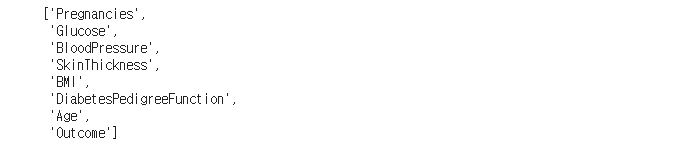
- Insulin을 제외한 나머지가 Feature!
label_name = 'Insulin'학습/예측 데이터셋 나누기
X_train = train[feature_names]
y_train = train[label_name]
X_test = test[feature_names]
y_test = test[label_name]
print('Train set의 shape: {}, {}\nTest set의 shape: {}, {}'.format(X_train.shape, y_train.shape, X_test.shape, y_test.shape))
train과 test의 비율이 거의 1대1. 학습에 사용되는 데이터가 너무 적긴 함.
5.1.3 CV로 모델 검증!
머신러닝 알고리즘 가져오기
from sklearn.tree import DecisionTreeRegressor

model = DecisionTreeRegressor()
model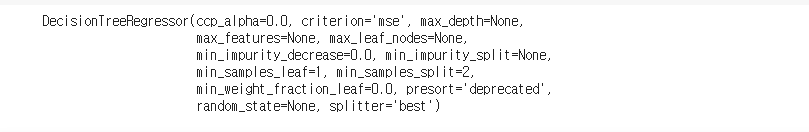
- Tree 기반의 알고리즘을 사용
- Classifier는 정보획득이 높은 쪽으로 분기를 했다면, Regressor는 분산이 작아지는 쪽으로 분기!
model.fit(X_train, y_train)
- Regressor 모델도 훈련시키는 과정은 똑같다.
- 사이킷런 모델의 대부분이 모델을 생성하고 X_train, y_train을 넣어 학습할 때
.fit을 써주면 됨
Cross Validation
- k개의 fold로 나누고 1개는 test set으로 나머지 k-1개는 학습으로 사용하는 것은 동일
- 1개의 test set에 대해 predict한걸 k개를 모아 전체 셋에 대한 예측치를 return!
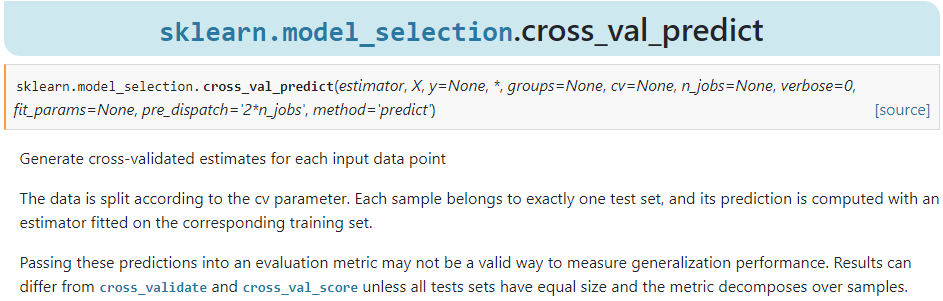
from sklearn.model_selection import cross_val_predict

y_pred = cross_val_predict(model, X_train, y_train, cv = 5, verbose = 2, n_jobs = -1)
y_pred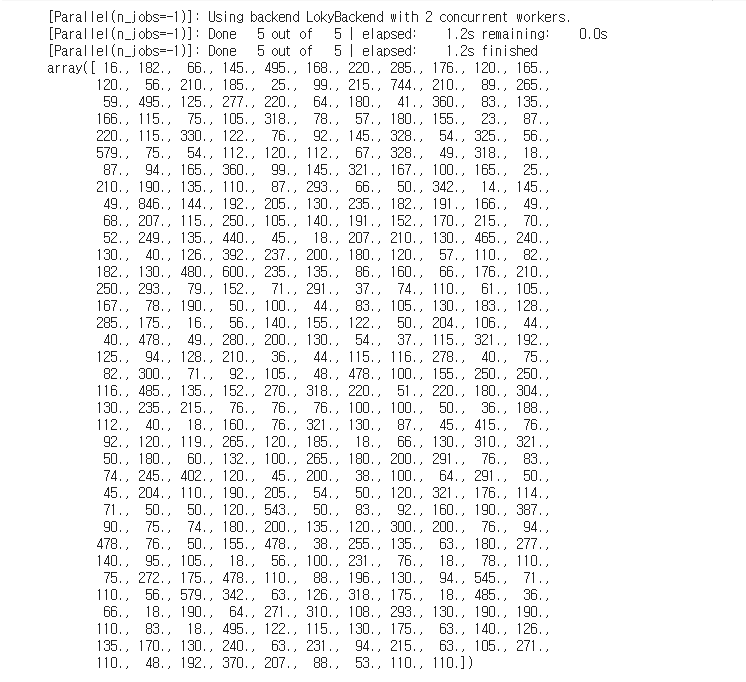
- verbose는 학습되는 로그를 출력할지 말지 결정. 0이 False이기 때문에 0을 넣어주면 출력하지 않는다.
(y_pred == y_train).sum()
- 정답과 제출한 답을 비교해보았다. 정확하게 맞은 개수는 3개. 정답률은 1%도 안된다.
- 수치예측 자체는 0에서 1사이에도 무수히 많은 숫자가 있기 때문에 그걸 맞출 확률은
즉 0에 수렴한다. 따라서 정확히 맞추는 걸 성능의 지표로 보는 것이 아니라
예측치와 실제값의 차이가 얼마나 나는지 즉 오차가 어느정도인지 확인을 해야한다. - 오차에 대한 지표는 여러가지가 있음. MSE, MAE, MAPE, RMSE.... 등등
plt.figure(figsize = (10, 8))
sns.regplot(y_train, y_pred)
plt.show()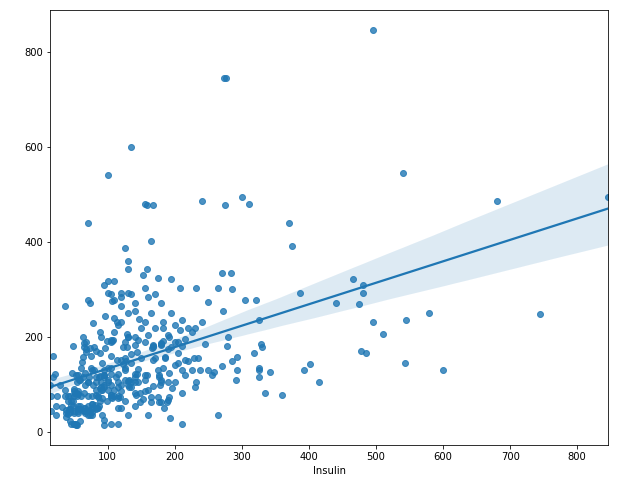
- pred와 정답을 산점도로 시각화 해보았다.
- 점들의 형태가 의 형태라면 굉장히 예측이 잘된 것.
- 회귀선 자체도 의 형태이지도 않고 애초에 산점도를 보면 뚜렷한 경향성이 없어서
제대로 예측한거라고 볼 수 있을지 의문. 수치 예측은 분류 문제처럼 정확하게 맞추는 게 불가능에 가깝기 때문에 앞서말했던 다른 평가지표를 써야함!
R2-score
.
- 전체 변동 중 회귀식으로 설명할 수 있는 변동의 비율을 뜻한다.
- 1에 가깝다면 회귀선이 모든 데이터를 설명이 가능한 것
- 를 성능 지표로도 사용한다.
- 예측이 주 목적이라면 단순보단 를 사용하는 것이 바람직.
- 는 변수를 많이 넣을수록 올라가는 경향이기 때문에 변수의 수도 고려한 를 사용
- 가 높다 낮다의 절대적인 기준은 없음. 산업군마 다르기 때문.
plt.figure(figsize = (10, 8))
sns.distplot(y_train, hist = False, label = 'train')
sns.distplot(y_pred, hist = False, label = 'pred')
plt.legend()
plt.show()
- pred와 정답의 분포를 보면 거의 비슷하다 생각된다. 0~200사이와 200에서 400사이가 조금 다른 것을 빼곤
5.1.4 오차값 MAE, RMSE 구하기
MAE
error = abs(y_train - y_pred)
print('MAE: {}'.format(error.mean()))
- MAE가 84, 평균적으로 84 만큼의 오차가 발생했다는 뜻
sns.distplot(error)
- 절대오차의 분포를 보면 왼쪽으로 skewed된 형태가 좋은 것. Why? 오차가 0에 가까운 것이므로
- 500에 가까운 값들도 존재한다. 인슐린 수치가 500이나 이상? 이게 실제로 발생한다면 사망을 진작해도 이상하지 않은 상태. 이렇듯, 수치예측을 정확하게 하는건 너무 어려운 문제.
- Classification Problem은 이미 괄목할만한 수준이지만, Regression은 어려운 이유가 이러한 문제때문
MSE
- 단순 차이를 보고 합을 하면 -10과 10이 있다면 0으로 되어 겉보기엔 성능이 very good
- 내막은 그렇지 않기 때문에 이 차이를 다 고려하기 위해 위에서처럼 abs를 취해주거나 제곱을 시켜 그 차이의 크기를 그대로 포함시킴
- MSE는 제곱을 평균낸 것이고, MAE는 차이의 절대값의 합이므로 MAE가 좀 더 작아보임
RMSE = np.sqrt((error**2).mean())
print('RMSE: {}'.format(RMSE))
- MAE보다 좀 더 높은 수치를 보임. 값이 더 높을수 밖에 없는건 당연.
- 약간 좀 더 작은 수치를 보여주고 싶다면 MAE나 MAPE등을 사용하길...
- 근본적으로는 같은 것임. 제곱이냐 abs냐 그 차이지
5.1.5 회귀로 학습한 결과를 시각화 하기
회귀 트리 시각화
from sklearn.tree import plot_tree

plt.figure(figsize = (20, 20))
tree = plot_tree(model, feature_names = feature_names, filled = True, fontsize = 10)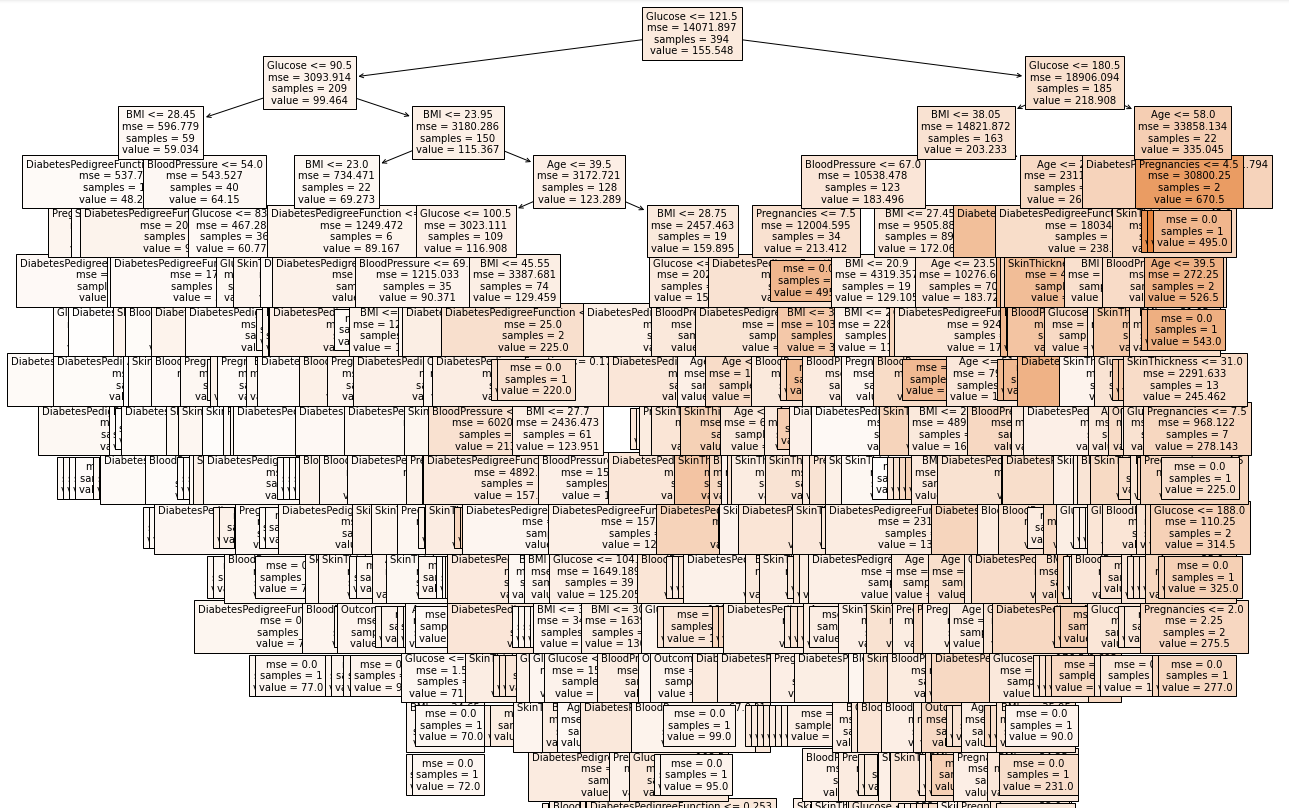
- Regressor Tree의 모형이다. Depth가 상당히 깊어보인다.
- 트리를 그리는 과정에서 메모리를 많이 소모하므로 메모리 크기가 작은 PC에선 오류가 발생가능!
변수 중요도 시각화
plt.figure(figsize = (10, 8))
sns.barplot(x = model.feature_importances_, y = feature_names)
plt.show()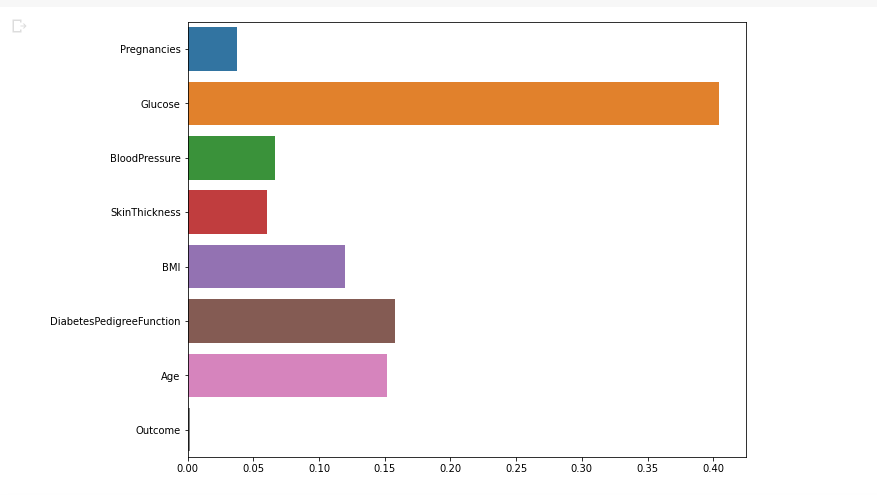
- 전에 Pairplot에서 글루코스와 인슐린의 상관관계가 강해보임을 확인했었다.
- 인슐린을 예측함에 있어 글루코스의 중요도가 높다는 것을 확인.
예측
y_test = model.predict(X_test)
y_test[: 5]
- 인슐린이 0인 값들(잘못된 값들)을 예측했기 때문에 정답은 없으므로 성능 평가는 할 수가 없음.
5.1.6 예측의 결과값 분석하기
결측치를 평균값, 중앙값으로 채워주고 결과 파악
train.groupby('Outcome')['Insulin'].agg(['mean', 'median'])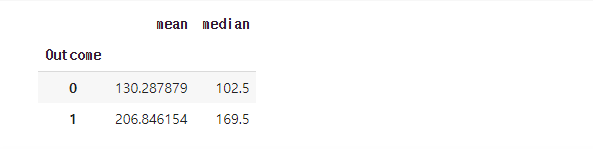
- Outcome이 0인 경우의 인슐린 평균은 130, 중앙값은 102.5
- Outcome이 1인 경우의 인슐린 평균은 206, 중앙값은 169.5
- 당뇨병 환자의 인슐린 수치가 대체적으로 높음
train.groupby('Outcome')['Insulin'].describe()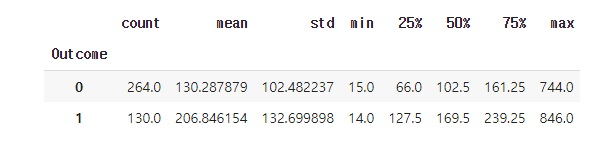
- agg를 쓰지 않고도 통계량들을 확인 가능하다.
plt.figure(figsize = (10, 8))
sns.barplot(data = train, x = 'Outcome', y = 'Insulin')
plt.show()
- 발병 여부에 따른 인슐린 평균 시각화
인슐린 수치가 0인 값들을 예측한 값으로 대체해 줌
test['Insulin'] = y_test
test.groupby('Outcome')['Insulin'].describe()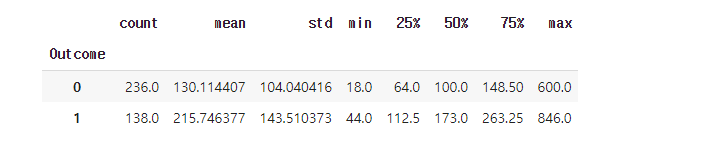
plt.figure(figsize = (10, 8))
sns.barplot(data = test, x = 'Outcome', y = 'Insulin')
plt.show()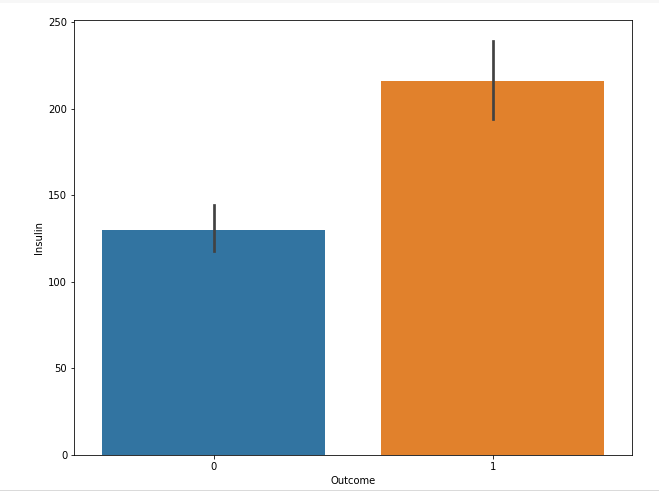
- 대체해준 후 평균값을 비교. train과 test의 평균이 비슷비슷
- train으로 학습한 것으로 test를 예측한 것이라 그럴 수 있음
5.1.7 이상치 제거하기
인슐린이 0인 값의 정답을 모르기 때문에 회귀로 예측
큰 값들 때문에 오버피팅 되거나 좋은 예측을 못할수도 있음
plt.figure(figsize = (10, 8))
sns.distplot(train.Insulin)
plt.show()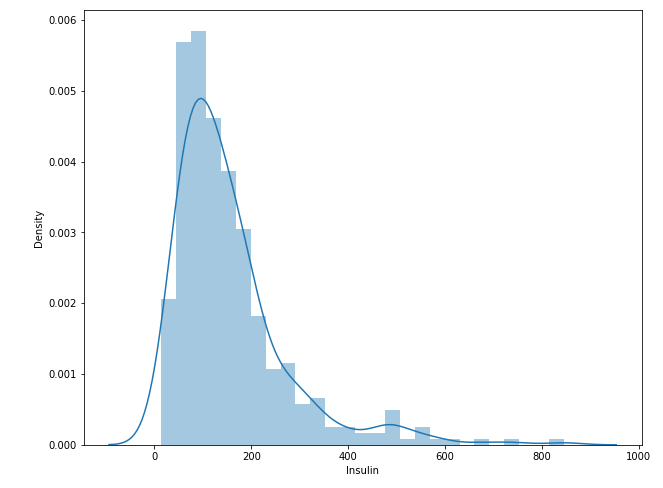
- 인슐린 수치의 distplot. 인슐린이 800을 넘어가는 건 정상일까...?
plt.figure(figsize = (10, 4))
sns.boxplot(train.Insulin)
plt.show()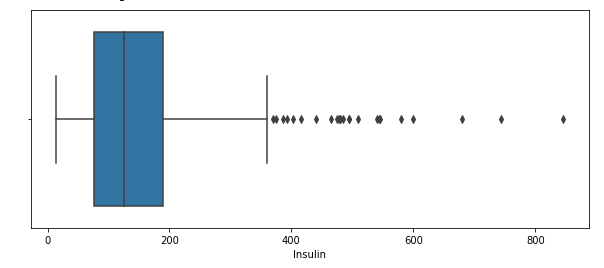
- 300 후반 이후로 whisker가 형성되어 있거 이상치라고 판단되는 값들이 여럿 존재
desc = train.Insulin.describe()
desc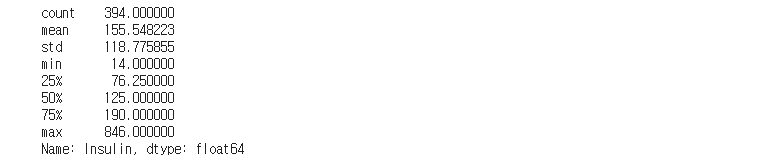
- desc에 인슐린의 기술통계량들을 넣어주고
IQR = desc.loc['75%'] - desc.loc['25%']
OUT = desc.loc['75%'] + 1.5 * IQR
train[train.Insulin > OUT].shape
- Whisker를 벗어나는 수치들이 24개나 된다.
- 이상치를 확인하는 이유는 fit을 시킬 때 잘못된 값을 정답으로 주는 경우가 되는 것이라
확인하고 있는 것이고, 잘못된 답을 가지고 학습하면 잘못된 결과를 초래하기 때문
train = train[train.Insulin < 600]
X_train = train[feature_names]
y_train = train[label_name]
y_pred = cross_val_predict(model, X_train, y_train, cv = 5, verbose = 2, n_jobs = -1)
print('맞은 개수는:', sum(y_pred == y_train))
plt.figure(figsize = (10, 8))
sns.regplot(y_train, y_pred)
plt.show()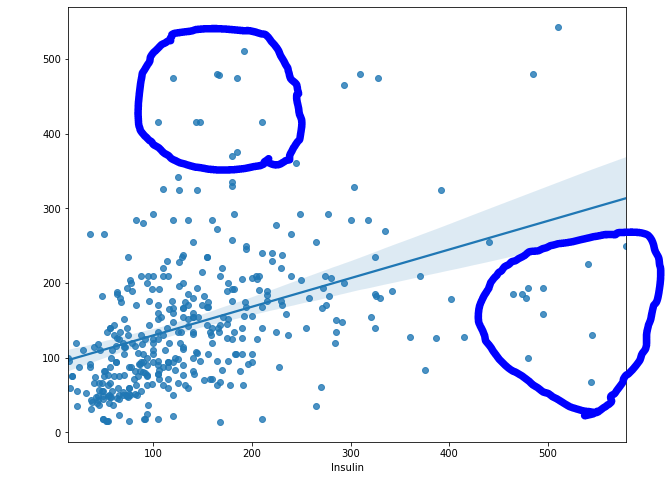
- 동그라미 친 부분들 말고도 제대로 예측이 안된 부분이 많음
- 정답은 500인데 100에 가까운 값으로 예측하거나, 100인데 500 가깝게 예측하거나...
error = abs(y_train - y_pred)
print('MAE:', error.mean())
- 이상치를 제거하기 전 MAE는 84, 제거 후에는 73. 10이 넘게 줄어들었음
- feature의 이상치만 제거하는 것이 아닌 target의 이상치 제거도 필요하다.
- 하지만 통계적인 기준에서의 이상치지 만약 저 값이 실제로 유효한 값이라면 제거할지... 어떻게 할지는 많은 생각을 해봐야 한다. 실제 값이라면 학습을 해야되는 부분이기도 하므로
plt.figure(figsize = (10, 5))
sns.distplot(error)
plt.show()
- 관측치 개별로 보면 500에 가까운 차이가 나는 관측치도 존재
- 평균은 73 정도이지만 개별로 보면 이런 것들이 존재
- 모든 케이스에 대해 잘하면 좋겠지만 보편적으로 괜찮은지 파악을 위해 평균을 보는 것
RMSE = np.sqrt((error**2).mean())
print('600을 넘는 값들을 이상치로 제거한 후의 RMSE:{}'.format(RMSE))
- 전보다 성능이 더 좋아졌음을 알 수 있다.
- 하지만 지금까지 테스트 하는 것은 train set에 대해 5-fold로 나누고 4개의 set을 train하고 1개의 set에 대해 predict한 값들을 총 5개 fold를 모아 train set에 대한 예측치를 만들어 준 것.
- 보통 기존의 성능평가는 train에 대해 학습하고 unseen set인 test에 대해 성능을 평가
- 뭐 같은 로직일 수도 있을것 같긴 함.
- 하지만 5번의 pred에서 사용되는 모델들은 다 다를 것이라서 하나의 모델의 성능이라 보기엔 어렵
통계적 OUTLIER를 모두 제거하고 진행
train = train[train.Insulin < OUT]
X_train = train[feature_names]
y_train = train[label_name]
y_pred = cross_val_predict(model, X_train, y_train, cv = 5, verbose = 2, n_jobs = -1)
print('맞은 개수는:', sum(y_pred == y_train))
- 이전에 비해 정확하게 맞은 개수는 늘어났다.
plt.figure(figsize = (10, 8))
sns.regplot(y_train, y_pred)
plt.show()
- 정답과 예측의 산점도를 보면 너무 분산되어 있다. 과연 정확할까...?
- 600을 이상치 기준으로 잡았을 때와 지금을 비교해보면 x축과 y축의 한계를 보면 더 줄어들었음
- 아마 평균적인 오차의 크기가 줄어들었을 것이라 판단
plt.figure(figsize = (10, 5))
sns.distplot(y_train, label = 'Train', hist = False)
sns.distplot(y_pred, label = 'Predict', hist = False)
plt.legend()
plt.show()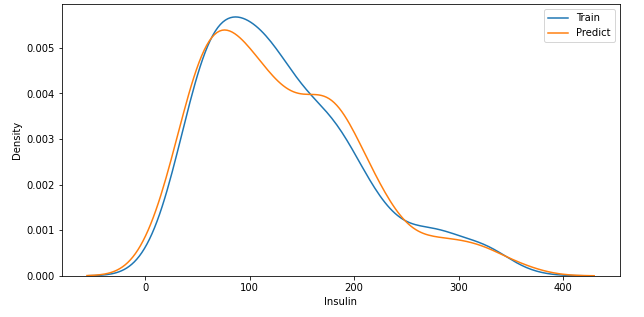
- 정답과 예측의 pdf를 보면 조금 차이나는 부분은 있지만 전체적으로 비슷하다고 생각
error = abs(y_pred - y_train)
mae = error.mean()
rmse = np.sqrt((error**2).mean())
print('Outlier를 모두 제거한 후의 MAE: {}'.format(mae))
print('Outlier를 모두 제거한 후의 RMSE: {}'.format(rmse))
- 확실히 이전보다 오차가 많이 줄어들었음을 알 수 있다.
train.groupby('Outcome')['Insulin'].describe()
결측치를 제거한 데이터 셋으로 학습하고 예측
y_test = model.fit(X_train, y_train).predict(X_test)
test['Insulin'] = y_test
test.groupby('Outcome')['Insulin'].describe()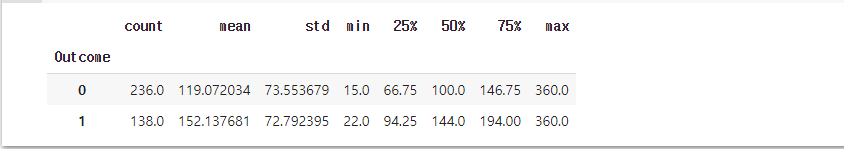
- 이상치를 제거한 셋으로 학습한 모델로 예측한 결과가 전에 비해 좀 더 안정적이라는 생각이 든다.
- 안정적이란 분산이 작음을 뜻함
변수 중요도 파악
plt.figure(figsize = (10, 8))
sns.barplot(x = model.feature_importances_, y = feature_names)
plt.show()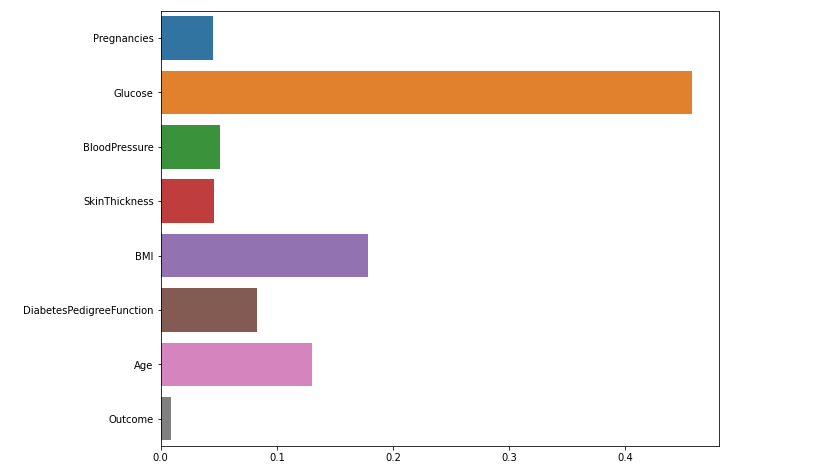
- 글루코스가 역시 중요한 변수이다.
- 이렇게 예측한 값으로 인슐린의 이상한 값들을 대체해주고 Outcome에 대해 Classification 문제를 해결해도 된다. 이상치나 결측치 그리고 노이즈들을 채워주는 것은 단순 통계량 값 뿐만이 아니라 회귀를 통해 대체해줘도 됨!
5.1.8 RandomizedSearchCV로 최적 파라미터 찾기
from sklearn.model_selection import RandomizedSearchCV

max_depth = np.random.randint(5, 30, 10)
max_features = np.random.uniform(.3, 1., 10)
param_distributions = {'max_depth': max_depth, 'max_features': max_features}
regressor = RandomizedSearchCV(model, param_distributions, random_state = 42,
				n_iter = 10, scoring = None, cv = 5, verbose = 2)
regressor.fit(X_train, y_train)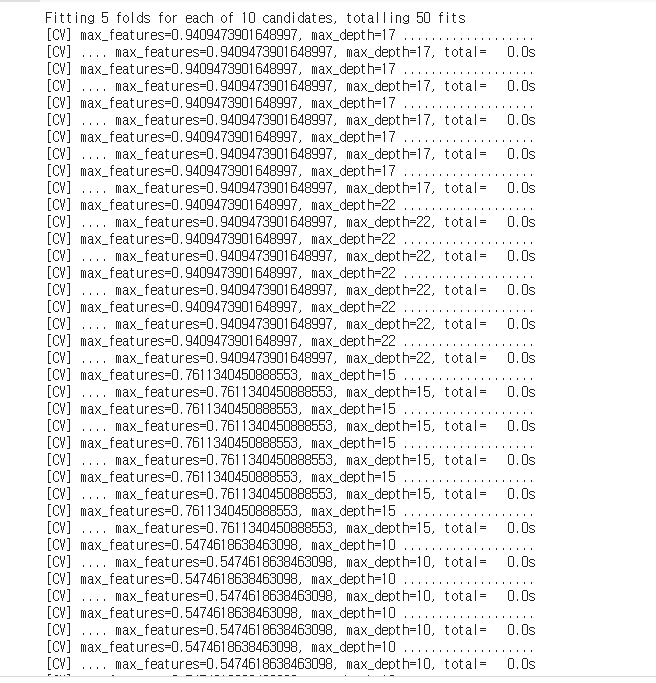
- 전체 가능한 파라미터의 조합은 10개 * 10개 총 100개
- n_iter가 10이므로 100개 중 10개를 샘플링해서 5-fold CV를 하는 것!
- result를 보면 하나의 조합에 대해 5번 학습하는게 보임!
regressor.best_estimator_
- 가장 성능이 좋았던 트리 모델의 정보
regressor.best_score_
- 아마 리턴하는 스코어가 값이라 생각.
- 였고 만약 SSR이 SST보다 크다면 음수가 나올 수 있는 상황
- 인데 어떻게 제곱값이 음수가 나올까?라고 생각할 수 있음
- 학부때 기억을 더듬어보면 모든 예측값을 평균으로 대체하는 것보다 Underperform 하게 되는 경우 SSR이 SST보다 높게된다고 들었음
- 이런 경우 SSR/SST는 1보다 커지게 되어 음수가 나오는 것
- 리턴하는 스코어가 뭔진 모르겠지만 R2가 맞다면 단순 평균으로 쭉 예측하는게 더 나은상황
- 제곱 값이 음수가 되는건 복소수 같은 경우에 가능. 수학적으로 말이 안되는 상황이지만 여기에 꽂히지말고 해석에 의미를 두라 하셨었음
사이킷런의 모델들은 성능을 평가하는 수치가 크면 좋다고 인식한다.
하지만 mae같은 지표들은 작으면 작을수록 좋다. 0.3이 10보다 좋은 거지만
모델은 10이 더 좋다고 인식할수도 있는 것
그래서 성능 평가 지표에 -를 취해준 negative mae같은 것을 지표로 사용한다.
그렇게 되면 -0.3이 -10보다 큰 거라 0.3이 더 좋다고 인식하고 실제로도 그게 맞기 때문!
이 리턴된 값도 negative R2 Score일수도
regressor.cv_results_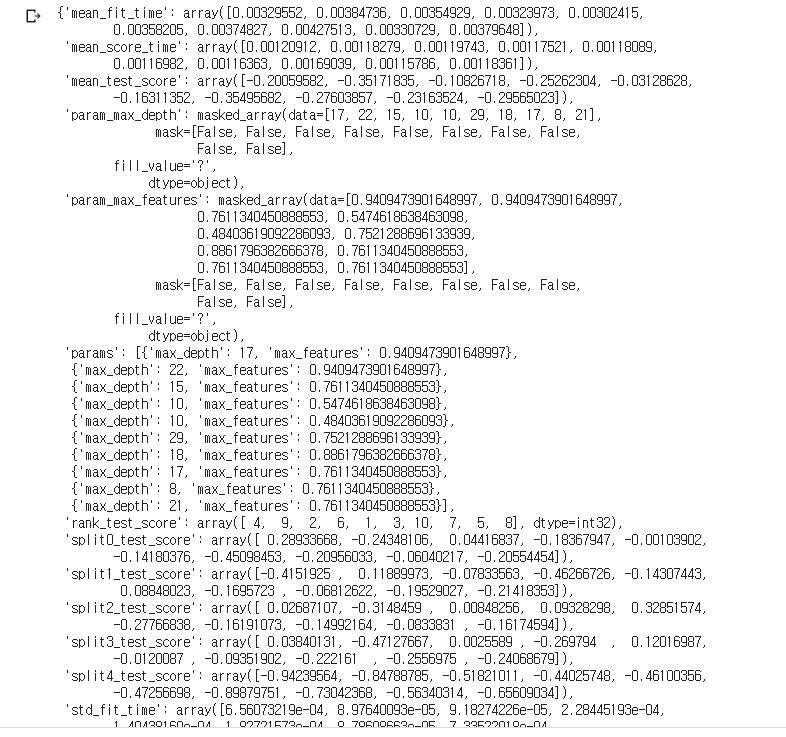
- 모델이 학습이 끝난 후 과정의 결과들이 담긴 딕셔너리
- 이를 보고 모델의 학습 과정에 대해 파악이 가능
5.1.9 RandomizedSearchCV로 최적의 모델 찾기
다양한 모델 중 최적의 모델을 찾아줌
from sklearn.ensemble import RandomForestRegressor, GradientBoostingRegressor

estimators = [DecisionTreeRegressor(random_state = 42),
              RandomForestRegressor(random_state = 42),
              GradientBoostingRegressor(random_state = 42)]
estimators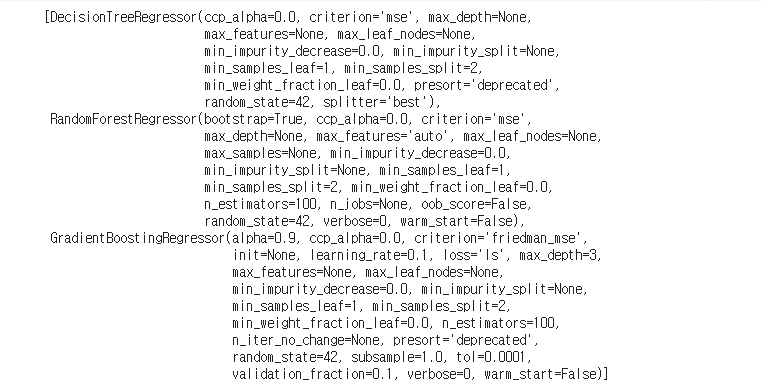
- seed만 똑같이 주고 나머진 디폴트인 모델 생성
results = []
for estimator in estimators:
    result = estimator.__class__.__name__
    results.append(result)
pd.DataFrame(results)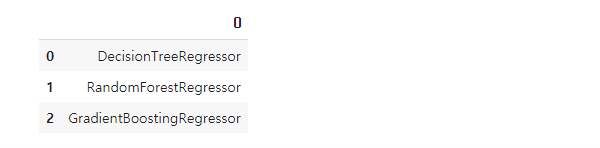
- 모델의 명을 results에 담아주고
results = []
for estimator in estimators:
    result = []
    max_detph = np.random.randint(5, 30, 10)
    max_features = np.random.uniform(0.3, 1.0, 10)
    param_distributions = {'max_depth': max_detph, 'max_features': max_features}
    if estimator.__class__.__name__ != 'DecisionTreeRegressor':
        n_estimators = np.random.randint(100, 500, 10)
        param_distributions['n_estimators'] = n_estimators
    regressor = RandomizedSearchCV(estimator, param_distributions, n_iter = 10,
                                   cv = 5, verbose = 2, random_state = 42)
    regressor.fit(X_train, y_train)

    result.append(estimator.__class__.__name__) ## 모델 명
    result.append(regressor.best_params_) ## 최적 파라미터
    result.append(regressor.best_estimator_) ## 최적 모델
    result.append(regressor.best_score_) ## 최적 모델의 평균 점수
    result.append(regressor.cv_results_) ## 학습 과정에 대한 Info

    results.append(result) ## 종합적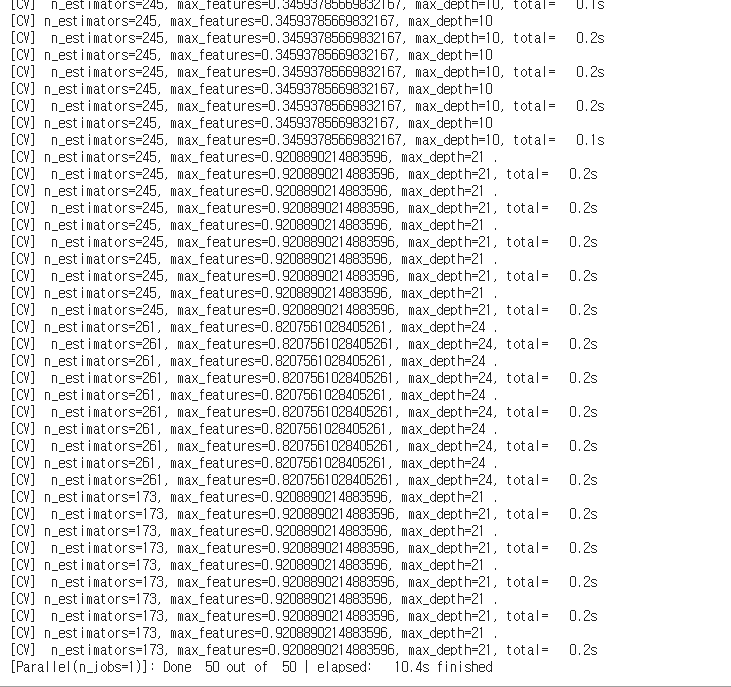
- 3개 모델의 10개 조합 그리고 5번씩 학습 총 150번의 train이 진행
df_cv = pd.DataFrame(results)
df_cv.columns = ['model', 'params', 'estimator', 'score', 'cv_result']
df_cv
- cv의 result를 활용해 만든 데이터 프레임
- score값에 의하면 RF가 가장 좋음을 알 수 있다.
best_estimator = df_cv.loc[1, 'estimator']
best_estimator
- 가장 성능이 좋았던 랜덤포레스트의 best estimator를 최적 모델로 넣어줌
best_estimator.fit(X_train, y_train)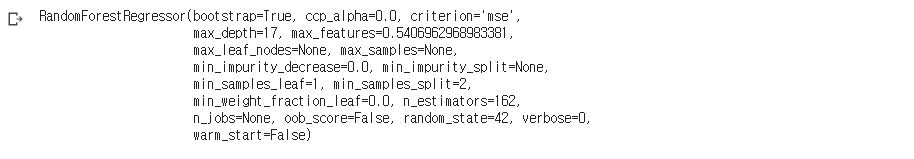
- 교차검증을 통해 최적의 파라미터 모델을 찾은 것이었음
- 이 setting으로 전체 데이터에 대해 학습
CV의 과정
- Train/Test split
- Train을 Grid or Random Search로 최적의 파라미터 조합의 모델 도출
- k-1개의 fold로 학습한 결과이므로 도출한 모델에 k개 set 즉 전체 data를 학습시킴
- 학습된 모델이 최종 모델이고 이걸 이용해서 test로 최종 성능평가를 하는 것!
from sklearn.model_selection import cross_val_predict
y_predict = cross_val_predict(best_estimator, X_train, y_train, cv = 5, verbose = 2, n_jobs = -1)
y_predict[:5]
- best_estimator엔 최적 파라미터 조합으로 전체 train set에 학습시킨 최종 모델이 들어있음
- 이 모델로 cross_val_predict를 하고 train set 전체 성능에 대해 평가
plt.figure(figsize = (10, 8))
sns.regplot(y_train, y_predict)
plt.show()
- 이전보다 더 회귀선을 기준으로 모여있다고 판단됨
from sklearn.metrics import r2_score
r2_score(y_train, y_predict)
- 값은 0.35로 전보다 더 나은 결과
plt.figure(figsize = (10, 8))
sns.distplot(y_train, hist = False, label = 'train')
sns.distplot(y_predict, hist = False, label = 'pred')
plt.legend()
plt.show()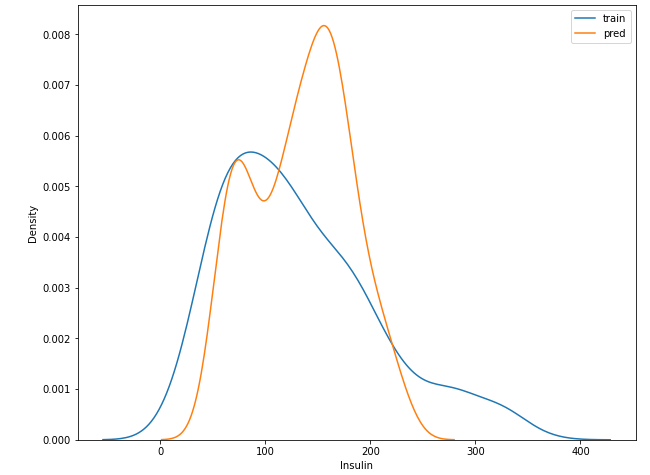
- 예측값과 실제 값의 분포가 좀 다르게 생성
- 하지만 기존 모델들에 비해 인슐린의 scale이 많이 작아졌음
- 좀 더 예측하는 값이 scale down 된 것
error = abs(y_train - y_predict)
mae = error.mean()
rmse = np.sqrt((error**2).mean())
print('MAE: {}, RMSE: {}'.format(mae, rmse))
- mae, rmse 값이 훨씬 좋아졌다.
- 과연 진짜 좋아진 것일까?
- 만약 도출된 최적 파라미터 조합의 모델로 cross_val_predict를 했다면 모르겠지만
이 모델에 train 전체를 학습 시킨 것을 최종 모델로 train set에 대해 cross_val_predict를 한 것
즉 모의고사를 답지와 함께 풀어보고 다시 모의고사를 풀어본 것. - 따라서 좋아진 것이 Overfitting이 된 것이라 판단됨
y_test = best_estimator.predict(X_test)
test['Insulin'] = y_test
test.groupby('Outcome')['Insulin'].describe()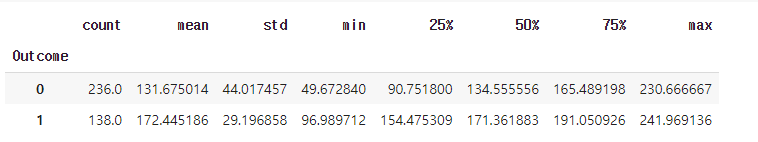
- 전보다 더 스케일이 다운된 것을 확인. 좀 더 안정적
plt.figure(figsize = (10, 8))
sns.barplot(x = best_estimator.feature_importances_, y = feature_names)
plt.show()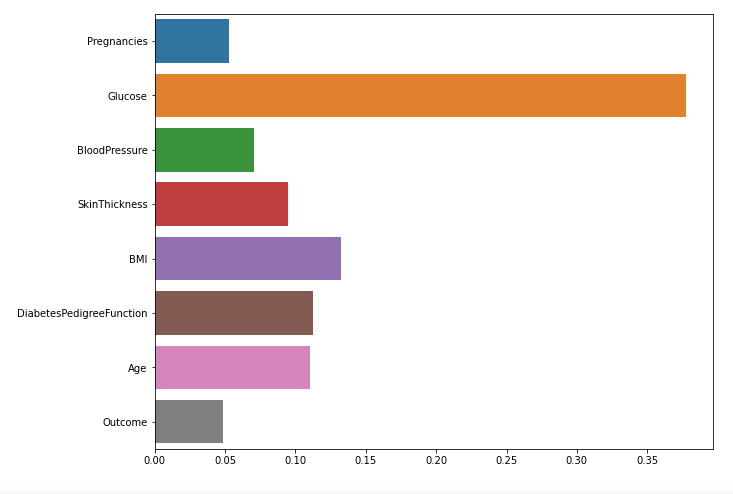
- 역시 글루코스의 영향력이 가장 크다.
- 애초에 상관관계가 상대적으로 강했기 때문
아무튼 이 모델은 Best라고 단정짓기엔 무리. train을 학습하고 train에 대해 성능 평가했으므로(교차검증이라 하더라도)
5.1.10 예측결과 csv파일로 저장
회귀로 예측한 수치를 dataset에 넣어줌!
df.loc[df['Insulin'] == 0, 'Insulin'] = test['Insulin']
## 현재 작업공간에 df를 diabets_fill_insulin이란 이름으로 저장
df.to_csv('diabets_fill_insulin.csv', index = False)
pd.read_csv('diabets_fill_insulin.csv')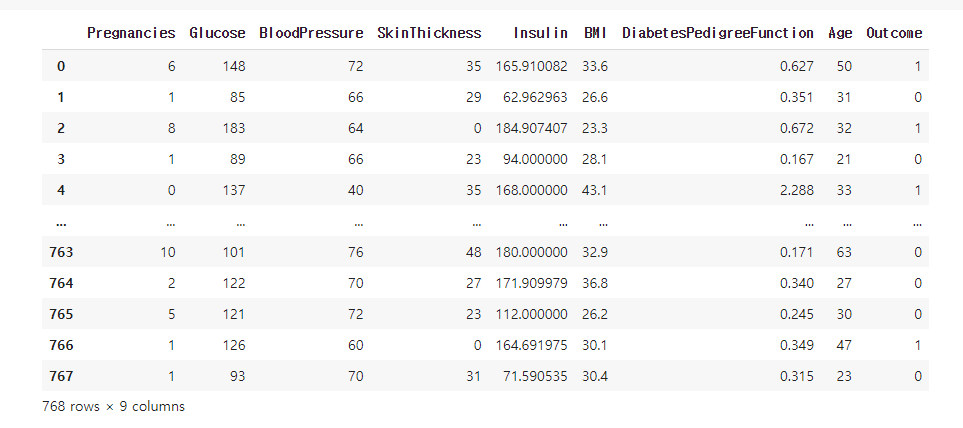

Data science