Bike Sharing Demand
점수 평가 기준 : RMSLE대회 이름에 demand가 들어가면 대부분 수요예측 문제이다.
Data Fields(컬럼 설명)
datetime- hourly date + timestamp ▶️시간season- 1 = spring, 2 = summer, 3 = fall, 4 = winter ▶️계절별 1,2,3,4로 ordinal encoding(순서가 있는 값)
holiday- whether the day is considered a holiday ▶️공휴일, 휴일
workingday- whether the day is neither a weekend nor holiday ▶️공휴일이나 휴일이 아니다
weather
1: Clear, Few clouds, Partly cloudy, Partly cloudy ▶️맑은 날
2: Mist + Cloudy, Mist + Broken clouds, Mist + Few clouds, Mist ▶️흐린날
3: Light Snow, Light Rain + Thunderstorm + Scattered clouds, Light Rain + Scattered clouds ▶️눈비
4: Heavy Rain + Ice Pallets + Thunderstorm + Mist, Snow + Fog ▶️폭우, 폭설, 우박
temp- temperature in Celsius ▶️기온
atemp- "feels like" temperature in Celsius ▶️체감온도
humidity- relative humidity ▶️습도
windspeed- wind speed ▶️풍속
casual- number of non-registered user rentals initiated ▶️비회원이용자
registered- number of registered user rentals initiated ▶️회원이용자
count- number of total rentals ▶️총대여수
EDA 해야한다.
train.info()
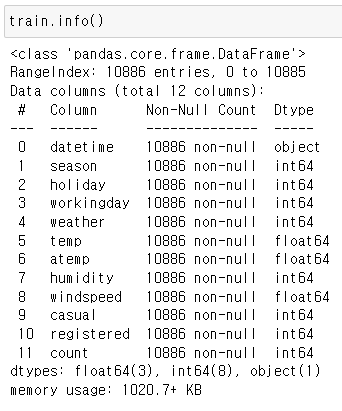
info 결과만 보면 결측치도 없어보이고, datetime을 제외하고는 전부 수치형 같다.
train.describe()
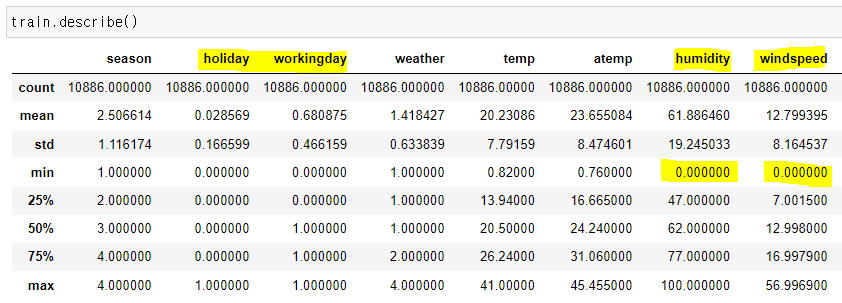
holiday와workingday의 값은 0과 1밖에 없다.- 습도와 풍속의 최소값이 0 이 나왔는데 이게 가능한 수치가 아니다. (이래서 domain 지식이 필요함!)
연월시분초 파생변수 만들고
train["datetime"] = pd.to_datetime(train["datetime"])
train["year"] = train["datetime"].dt.year
train["month"] = train["datetime"].dt.month
train["day"] = train["datetime"].dt.day
train["hour"] = train["datetime"].dt.hour
train["minute"] = train["datetime"].dt.minute
train["second"] = train["datetime"].dt.second
histogram 그려보기
train.hist(figsize=(12, 10), bins=50);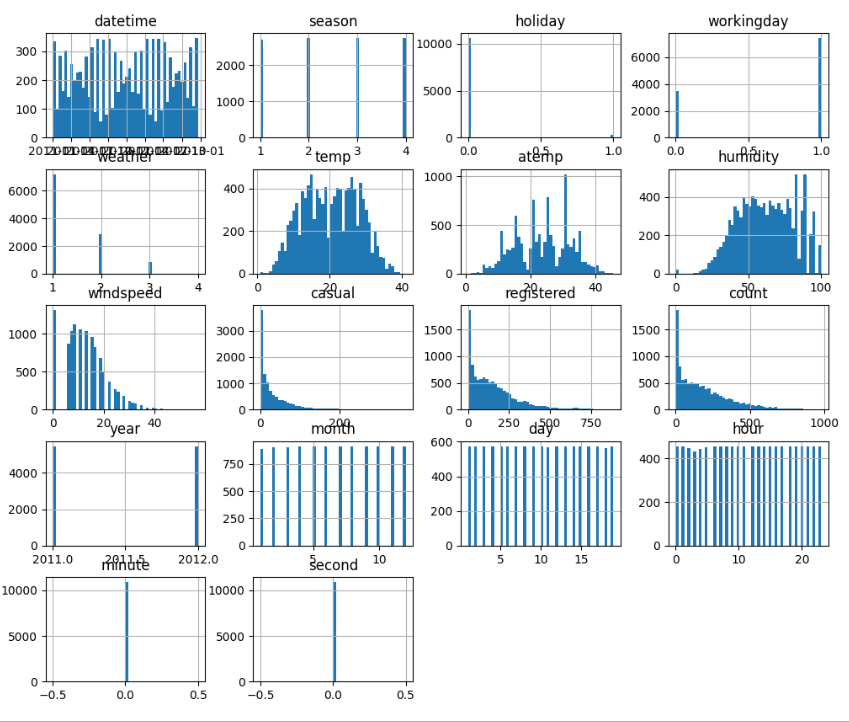
- 시각화해보니 수치형데이터와 범주형 데이터가 딱 나뉜다.
- 숫자로 되어있지만, season, holiday, workingday, weather 는 범주형데이터이다.
시각화
sns.scatterplot(data=train, x="windspeed", y="count")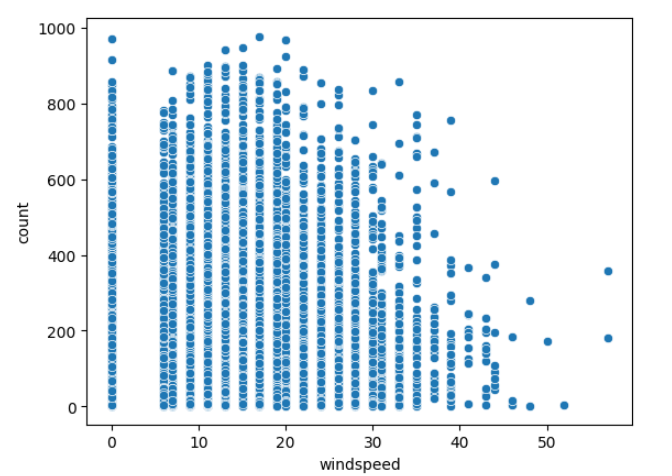
- 풍속 데이터는 연속된 데이터가 아니라 구간이 나뉘어진 데이터 같다.
- 풍속이 0 인것은 결측치라는 것을 시각화로 더 잘 확인 할 수 있다.
sns.scatterplot(data=train, x="temp", y="atemp")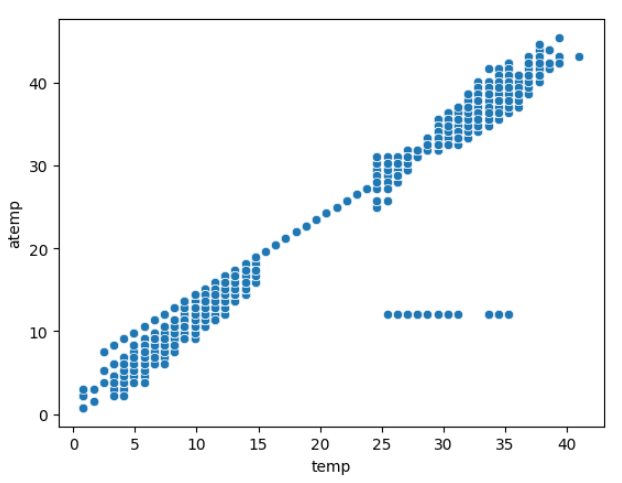
- temp-atemp 데이터에 이상치가 있다!
mask = np.zeros_like(train.corr())
mask[np.triu_indices_from(mask)] = True
plt.subplots(figsize=(16, 8))
sns.heatmap(train.corr(), cmap="Greens", mask = mask, annot=True)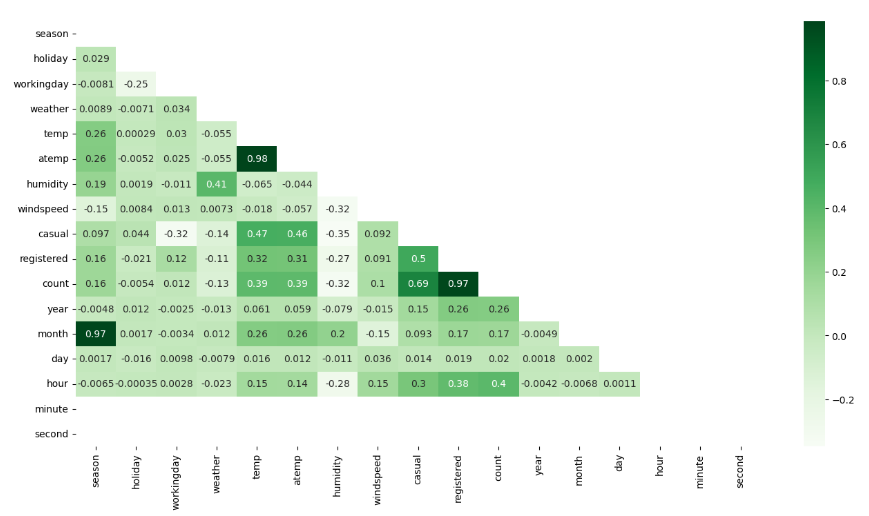
- heatmap 을 보면, 분과 초는 거의 아무런 영향을 미치지 않는다.
- holiday 도 큰 의미 없는 것 같다.
fig, axes = plt.subplots(1, 2, figsize=(12,6))
_ = sns.barplot(data=train, x="holiday", y="count", estimator=sum, ax = axes[0], ci = None)
_ = sns.barplot(data=train, x="workingday", y="count", estimator=sum, ax = axes[1], ci = None)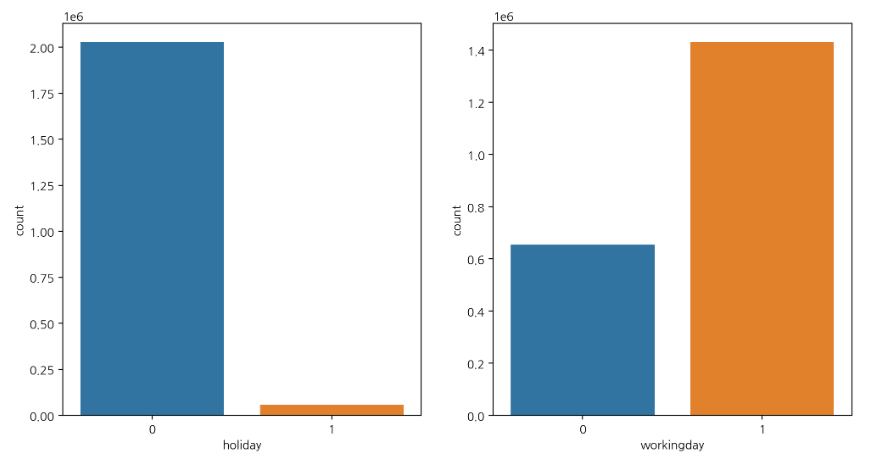
이외에도 시각화를 통해 알게 된 것
- day 는 1일1부터 19일 까지 밖에 데이터가 없다. -> 즉 분석에 도움이 안되는 feature
- 월과, 연월 feature 는 의미가 있어 보인다.
- 날씨4 (폭우,폭설)은 데이터는 1개인데, count 값이 많다.
- working day 가 아니라고 holiday 인 것은 아니다.