
🛣️ How To ?
차선 인식에 널리 사용되는 방식은 traditional vision 방식과 Deep learning을 활용한 방식 크게 2가지로 나뉜다.
traditional vision 방식에는 Edge 검출 방식과 허프 변환(Hough Transform) 방식 두 가지가 있다.
각 방식에는 장단점이 있을 텐데, 요 포스팅에서는 edge detector를 통한 lane detection을 구현해보고자 한다.
Edge란 ?
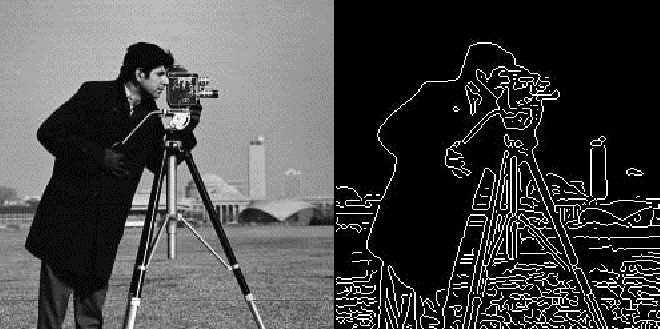
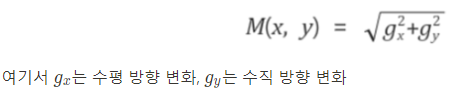
pixel 값이 한 쪽으로 급격히 변하는부분(어둡다가 밝아지거나, 밝다가 어두워지는) 사물과 사물, 사물과 배경의 경계선- edge를 찾기 위해서는 픽셀값의 변화율을 측정하는데, 2차원 공간에서는 x축 방향과 y축 방향의 편미분을 모두 사용해야 한다.
- gradient의 크기가 특정 값보다 큰 위치를 찾아 edge를 검출하는데, edge 여부를 판단하기 위해 기준이 되는 값을 threshold(임계치)라 한다. 임계치를 높게 설정하면 밝기 차이가 급격히 변하는 pixel만 edge로 검출되고, 임계치를 낮게 설정하면 약한 edge도 검출된다.
import numpy as np
import cv2
from PIL import Image
import matplotlib.pyplot as plt
import matplotlib.image as mpimg
from skimage import exposure
import warnings
warnings.filterwarnings('ignore')

cap = cv2.VideoCapture('./data/3.mp4')
ret, frame = cap.read()

# 0. undistort
# correct distortion using calibration
# undist_img = undistort(frame, mtx, dist)

# 1. resizing
frame = cv2.resize(frame, None, fx=0.5, fy=0.5, interpolation=cv2.INTER_AREA)

height, width = frame.shape[:2]
print(frame.shape[:2])
# 2. gradient combine
# Find lane lines with gradient information of Red channel
temp = frame[220:height-12, :width, 2]
plt.imshow(cv2.cvtColor(temp, cv2.COLOR_BGR2RGB))
# frame[220:height-12, :width, 2]
# setting thresholds (hls, sobel)
th_h, th_l, th_s = (160, 255), (50, 160), (0, 255)
th_sobelx, th_sobely, th_mag, th_dir = (35, 100), (30, 255), (30, 255), (0.7, 1.3)
Sobel Filter

- 대부분의 영상은 noise를 포함하기 때문에, 1x3이나 3x1같은 마스크는 결과가 좋지 않다. 따라서 잡음의 영향을 줄이기 위해 큰 크기의 마스크를 사용한다.
- sobel filter는 가장 널리 사용되는 미분 마스크로, 3x3 커널을 사용하여 영상의 가로 방향(x축)과 세로 방향(y축)으로 미분한다.
def sobel_xy(img, orient='x', thresh=(20, 100)):
    """
    Define a function that applies Sobel x or y.
    The gradient in the x-direction emphasizes edges closer to vertical.
    The gradient in the y-direction emphasizes edges closer to horizontal.
    """

    if orient == 'x':
        # dx=1, dy=0이면 x 방향의 편미분
        abs_sobel = np.absolute(cv2.Sobel(img, cv2.CV_64F, 1, 0))
    """
    cv2.Sobel(src, ddepth, dx, dy, dst=None, ksize=None, scale=None,
    delta=None, borderType=None)
    --------------------------------------------------------------
    * parameters
    src : 입력
    ddepth : 출력 데이터 타입(-1이면 입력과 동일한 데이터 타입)
    dx : x방향 미분의 차수
    dy : y방향 미분의 차수
    dst : 출력
    ksize : 커널 크기(default 3)
    scale : 연산 결과에 추가로 곱할 값(default 1)
    delta : 연산 결과에 추가로 더할 값(default 0)
    borderType : 가장자리 픽셀 확장 방식(default cv2.BORDER_DEFAULT)
    """

    if orient == 'y':
        # dx=0, dy=1이면 y 방향의 편미분
        abs_sobel = np.absolute(cv2.Sobel(img, cv2.CV_64F, 0, 1))
    # Rescale back to 8 bit integer
    scaled_sobel = np.uint8(255*abs_sobel/np.max(abs_sobel))
    binary_output = np.zeros_like(scaled_sobel)
    binary_output[(scaled_sobel >= thresh[0]) & (scaled_sobel <= thresh[1])] = 255

    # Return the result
return binary_output- x축 방향 편미분(x축 sobel filter)
- 스케일러 미적용
# sobel filter X
th_sobelx = (35, 100)
sobel_x = sobel_xy(temp, 'x', th_sobelx)
plt.imshow(cv2.cvtColor(sobel_x, cv2.COLOR_BGR2RGB))
- 스케일러 적용
img = frame[220:height-12, :width, 2]
abs_sobel = np.absolute(cv2.Sobel(img, cv2.CV_64F, 1, 0))
scaled_sobel = np.uint8(255*abs_sobel/np.max(abs_sobel))
sobel_x = np.zeros_like(scaled_sobel)

th_sobelx = (35, 100)
sobel_x[(scaled_sobel >= th_sobelx[0]) & (scaled_sobel <= th_sobelx[1])] = 255
plt.imshow(sobel_x)

- y축 방향 편미분(y축 sobel filter)
- 스케일러 미적용
# sobel filter Y
sobel_y = sobel_xy(temp, 'y', th_sobely)
plt.imshow(cv2.cvtColor(sobel_y, cv2.COLOR_BGR2RGB))
- 스케일러 적용
img = frame[220:height-12, :width, 2]
abs_sobel = np.absolute(cv2.Sobel(img, cv2.CV_64F, 0, 1))

th_sobely = (30, 255)
scaled_sobel = np.uint8(255*abs_sobel/np.max(abs_sobel))
sobel_y = np.zeros_like(scaled_sobel)
sobel_y[(scaled_sobel >= th_sobely[0]) & (scaled_sobel <= th_sobely[1])] = 255

plt.imshow(sobel_y)

Gradient
- 다차원 인자(x, y)에 대한 편미분을 하면 미분값도 다차원이 되며, 이를 그래프로 나타낼 시 마치 다차원적 경사처럼 표현된다.
- 2차원 공간에 정의된 함수 f(x, y)가 있을 때, 함수의 x축 방향 미분과 y축 방향 미분을 한꺼번에 벡터로 표현한 것을 gradient라 한다.
- 그래디언트 크기(gradient magnitude) 구하기
# gradient magnitude is used to measure how strong the change in image intensity is

# Take both Sobel x and y gradients
sobelx = cv2.Sobel(img, cv2.CV_64F, 1, 0, ksize=3)
sobely = cv2.Sobel(img, cv2.CV_64F, 0, 1, ksize=3)

# Calculate the gradient magnitude
gradmag = np.sqrt(sobelx**2 + sobely**2)

# Rescale to 8 bit
scale_factor = np.max(gradmag)/255
gradmag = (gradmag/scale_factor).astype(np.uint8)

th_mag = (30, 255)

gradient_magnitude = np.zeros_like(gradmag)
gradient_magnitude[(gradmag >= th_mag[0]) & (gradmag <= th_mag[1])] = 255
plt.imshow(gradient_magnitude)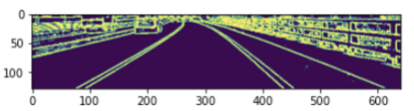
- 그레디언트 방향(gradient direction) 구하기
# Calculate the x and y gradients
sobelx = cv2.Sobel(img, cv2.CV_64F, 1, 0, ksize=15)
sobely = cv2.Sobel(img, cv2.CV_64F, 0, 1, ksize=15)

# Take the absolute value of the gradient direction,
# apply a threshold, and create a binary image result
absgraddir = np.arctan2(np.absolute(sobely), np.absolute(sobelx))
gradient_direction = np.zeros_like(absgraddir)

th_dir = (0.7, 1.3)
gradient_direction[(absgraddir >= th_dir[0]) & (absgraddir <= th_dir[1])] = 255
gradient_direction = gradient_direction.astype(np.uint8)
plt.imshow(gradient_direction)
- combine gradient measurement
grad_combine = np.zeros_like(gradient_direction).astype(np.uint8)
grad_combine[((sobel_x > 1) & (gradient_magnitude > 1) & (gradient_direction > 1)) | ((sobel_x > 1) & (sobel_y > 1))] = 255
plt.imshow(grad_combine)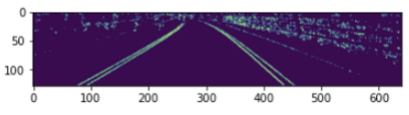
HSL combine

▶HSL(Hue, Saturation, Lightness) 색공간 :
① 색상(Hue) : 색상 값 H는 가시광선 스펙트럼을 고리모양으로 배치한 색상환에서 가장 파장이 긴 빨강을 0°로 하였을 때 상대적인 배치 각도를 의미한다. 때문에 H 값은 0°~ 360°의 범위를 갖고 360°와 0°는 같은 색상 빨강을 가리킨다.
② 채도(Saturation) : 채도 값 S는 특정한 색상의 가장 진한(순수한) 상태를 100%로 하였을 때 진한 정도를 나타낸다. 채도 값 0%는 같은 명도의 무채색을 나타낸다.
③ 명도(Lightness) : 밝은 정도(명도)를 나타내는 단위인데, 가장 밝은 색인 하양(White)을 1.0 위치(100%)에,
가장 어두운 색인 검정(Black)을 0.0 위치(0%)에 놓고, 다른 모든 색들의 밝기는 이 하양과 검정 사이에 존재하게 된다.
hls = cv2.cvtColor(frame, cv2.COLOR_BGR2HLS)
height, width = frame.shape[:2]
_, img = cv2.threshold(frame, 180, 255, cv2.THRESH_BINARY)

H = hls[220:height - 12, 0:width, 0] # get Hue channel (색상)
L = hls[220:height - 12, 0:width, 1] # get Light channel (밝기)
S = hls[220:height - 12, 0:width, 2] # get Saturation channel (채도)-
H channel
h_img = np.zeros_like(H)
h_img[(H > th_h[0]) & (H <= th_h[1])] = 255
plt.imshow(h_img)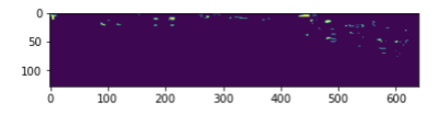
-
L channel
l_img = np.zeros_like(L)
l_img[(L > th_l[0]) & (L <= th_l[1])] = 255
plt.imshow(l_img)
-
S channel
s_img = np.zeros_like(S)
s_img[(S > th_s[0]) & (S <= th_s[1])] = 255
plt.imshow(s_img)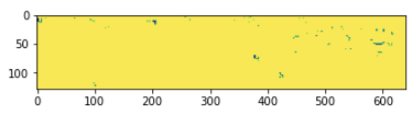
-
combine result
    # Two cases - lane lines in shadow or not
hls_combine = np.zeros_like(s_img).astype(np.uint8)
hls_combine[((s_img > 1) & (l_img == 0)) | ((s_img == 0) & (h_img > 1) & (l_img > 1))] = 255
plt.imshow(hls_combine)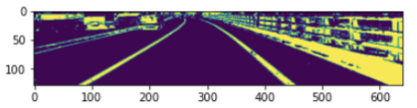
Warp image with Perspective Transform
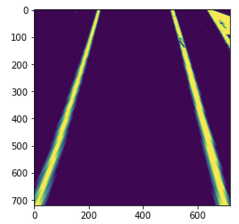
- perspective transform(원근 변환)
cv2.getPerspectiveTransform()에서는 변환할 좌표(src)와 변환 후 좌표(dst)를 지정하면 원근 변환에 필요한 매트릭스를 연산하여 제공한다. 연산된 매트릭스와 이미지는warpPerspective()에서 원근 변환을 적용한다.src = np.float32([[250, 220], [350, 220], [500, 320], [100, 320] ]) dst = np.float32([[0, 0], [width, 0], [width, height], [0, height]])height, width = result.shape[:2] print(height, width) s_LTop2, s_RTop2 = [270, 40], [310, 40] s_LBot2, s_RBot2 = [100, height], [450, height] src = np.float32([s_LBot2, s_RBot2, s_RTop2, s_LTop2]) dst = np.float32([(250, 0), (510, 0), (510, 720), (250, 720)]) # Calculates a perspective transform from four pairs of the corresponding point M = cv2.getPerspectiveTransform(src, dst) Minv = cv2.getPerspectiveTransform(dst, src) warp_img = cv2.warpPerspective(result, M, (720, 720), flags=cv2.INTER_LINEAR) plt.imshow(warp_img)
Blind Search
class Line:
    def __init__(self):
        # was the line detected in the last iteration?
        self.detected = False
        # Set the width of the windows +/- margin
        self.window_margin = 56
        # x values of the fitted line over the last n iterations
        self.prevx = []
        # polynomial coefficients for the most recent fit
        self.current_fit = [np.array([False])]
        #radius of curvature of the line in some units
        self.radius_of_curvature = None
        # starting x_value
        self.startx = None
        # ending x_value
        self.endx = None
        # x values for detected line pixels
        self.allx = None
        # y values for detected line pixels
        self.ally = None
        # road information
        self.road_inf = None
        self.curvature = None
        self.deviation = None

left_line = Line()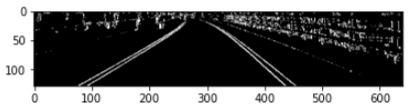
right_line = Line()- draw a histogram 차선이 있는 위치인 이미지 아랫부분에 대한 histogram을 그린다
# Take a histogram of the bottom half of the image
histogram = np.sum(warp_img[int(warp_img.shape[0] / 2):, :], axis=0)
plt.plot(histogram)
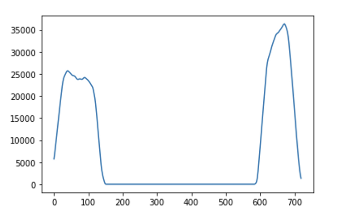
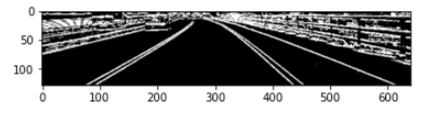
- warp image의 히스토그램을 반으로 나누어, 센터점을 기준으로 왼쪽, 오른쪽의 시작 포인트를 탐색한다.
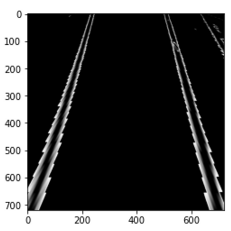
# Create an output image to draw on and  visualize the result
output = np.dstack((warp_img, warp_img, warp_img)) * 255

plt.imshow(output)
```python
# 히스토그램을 반으로 나눠 중간점을 기준으로 왼쪽, 오른쪽의 시작 포인트를 탐색
midpoint = np.int(histogram.shape[0] / 2)
# These will be the starting point for the left and right lines
start_leftX = np.argmax(histogram[:midpoint])
start_rightX = np.argmax(histogram[midpoint:]) + midpoint
print("start_leftX :", start_leftX, "// start_rightX :", start_rightX)
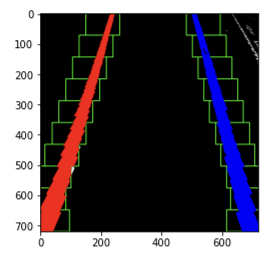
```슬라이딩 윈도우(sliding windows)기법을 사용한다. 윈도우 개수, 크기, 마진 값을 정의한 후 왼쪽과 오른쪽에 윈도우를 그려가며, 윈도우 내부에 0이 아닌 픽셀 값들을 검출하고 리스트에 추가한다.# Choose the number of sliding windows # sliding window 개수와 height 설정 num_windows = 10 # Set height of windows window_height = np.int(warp_img.shape[0] / num_windows) print(f"number of windows : {num_windows}, height of window : {window_height}")# Identify the x and y positions of all nonzero pixels in the image # zero-pixel이 아닌 모든 픽셀의 x와 y 포지션 nonzero = warp_img.nonzero() nonzeroy = np.array(nonzero[0]) nonzerox = np.array(nonzero[1]) # Current positions to be updated for each window # 현재 포지션(각 window마다 업데이트) current_leftX = start_leftX current_rightX = start_rightX # Set minimum number of pixels found to recenter window # 최소 픽셀 min_num_pixel = 50 window_margin = left_line.window_margin print(window_margin)# Create empty lists to receive left and right lane pixel indices win_left_lane = [] win_right_lane = [] # Step through the windows one by one for window in range(num_windows): # Identify window boundaries in x and y (and right and left) # 윈도우 경계 값을 정의하고 시각화 win_y_low = warp_img.shape[0] - (window + 1) * window_height win_y_high = warp_img.shape[0] - window * window_height win_leftx_min = current_leftX - window_margin win_leftx_max = current_leftX + window_margin win_rightx_min = current_rightX - window_margin win_rightx_max = current_rightX + window_margin # Draw the windows on the visualization image cv2.rectangle(output, (win_leftx_min, win_y_low), (win_leftx_max, win_y_high), (0, 255, 0), 2) cv2.rectangle(output, (win_rightx_min, win_y_low), (win_rightx_max, win_y_high), (0, 255, 0), 2) # 윈도우 내부에 non-zero pixel 검출하고 리스트에 추가 # Identify the nonzero pixels in x and y within the window left_window_inds = ((nonzeroy >= win_y_low) & (nonzeroy <= win_y_high) & (nonzerox >= win_leftx_min) & ( nonzerox <= win_leftx_max)).nonzero()[0] right_window_inds = ((nonzeroy >= win_y_low) & (nonzeroy <= win_y_high) & (nonzerox >= win_rightx_min) & ( nonzerox <= win_rightx_max)).nonzero()[0] # Append these indices to the lists win_left_lane.append(left_window_inds) win_right_lane.append(right_window_inds) # If you found > minpix pixels, recenter next window on their mean position if len(left_window_inds) > min_num_pixel: current_leftX = np.int(np.mean(nonzerox[left_window_inds])) if len(right_window_inds) > min_num_pixel: current_rightX = np.int(np.mean(nonzerox[right_window_inds]))# Concatenate the arrays of indices # 인덱스 어레이 연결(concatenate) win_left_lane = np.concatenate(win_left_lane) win_right_lane = np.concatenate(win_right_lane) # Extract left and right line pixel positions leftx, lefty = nonzerox[win_left_lane], nonzeroy[win_left_lane] rightx, righty = nonzerox[win_right_lane], nonzeroy[win_right_lane] output[lefty, leftx] = [255, 0, 0] output[righty, rightx] = [0, 0, 255] plt.imshow(output)
- 곡률을 계산한다.
# Fit a second order polynomial to each
left_fit = np.polyfit(lefty, leftx, 2)
right_fit = np.polyfit(righty, rightx, 2)

left_line.current_fit = left_fit
right_line.current_fit = right_fit
# Generate x and y values for plotting ploty = np.linspace(0, warp_img.shape[0] - 1, warp_img.shape[0]) # ax^2 + bx + c left_plotx = left_fit[0] * ploty ** 2 + left_fit[1] * ploty + left_fit[2] right_plotx = right_fit[0] * ploty ** 2 + right_fit[1] * ploty + right_fit[2]left_line.prevx.append(left_plotx) right_line.prevx.append(right_plotx) if len(left_line.prevx) > 10: left_avg_line = smoothing(left_line.prevx, 10) left_avg_fit = np.polyfit(ploty, left_avg_line, 2) left_fit_plotx = left_avg_fit[0] * ploty ** 2 + left_avg_fit[1] * ploty + left_avg_fit[2] left_line.current_fit = left_avg_fit left_line.allx, left_line.ally = left_fit_plotx, ploty else: left_line.current_fit = left_fit left_line.allx, left_line.ally = left_plotx, ploty if len(right_line.prevx) > 10: right_avg_line = smoothing(right_line.prevx, 10) right_avg_fit = np.polyfit(ploty, right_avg_line, 2) right_fit_plotx = right_avg_fit[0] * ploty ** 2 + right_avg_fit[1] * ploty + right_avg_fit[2] right_line.current_fit = right_avg_fit right_line.allx, right_line.ally = right_fit_plotx, ploty else: right_line.current_fit = right_fit right_line.allx, right_line.ally = right_plotx, ploty left_line.startx, right_line.startx = left_line.allx[len(left_line.allx)-1], right_line.allx[len(right_line.allx)-1] left_line.endx, right_line.endx = left_line.allx[0], right_line.allx[0] left_line.detected, right_line.detected = True, True""" measure radius of curvature """ # 곡률 계산 ploty = left_line.ally leftx, rightx = left_line.allx, right_line.allx leftx = leftx[::-1] # Reverse to match top-to-bottom in y rightx = rightx[::-1] # Reverse to match top-to-bottom in y # Define conversions in x and y from pixels space to meters width_lanes = abs(right_line.startx - left_line.startx) ym_per_pix = 30 / 720 # meters per pixel in y dimension xm_per_pix = 3.7*(720/1280) / width_lanes # meters per pixel in x dimension print(f"ym_per_pix : {ym_per_pix}, xm_per_pix : {xm_per_pix}") # Define y-value where we want radius of curvature # the maximum y-value, corresponding to the bottom of the image y_eval = np.max(ploty) # Fit new polynomials to x,y in world space left_fit_cr = np.polyfit(ploty * ym_per_pix, leftx * xm_per_pix, 2) right_fit_cr = np.polyfit(ploty * ym_per_pix, rightx * xm_per_pix, 2) # Calculate the new radii of curvature left_curverad = ((1 + (2 * left_fit_cr[0] * y_eval * ym_per_pix + left_fit_cr[1]) ** 2) ** 1.5) / np.absolute( 2 * left_fit_cr[0]) right_curverad = ((1 + (2 * right_fit_cr[0] * y_eval * ym_per_pix + right_fit_cr[1]) ** 2) ** 1.5) / np.absolute( 2 * right_fit_cr[0]) # radius of curvature result left_line.radius_of_curvature = left_curverad right_line.radius_of_curvature = right_curverad print(f"left_curverad : {left_curverad}, right_curverad : {right_curverad}")
Refer to Previous window
- 차선 탐지에 실패한 경우 → 이전에 탐지된 window가 있다면 이를 기반으로 차선을 그림
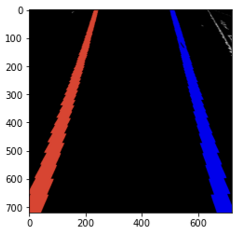
# left_line = Line()
# right_line = Line()

"""
refer to previous window info - after detecting lane lines in previous frame
"""
# Create an output image to draw on and  visualize the result
output = np.dstack((warp_img, warp_img, warp_img)) * 255

# Identify the x and y positions of all nonzero pixels in the image
nonzero = warp_img.nonzero()
nonzeroy = np.array(nonzero[0])
nonzerox = np.array(nonzero[1])

# Set margin of windows
window_margin = left_line.window_margin
print(window_margin)
left_line_fit = left_line.current_fit right_line_fit = right_line.current_fit leftx_min = left_line_fit[0] * nonzeroy ** 2 + left_line_fit[1] * nonzeroy + left_line_fit[2] - window_margin leftx_max = left_line_fit[0] * nonzeroy ** 2 + left_line_fit[1] * nonzeroy + left_line_fit[2] + window_margin rightx_min = right_line_fit[0] * nonzeroy ** 2 + right_line_fit[1] * nonzeroy + right_line_fit[2] - window_margin rightx_max = right_line_fit[0] * nonzeroy ** 2 + right_line_fit[1] * nonzeroy + right_line_fit[2] + window_margin # Identify the nonzero pixels in x and y within the window left_inds = ((nonzerox >= leftx_min) & (nonzerox <= leftx_max)).nonzero()[0] right_inds = ((nonzerox >= rightx_min) & (nonzerox <= rightx_max)).nonzero()[0] # Extract left and right line pixel positions leftx, lefty = nonzerox[left_inds], nonzeroy[left_inds] rightx, righty = nonzerox[right_inds], nonzeroy[right_inds] output[lefty, leftx] = [255, 0, 0] output[righty, rightx] = [0, 0, 255] plt.imshow(output)
Draw Lane
- 차선 내부 영역을 채우고, 채워진 영역을 다시 원근 변환하여 원래대로 되돌려 원래 이미지에 덮어 씌운다.
""" draw lane lines & current driving space """
window_img = np.zeros_like(output)
window_margin = left_line.window_margin
left_plotx, right_plotx = left_line.allx, right_line.allx
ploty = left_line.ally

# Generate a polygon to illustrate the search window area
# And recast the x and y points into usable format for cv2.fillPoly()
left_pts_l = np.array([np.transpose(np.vstack([left_plotx - window_margin/5, ploty]))])
left_pts_r = np.array([np.flipud(np.transpose(np.vstack([left_plotx + window_margin/5, ploty])))])
left_pts = np.hstack((left_pts_l, left_pts_r))

right_pts_l = np.array([np.transpose(np.vstack([right_plotx - window_margin/5, ploty]))])
right_pts_r = np.array([np.flipud(np.transpose(np.vstack([right_plotx + window_margin/5, ploty])))])
right_pts = np.hstack((right_pts_l, right_pts_r))
# Draw the lane onto the warped blank image
cv2.fillPoly(window_img, np.int_([left_pts]), (140, 0, 170))
cv2.fillPoly(window_img, np.int_([right_pts]), (140, 0, 170))
#plt.imshow(cv2.cvtColor(window_img, cv2.COLOR_BGR2RGB))

# Recast the x and y points into usable format for cv2.fillPoly()
pts_left = np.array([np.transpose(np.vstack([left_plotx+window_margin/5, ploty]))])
pts_right = np.array([np.flipud(np.transpose(np.vstack([right_plotx-window_margin/5, ploty])))])
pts = np.hstack((pts_left, pts_right))

# Draw the lane onto the warped blank image
cv2.fillPoly(window_img, np.int_([pts]), (0, 160, 0))
lane_result = cv2.addWeighted(output, 1, window_img, 0.3, 0)
plt.imshow(cv2.cvtColor(lane_result, cv2.COLOR_BGR2RGB))

# window_img, lane_result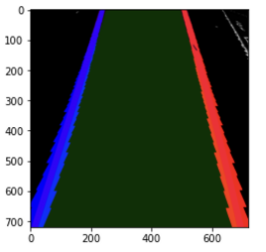
color_result = cv2.warpPerspective(window_img, Minv, (width, height))
lane_color = np.zeros_like(frame)
print(lane_color.shape)
print(color_result.shape)
lane_color[220:360 - 12, 0:640] = color_result
plt.imshow(cv2.cvtColor(lane_color, cv2.COLOR_BGR2RGB))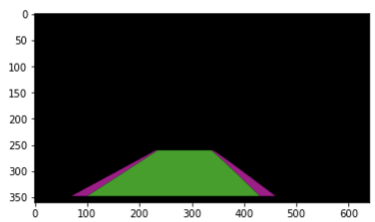
res = cv2.addWeighted(frame, 1, lane_color, 0.6, 0)
plt.imshow(cv2.cvtColor(res, cv2.COLOR_BGR2RGB))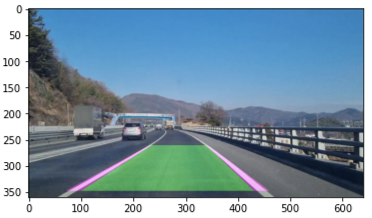
Road Status
- curvature and direction
""" print road status (curve direction, radius of curvature, deviation) """
curvature = (left_line.radius_of_curvature + right_line.radius_of_curvature) / 2
print("curvature :",curvature)

direction = ((left_line.endx - left_line.startx) + (right_line.endx - right_line.startx)) / 2
print("direction :",direction)
if curvature > 2000 and abs(direction) < 100 : road_info = 'No Curve' curvature = -1 elif curvature <= 2000 and direction < -50 : road_info = 'Left Curve' elif curvature <= 2000 and direction > 50 : road_info = 'Right Curve' else : if left_line.road_inf != None : road_info = left_line.road_inf curvature = left_line.curvature else : road_info = 'None' curvature = curvature print("Road Info :",road_info)center_lane = (right_line.startx + left_line.startx) / 2 lane_width = right_line.startx - left_line.startx print('center lane :', center_lane) center_car = 720 / 2 if center_lane > center_car : deviation = f'Left {str(round(abs(center_lane - center_car) / (lane_width/2) * 100, 2))}%' elif center_lane < center_car : deviation = f'Right {str(round(abs(center_lane - center_car) / (lane_width/2) * 100, 2))}%' else : deviation = 'Center' print(deviation)""" print road status (curve direction, radius of curvature, deviation) """ cv2.putText(info, 'Road Status', (22, 30), cv2.FONT_HERSHEY_COMPLEX, 0.7, (80, 80, 80), 2) lane_info = 'Lane info : ' + road_info if curvature == -1 : lane_curve = 'Curvature : Straight Line' else : lane_curve = f'Curvature : {curvature:.3f}' deviate = 'Deviation : ' + deviation cv2.putText(info, lane_info, (10, 63), cv2.FONT_HERSHEY_COMPLEX, 0.45, (100, 100, 100), 1) cv2.putText(info, lane_curve, (10, 83), cv2.FONT_HERSHEY_COMPLEX, 0.45, (100, 100, 100), 1) cv2.putText(info, deviate, (10, 103), cv2.FONT_HERSHEY_COMPLEX, 0.45, (100, 100, 100), 1) cv2.imshow('info', info) cv2.waitKey(0) cv2.destroyAllWindows()
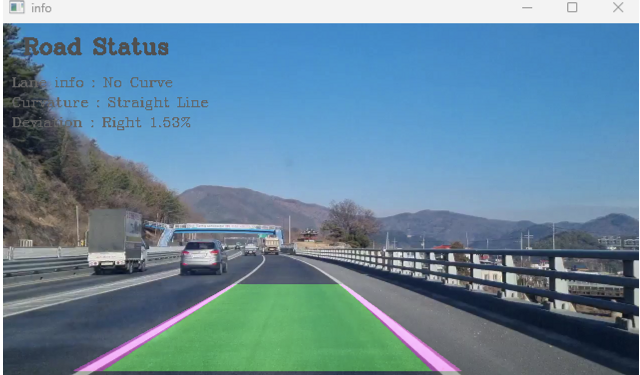
샘플 이미지는 직접 촬영한 영상을 기반으로 생성한 것이고, hls나 sobel filter의 threshold, warpPerspective의 파라미터 또한 이 이미지에 맞추어서 다른 이미지에 코드 그대로 사용하면 맞지 않을 것이다.
이 부분에 대해 일반화를 하고 싶었는데 아직 방법을 찾지 못했다. 😥 그렇지만 이미지에 맞는 파라미터들을 잘 넣으면 샘플 이미지와 같이 차선 영역이 꽤 잘 탐색될 것이다.