매출 영향 값들과 매출액으로 회귀분석을 구현하였다.
▪ 단순선형회귀분석
- X값으로 일자별 아이템 사용 현황을 사용한다.
# DB에서 추출한 값으로 진행
import pandas as pd
#'use_date':날짜(2022-01-01 형식),'auto_no':PK(serial number)
# X값 추출
# 일별로 groupby하여 일별 총 아이템 사용량을 산출(count)
item_use_log['date'] = item_use_log['use_date'].apply(lambda x :str(x)[:10])
item_cnt = item_use_log.groupby('date').count()[['auto_no']].reset_index()
item_cnt = item_cnt.rename(columns={'auto_no' : 'item_use_total_cnt'} )
item_cnt.head(3)
- Y값으로 일자별 매출 현황을 사용한다.
#'date':날짜(2022-01-01 형식),'sales_amt':매출액
sales['date'] = pay_succ['date'].apply(lambda x :str(x)[:10])
sales['sales_amt'] = sales['sales_amt'].astype(int)
# y값 추출
# 일별로 groupby하여 일별 매출 총액을 산출(sum)
sales_total =  sales.groupby('date').sum()[['sales_amt']].reset_index()
sales_total.head(3)
✳ 단순선형회귀
- 한 변수와 또 다른 변수 크기 사이의 관계에 대한 모델을 제공
- 상관관계가 두 변수 사이의 전체적 관련 강도를 측정하는 것이라면, 회귀는 관계 자체를 정량화하는 방법이라는 점에서 차이가 있다.
✳ 회귀식
- 단순선형회귀를 통해 X가 얼만큼 변하면 Y가 어느 정도 변하는지를 정확히 추정할 수 있다.
회귀에서는 다음과 같은 식으로 선형 관계를 이용하여 변수 X로부터 변수 Y를 예측하고자 한다.
Y = b₀ + b₁X
- b₀는
절편(상수)그리고 b₁은 X의기울기(slope)라고 한다.
from sklearn.linear_model import LinearRegression
model = LinearRegression()
# item 사용량을 변수 X로, 총 매출을 변수 Y로 하는 모델 생성
model.fit(item_cnt[['item_use_total_cnt']], pay_total['pay_amt'])

print(f'Intercept(절편) : {model.intercept_:.3f}') # X=0일때 예측값
print(f'Coefficient Exposure(회귀계수) : {model.coef_[0]:.3f}')
✳ 결과 해석
- model.intercept_ (b₀) : 절편 값
2963716.319은 아이템 사용량이 0일때 예측되는 총 매출 - model.coef_0 ( b₁) : 아이템 사용량이 1 증가할 때마다, 총 매출은
1863.481의 비율로 늘어난다
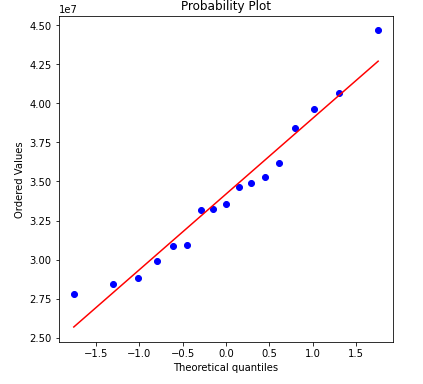
✳ 잔차도 그리기
- scipy의 stats.probplot으로 잔차도(residual plot)를 구현
from scipy.stats import probplot
fig = plt.figure(figsize=(6,6))
fig.set_facecolor('white')

ax = fig.add_subplot()
probplot(residuals, dist='norm',plot=ax) ## plot 출력
plt.show()

▪ 다중선형회귀분석
- 예측변수가 여러 개일 때 수식은 다음과 같은 형태가 된다.
Y = b₀ + b₁X₁ + b₂X₂+ … + bᵢXᵢ + e
- 단순선형회귀에서 사용한 X값, Y값에 X값 feature 하나를 추가하여 구현
- X값으로 일자별 로그인 현황 사용
#'login_date':날짜(2022-01-01 형식),'auto_no':PK(serial number)
# X값 추출
# 일별로 groupby하여 날짜별 회원 총 로그인 횟수를 산출(count)
login_log.drop_duplicates(['date','mem_no'], inplace=True) # 일별 1번만 count
login_cnt = login_log.groupby('date').count()[['auto_no']].reset_index()
login_cnt = login_cnt.rename(columns={'auto_no' : 'login_use_total_cnt'} )
login_cnt['login_date'] = login_cnt['login_date'].astype(str)
login_cnt.head(3)

# 최종 X값 도출
X_data = pd.merge(login_cnt, item_cnt)
X_data.drop('date',axis=1, inplace=True)
X_data.head(3)
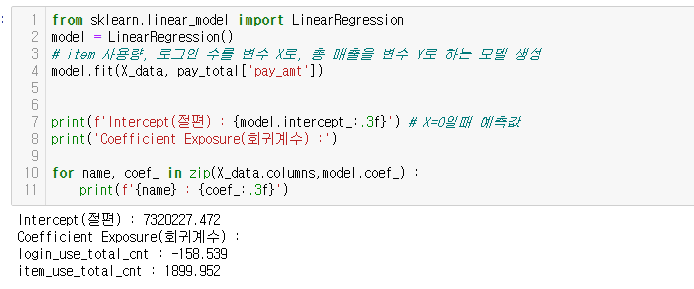
from sklearn.linear_model import LinearRegression model = LinearRegression() # item 사용량, 로그인 수를 변수 X로, 총 매출을 변수 Y로 하는 모델 생성 model.fit(X_data, sales_total['sales_amt']) print(f'Intercept(절편) : {model.intercept_:.3f}') # X=0일때 예측값 print('Coefficient Exposure(회귀계수) :') for name, coef_ in zip(X_data.columns,model.coef_) : print(f'{name} : {coef_:.3f}')

✳ 결과 해석
- model.intercept_ (b₀) : 절편 값
7320227.472은 아이템 사용량이 0일때 예측되는 총 매출 - model.coef_0 (b₁) : 로그인이 1 증가할 때마다, 총 매출은
158.539의 비율로 감소 - model.coef_1 (b₂) : 아이템 사용이 1 증가할 때마다, 총 매출은
1899.952의 비율로 증가
✳ 모델 평가
import numpy as np
from sklearn.metrics import mean_squared_error, r2_score
pred = model.predict(X_data)
rmse = np.sqrt(mean_squared_error(sales['sales_amt'],pred))
r2 = r2_score(sales['sales_amt'], pred)
print(f'RMSE : {rmse:.3f}') # 제곱근평균제곱오차
print(f'r2_score : {r2:.3f}') # R^2 통계량
로그인이 대체 왜 음수값이 뜨는지 모르겠는데 😥😥 아마 로그인 수가 제대로 집계가 안된 듯...
