this post is created with the help of GPT-4
Metrics used for GAN(generative models)
Inception score
To calculate the Inception Score (IS), we use the Kullback-Leibler (KL) divergence to measure how much the conditional probability distribution (probability of classes given an image) diverges from the marginal probability distribution (probability of classes over the entire dataset of generated images). Let's break down the process step by step with a simplified example, keeping in mind that in practice, these calculations would involve much larger datasets and a more complex model (the Inception model).
Step 1: Generate Images & Predict Class Probabilities
First, let’s assume our GAN generates a small set of images, and we use the Inception model to predict the class probabilities for each image. Suppose we have 3 classes (Dog, Cat, Bird) and our dataset consists of 4 generated images. After passing these images through the Inception model, we get the following conditional probability distributions (P(y|x)):
Image 1: Dog 0.9, Cat 0.05, Bird 0.05
Image 2: Dog 0.1, Cat 0.8, Bird 0.1
Image 3: Dog 0.05, Cat 0.15, Bird 0.8
Image 4: Dog 0.33, Cat 0.33, Bird 0.34
Step 2: Calculate Marginal Probability Distribution
Next, we calculate the marginal probability distribution (P(y)) by averaging the probabilities across all generated images for each class:
Dog: (0.9 + 0.1 + 0.05 + 0.33) / 4 = 0.345
Cat: (0.05 + 0.8 + 0.15 + 0.33) / 4 = 0.3325
Bird: (0.05 + 0.1 + 0.8 + 0.34) / 4 = 0.3225
Step 3: Calculate KL Divergence for Each Image
For each image, calculate the KL divergence between its conditional probability distribution and the marginal probability distribution. The KL divergence from Q to P is defined as:
Applying this to Image 1 for each class:
Dog:
Cat:
Bird:
Repeat this for each image and sum the KL divergences for each class within an image to get the KL divergence for that image.
Step 4: Average KL Divergence & Exponential
Finally, average the KL divergences across all images and take the exponential of this average to get the Inception Score:
This final score is a single scalar value that ideally should be as high as possible for a good quality and diverse set of generated images.
The Fréchet Inception Distance
The Fréchet Inception Distance (FID) score is another way to evaluate the quality of images generated by models like GANs, but instead of focusing on class labels, it compares the distribution of features extracted from a deep network between the generated and real images. Let's go through the process step by step with a simplified example to understand how FID is calculated.
Step 1: Feature Extraction
First, both real images and generated images are passed through a feature extractor. Although the name "Fréchet Inception Distance" suggests the use of the Inception model, in principle, any feature extractor could be used. This extractor outputs a feature vector for each image.
Let's assume we have a very simplified scenario with only 2 images in each set (real and generated), and our feature extractor outputs 2D vectors. After processing, we might have:
Real Images: Feature Vectors
Image 1: (1, 2)
Image 2: (2, 3)
Generated Images: Feature Vectors
Image 1: (2, 2)
Image 2: (3, 4)
Step 2: Calculate Mean and Covariance
Next, we calculate the mean and covariance of the feature vectors for both real and generated images.
Real Images:
Mean: ((1+2)/2, (2+3)/2) = (1.5, 2.5)
Covariance: For simplicity, let's assume we calculate it and get Cov_real.
Generated Images:
Mean: ((2+3)/2, (2+4)/2) = (2.5, 3)
Covariance: Similarly, assume we calculate it and get Cov_gen.
Step 3: Calculate the Fréchet Distance
The Fréchet distance between two multivariate Gaussians (real and generated images) is given by:
Where:
is the squared Euclidean distance between the means of the real and generated feature vectors.
(Tr) denotes the trace of a matrix (the sum of elements on the main diagonal).
and are the covariance matrices of the real and generated feature vectors, respectively.
Applying this to our example:
Mean Difference Squared:
For Trace Calculation: We assume the calculation of based on our Cov_real and Cov_gen, which involves more complex linear algebra.
Step 4: Interpretation
The FID score is a single scalar value, where a lower FID score indicates better similarity between the generated images and the real images, implying higher quality of the generated images.
The Fréchet Audio Distance (FAD)
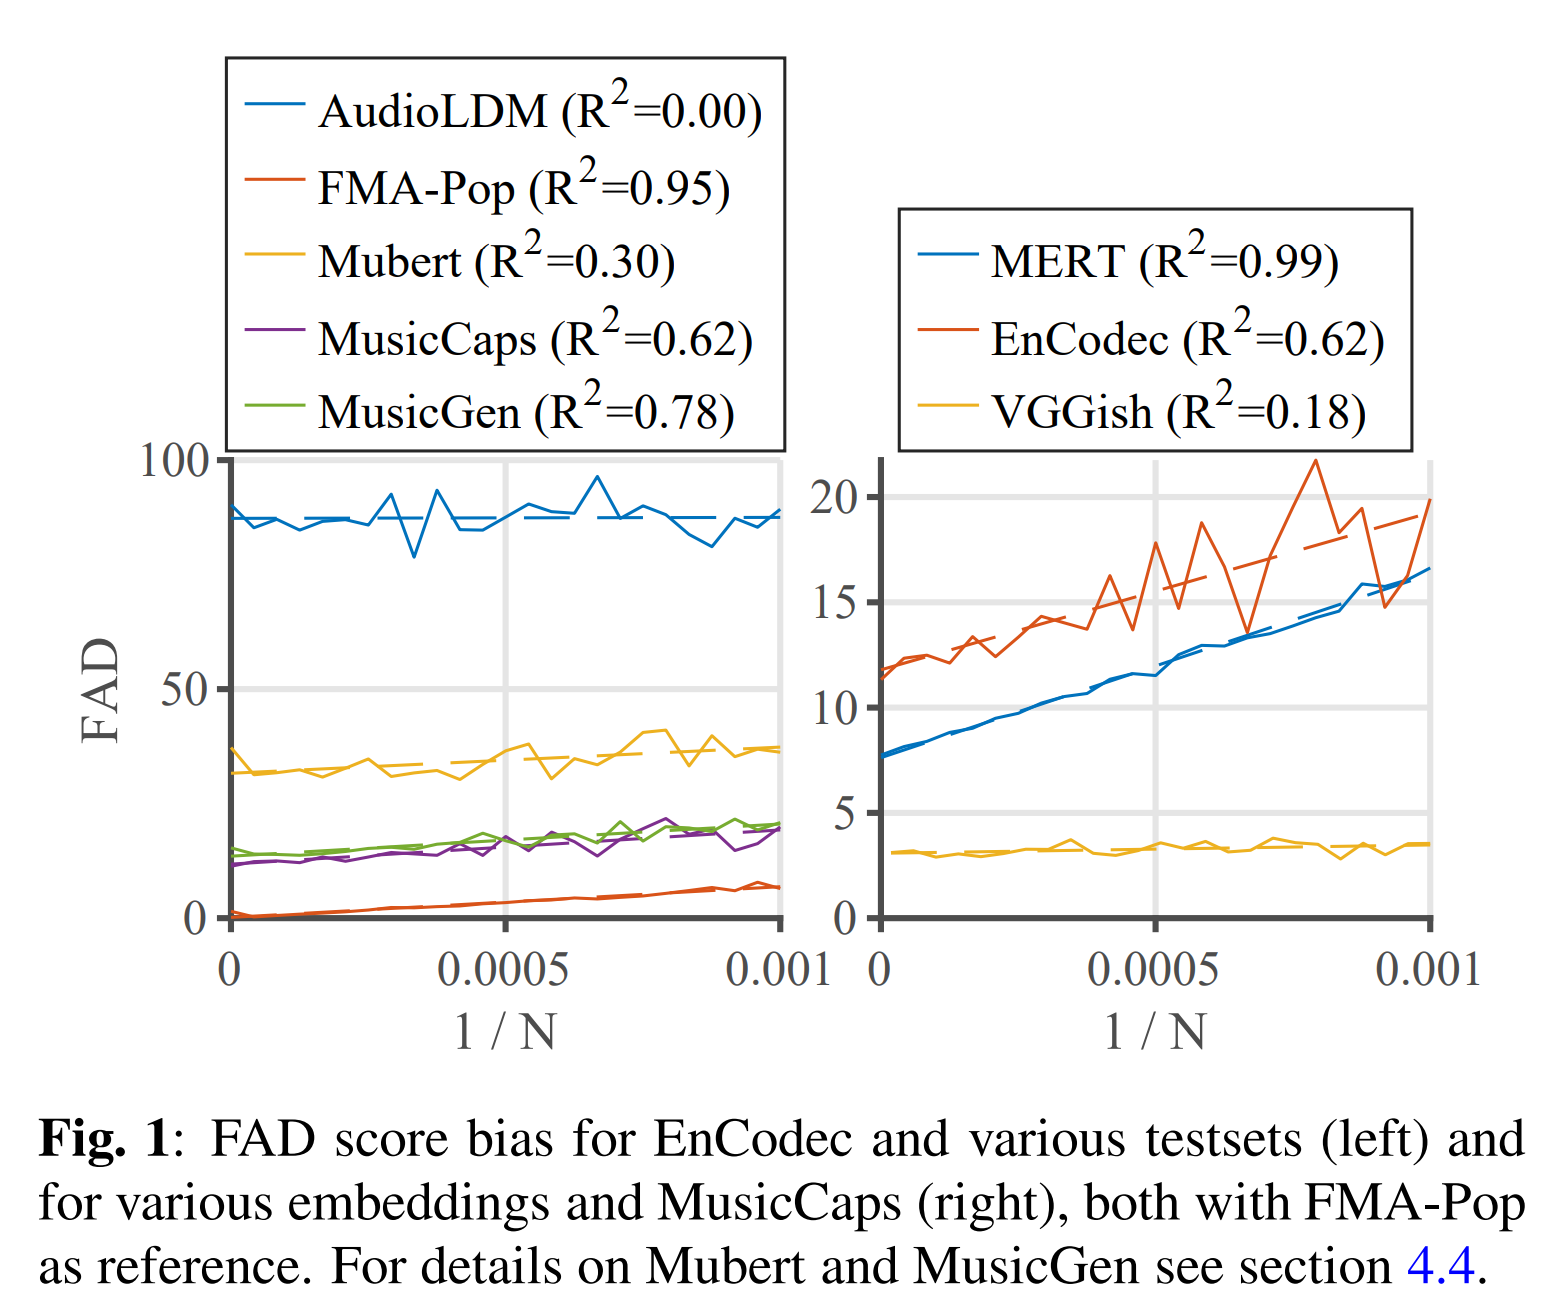
same as FID, but we will use a new method presented by the paper "Adapting Frechet Audio Distance for Generative Music Evaluation" by Azalea Gui et al.
github link: https://github.com/microsoft/fadtk
In this method they extrapolate scores towards an infinite sample size.
from "Adapting Frechet Audio Distance for Generative Music Evaluation" by Azalea Gui et al.
Kullback–Leibler divergence
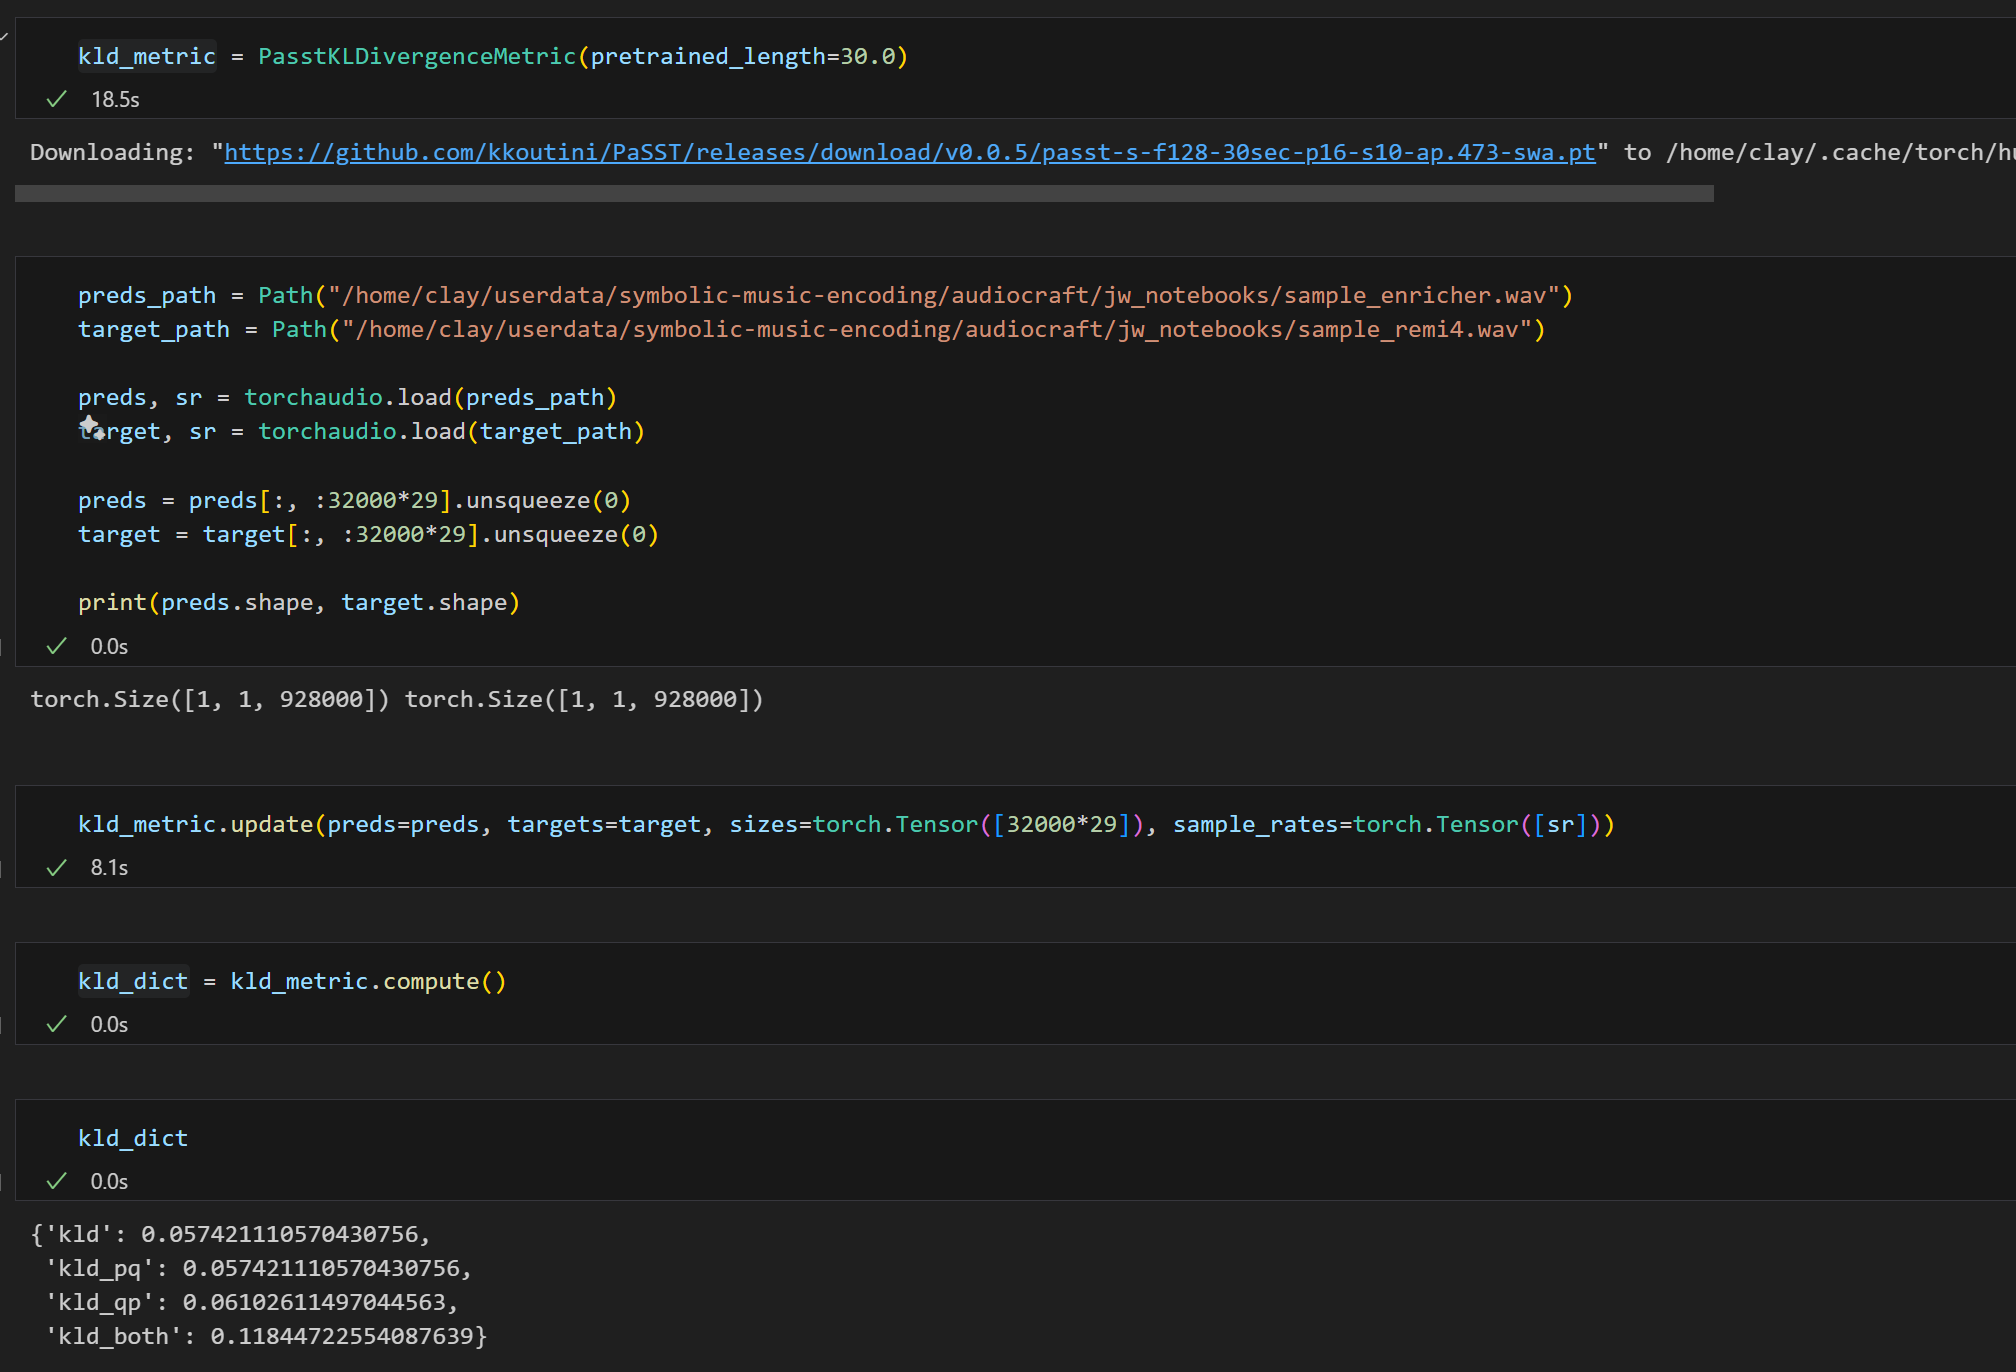
Audiocraft from MusicGen also provides a toolkit which can calculate KLD between prompt audio and generated audio. The toolkit utilizes Passt as a baseline model to get representation from a given wav audio.
"Following Kreuk et al. [2022], we use a state-of-the-art audio classifier trained for classification on AudioSet [Koutini et al., 2021] to compute the KL-divergence over the probabilities of the labels between the original and the generated music. The generated music is expected to share similar concepts with the reference music when the KL is low."
from "Simple and Controllable Music Generation" by Jade Copet et al.
Example of implementing KLD