탐색적 데이터 분석 EDA
데이터를 보는 눈!
힌트
1.데이터 톺아보기
각 데이터는 어떤 자료형을 가지고 있나?
데이터에 결측치는 없나?
데이터의 자료형을 바꿔줄 필요가 있나?
2.데이터에 대한 가설을 세우기
가설을 개인의 경험에 의해서 도출되어도 상관이 없다.
가설은 명확할 수록 좋다.
타이타닉에서 성별과 생존률은 상관이 있을 것이다.
3.가설을 검증하기 위한 증거를 찾아본다.
이 증거는 한 눈에 보이지 않을 수 있다. 여러 테크닉을 써줘야 한다.
groupby를 통해서 그룹화된 정보에 통계량을 도입하기
merge를 통해서 두개 이상의 dataframe을 합쳐본다
시각화를 통해 일목요연하게 보여준다.
EDA
AI 과정에는 CNN RNN 등의 뉴럴 네트워크 기법들이 있다. 하지만 우리가 방법론에만 집중하다보면 데이터가 가진 본질적인 의미를 망각할 수 있다. EDA는 데이터 그자체의 특성과 그 특성들을 눈으로 확인하는 과정이다.
EDA는 데이터 그자체만으로부터 인사이트를 얻어내는 접근법이다. 통계적 수치나 numpy/pandas등으로 알 수 있다.
EDA process
1.분석의 목적과 변수 확인(dataframe의 column) : 목적을 명확히 해야 한다.
2.데이터 전체적으로 살펴보기 : 데이터의 상관관계, NA의 여부, 데이터의 크기
3.데이터의 개별 속성 파악하기
EDA with example - Titanic
https://www.kaggle.com/c/titanic/data
1.분석의 목적과 변수 확인
- 분석의 목적 확인
살아남은 사람들은 어떤 특징을 가지고 있었을까? - 변수확인
우선 변수variable는 10가지가 있다.
변수의 의미는 definition이다.
key는 숫자 인코딩을 의미한다.
데이터 살펴보기
# 라이브러리 불러오기
import numpy as np
import pandas as pd
import matplotlib.pyplot as plt
import seaborn as sns

%matplotlib inline

# 데이터 불러오기, 동일경로
titanic_df = pd.read_csv("./train.csv")
#상위 5개 데이터
titanic_df.head(5)#column의 데이터 타입을 확인해보자
titanic_df.dtypes ->
PassengerId int64
Survived int64
Pclass int64
Name object
Sex object
Age float64
SibSp int64
Parch int64
Ticket object
Fare float64
Cabin object
Embarked object
dtype: object데이터 전체적으로 살펴보기
#수치형 데이터에 대한 요약만을 제공
titanic_df.describe()
이 중에서 의미가 있는 값은 survived(살아남지 못한 사람이 더 많다), Age, SibSp, Parch, Fare(편차가 굉장히 크다.)
상관계수 확인
titanic_df.corr()절대값이 가장 큰 관계는 Pclass와 Fare이며 이 둘은 좌석 클래스와 지불한 가격 사이의 관계이기에 당연하다고 볼 수 있다. 다음으로 중요한 것은 Pclass, Fare와 Survived의 관계를 살펴볼 수 있다.
다만 Correlation is not Causation이다.
상관성 : A up, B up, ...
인과성 : A -> B
상관관계로부터 인과성을 증명하긴 매우 어렵다.
결측치 확인
titanic_df.isnull()Age, Cabin, Embarked에서 결측치를 발견!
그 처리는 각자의 아이디어에 따른다.
titanic_df.isnull().sum() ->
PassengerId      0
Survived         0
Pclass           0
Name             0
Sex              0
Age            177
SibSp            0
Parch            0
Ticket           0
Fare             0
Cabin          687
Embarked         2
dtype: int64
데이터의 개별 속성 파악하기
Survived Column
생존자, 사망자의 명수을 알아보자
titanic_df['Survived'].sum()
-> 342
titanic_df['Survived'].value_counts()
->
0    549
1    342
Name: Survived, dtype: int64
#생존자와 사망자수를 Barplot으로 그려보기 sns.countplot()
sns.countplot(x='Survived',data=titanic_df)
plt.show이산
Pclass에 따른 상관관계
#Pclass에 따른 인원 파악
titanic_df[['Pclass','Survived']]
->
Pclass	Survived
0	3	0
1	1	1
2	3	1
3	1	1
4	3	0
...	...	...
886	2	0
887	1	1
888	3	0
889	1	1
890	3	0
#Pclass별 탑승인원
titanic_df[['Pclass','Survived']].groupby('Pclass').count() ->
Survived
Pclass
1 216
2 184
3 491#Pclass별 생존인원
titanic_df[['Pclass','Survived']].groupby('Pclass').sum() ->
Survived
Pclass
1 136
2 87
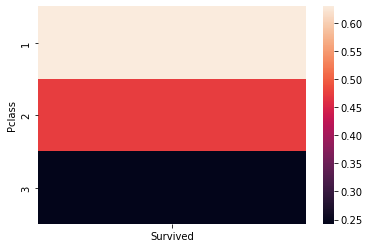
3 119#Pclass별 생존률
Survived
Pclass
1 0.629630
2 0.472826
3 0.242363# 히트맵 활용
sns.heatmap(titanic_df[['Pclass','Survived']].groupby('Pclass').mean())
plt.show()
Sex에 따른 상관관계
titanic_df[['Sex', 'Survived']]
Sex	Survived
0	male	0
1	female	1
2	female	1
3	female	1
4	male	0
...	...	...
886	male	0
887	female	1
888	female	0
889	male	1
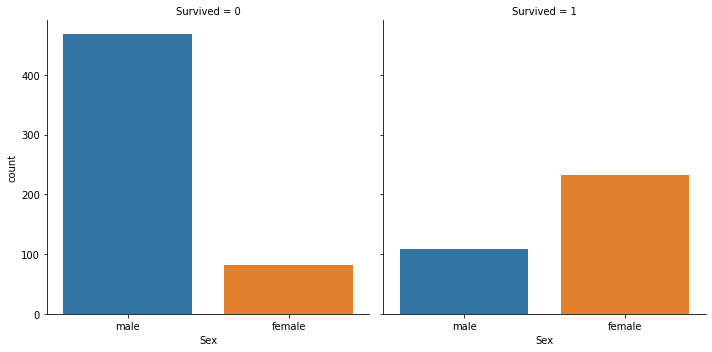
890 male 0titanic_df.groupby(['Survived','Sex']).count()titanic_df.groupby(['Survived','Sex'])['PassengerId'].count() ->
Survived Sex
0 female 81
male 468
1 female 233
male 109
Name: PassengerId, dtype: int64# sns.catplot
sns.catplot(x='Sex', col='Survived', kind='count',data=titanic_df)
Survived에 대한 케이스 분류를 col이라는 매개변수로 지정하고 x에는 두번째 케이스 분류를 입력한다.
연속
IV.Age
결측치가 존재한다
titanic_df.describe()['Age'] ->
count    714.000000
mean      29.699118
std       14.526497
min        0.420000
25%       20.125000
50%       28.000000
75%       38.000000
max       80.000000
Name: Age, dtype: float64
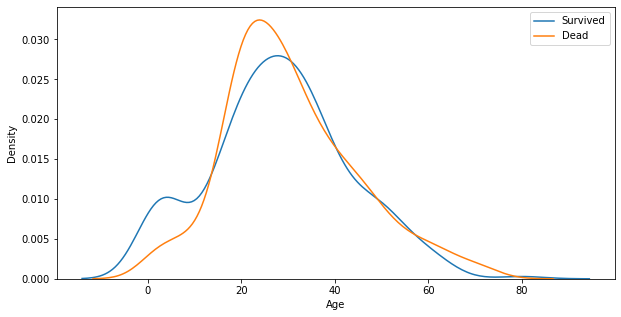
# survived와 age의 경향성을 커널밀도함수로 그린다.
# figure -> axis -> plot
# figure는 그래프의 도면
# axis는 figure 안의 틀
# 틀 위에 그래프를 그림
fig, ax = plt.subplots(1, 1, figsize=(10,5))
sns.kdeplot(x=titanic_df[titanic_df['Survived']==1]['Age'],ax=ax)
sns.kdeplot(x=titanic_df[titanic_df['Survived']==0]['Age'],ax=ax)
plt.legend(['Survived', 'Dead'])
plt.show()
#위의 subplots를 사용하지 않아도 그래프를 중복해서 그릴 수 있다.
plt.figure(figsize=(10,6))
sns.kdeplot(x=titanic_df[titanic_df['Survived']==1]['Age'])
sns.kdeplot(x=titanic_df[titanic_df['Survived']==0]['Age'])
plt.legend(['Survived', 'Dead'])
plt.show()
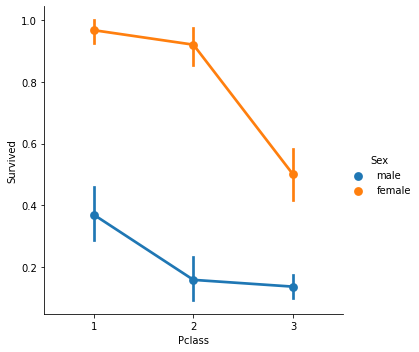
Appendix I.Pclass + Sex vs Survived
sns.catplot(x='Pclass', y='Survived', hue='Sex', kind='point',data=titanic_df)
plt.show()
Appendix II.Pclass + Age vs Survived
titanic_df['Age'][titanic_df.Pclass==1].plot(kind='kde')
titanic_df['Age'][titanic_df.Pclass==2].plot(kind='kde')
titanic_df['Age'][titanic_df.Pclass==3].plot(kind='kde')
plt.legend(['1st','2nd','3rd'])
plt.show()
타이타닉의 데이터를 시각화
참고 : https://log-laboratory.tistory.com/290
