- 선 그래프 (라인차트)
df_unrate = pd.read_csv('c:/Users/82106/Downloads/UNRATE.csv')
df_unrate.head()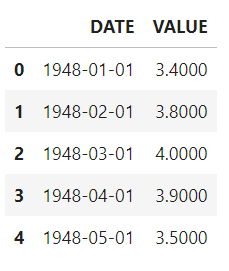
- 정보 확인
df_unrate.info()<class 'pandas.core.frame.DataFrame'>
RangeIndex: 918 entries, 0 to 917
Data columns (total 2 columns):
Column Non-Null Count Dtype
0 DATE 918 non-null object
1 VALUE 918 non-null float64
dtypes: float64(1), object(1)
memory usage: 14.5+ KB
- 선 그래프 그리기
plt.plot(df_unrate['DATE'], df_unrate['VALUE'])
plt.show()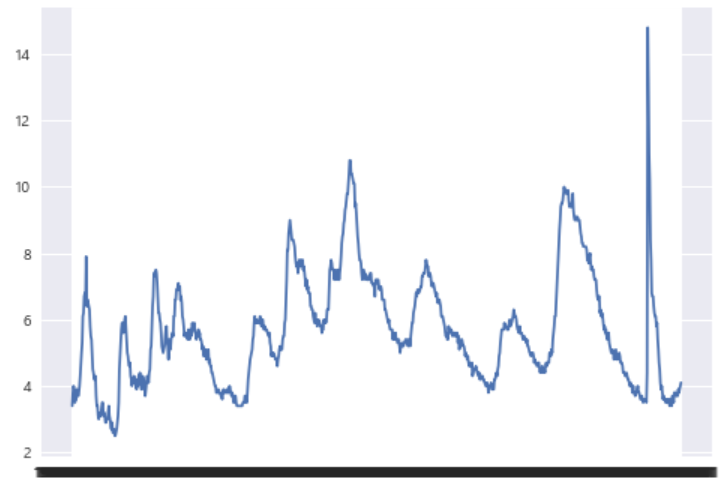
- 날짜형 데이터로 변환
pd.to_datetime(df_unrate['DATE'])to_datetime 함수는 문자열 형식의 날짜 데이터를 datetime 객체로 변환하는 pandas의 함수이다.
df_unrate['DATE']:
['DATE']는 데이터프레임의 'DATE' 열을 선택한다.
0     1948-01-01
1     1948-02-01
2     1948-03-01
3     1948-04-01
4     1948-05-01
         ...
913   2024-02-01
914   2024-03-01
915   2024-04-01
916   2024-05-01
917   2024-06-01
Name: DATE, Length: 918, dtype: datetime64[ns]df_unrate.info()<class 'pandas.core.frame.DataFrame'>
RangeIndex: 918 entries, 0 to 917
Data columns (total 2 columns):
Column Non-Null Count Dtype
0 DATE 918 non-null datetime64[ns]
1 VALUE 918 non-null float64
dtypes: datetime64ns, float64(1)
memory usage: 14.5 KB
- 그래프 확인
plt.plot(df_unrate['DATE'], df_unrate['VALUE'])
plt.show()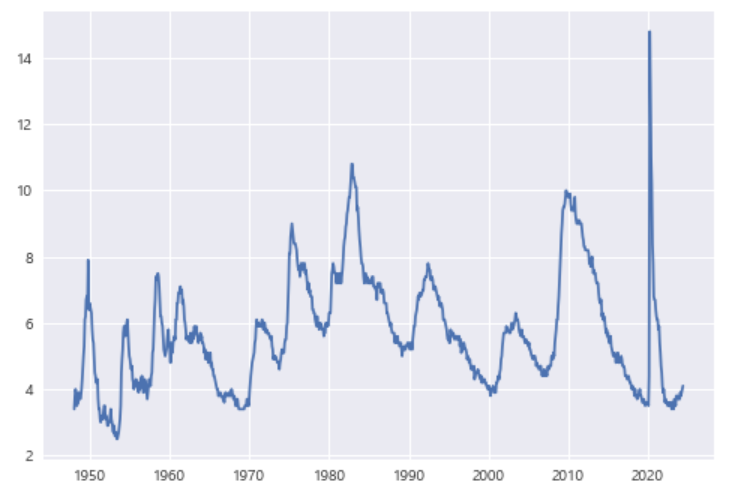
- 새로운 그래프 형태 그리기 (날개와 몸무게간의 관계, 펭귄의 몸무게 분포)
fig, axes = plt.subplots(2, 1, figsize=(12, 6))

# 첫번째 그림
axes[0].scatter(df['flipper_length_mm'], df['body_mass_g'])
axes[0].set_xlabel('날개 길이(mm)')
axes[0].set_ylabel('몸무게(g)')
axes[0].set_title('날개와 몸무게간의 관계')

# 두번째 그림
axes[1].hist(df['body_mass_g'], bins=30)
axes[1].set_xlabel('Body Mass')
axes[1].set_ylabel('Count')
axes[1].set_title('펭귄의 몸무게 분포')


# 간격 조정
plt.subplots_adjust(left=0.1,
                    right=0.95,
                    bottom=0.1,
                    top=0.95,
                    wspace=0.5,
                    hspace=0.5)

plt.show()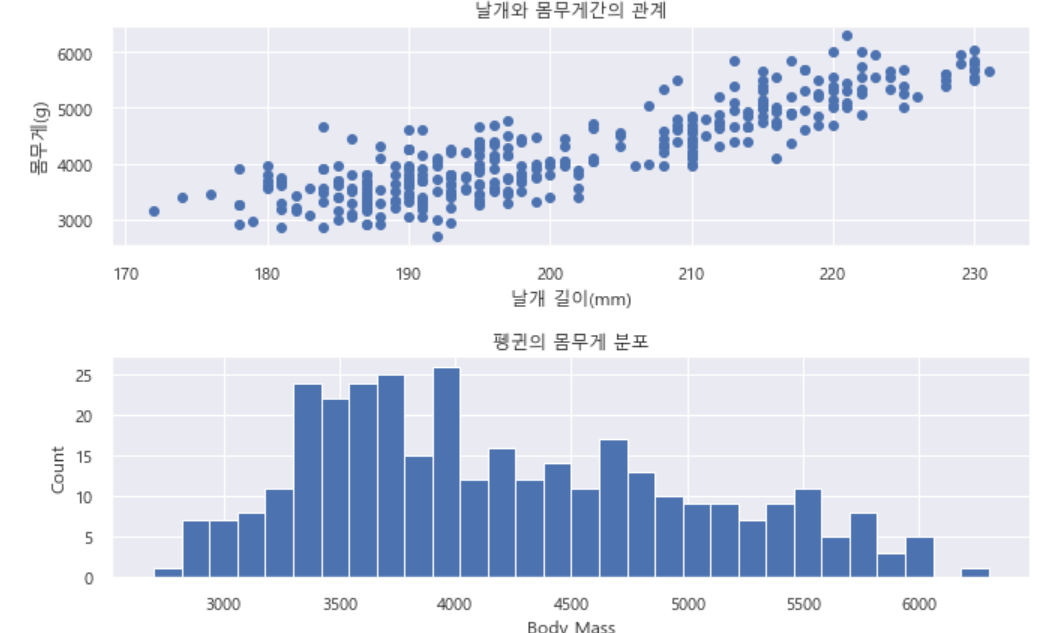
첫 번째 그래프 (산점도)
목적: 두 변수 간의 관계를 분석
데이터: 두 변수의 값을 사용하여 각 점을 표시
x축: 날개 길이
y축: 몸무게
의미: 날개 길이와 몸무게 간의 상관관계를 시각화
두 번째 그래프 (히스토그램)
목적: 단일 변수의 분포를 분석
데이터: 변수의 구간별 빈도를 막대로 표시
x축: 몸무게
y축: 빈도
의미: 펭귄 몸무게의 분포를 시각화
