1) 회귀선이 있는 산점도
import seaborn as sns
import matplotlib.pyplot as plt

titanic = sns.load_dataset('titanic')
# Seaborn 제공 titanic 데이터 셋 사용

sns.set_style('darkgrid')
# 스타일 테마 설정

fig = plt.figure(figsize=(15,5))
ax1 = fig.add_subplot(1,2,1)
ax2 = fig.add_subplot(1,2,2)
# 그래프 객체 생성

sns.regplot(x = 'age',
           y = 'fare',
           data = titanic,
           ax = ax1)
# 그래프 그리기 - 선형 회귀선 표시

sns.regplot(x = 'age',
           y = 'fare',
           data = titanic,
           ax = ax2,
           fit_reg = False)
# fit_reg = False 는 선형 회귀선 미표시

plt.show()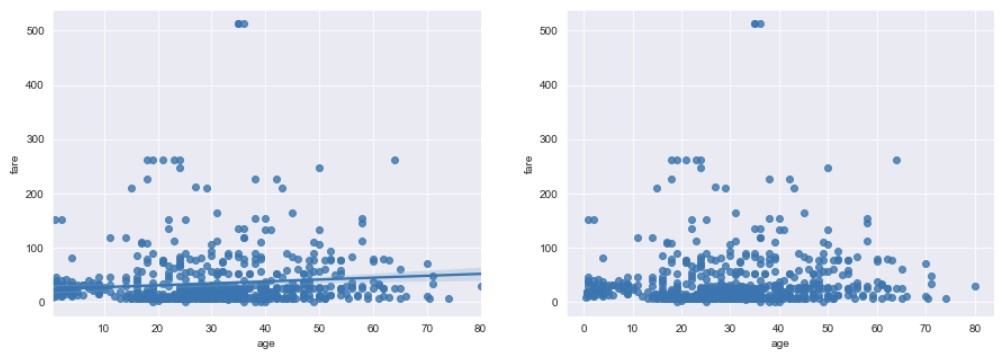
2) 히스토그램/커널 밀도 그래프
import seaborn as sns
import matplotlib.pyplot as plt

titanic = sns.load_dataset('titanic')

sns.set_style('darkgrid')
# 스타일 테마 설정

fig = plt.figure(figsize = (15, 5))
ax1 = fig.add_subplot(1,3,1)
ax2 = fig.add_subplot(1,3,2)
ax3 = fig.add_subplot(1,3,3)

sns.distplot(titanic['fare'], ax = ax1)
# 기본값

sns.distplot(titanic['fare'], hist = False, ax = ax2)
# hist = False 인 경우 (히스토그램이 표시되지 않음)

sns.distplot(titanic['fare'], kde = False, ax = ax3)
# kde = False 인 경우 (커널 밀도 그래프를 표시하지 않음)

ax1.set_title('titanic fare - hist/ked')
ax2.set_title('titanic fare - ked')
ax3.set_title('titanic fare - hist')

plt.show()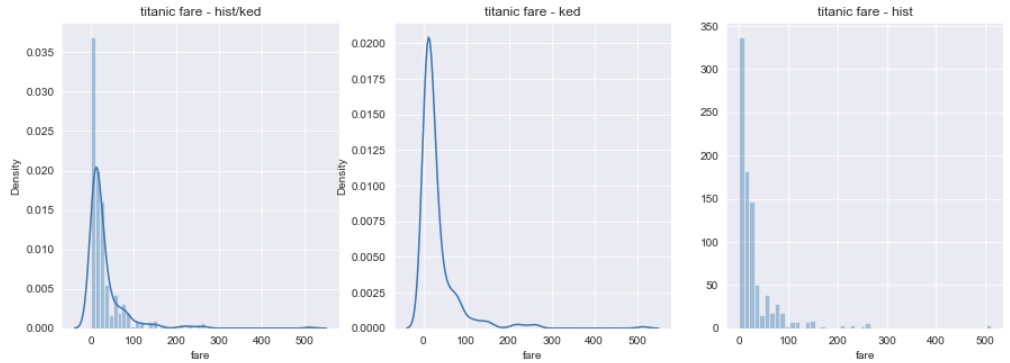
3) 히트맵
import seaborn as sns
import matplotlib.pyplot as plt

titanic = sns.load_dataset('titanic')

table = titanic.pivot_table(index = ['sex'], columns = ['class'], aggfunc = 'size')
# 피벗테이블을 활용하여 범주형 변수를 행은 성별, 열은 클래스로 재구분하여 정리
# aggfunc = 'size'는 데이터 값의 크기를 기준으로 집계

sns.heatmap(table, #데이터 프레임
           annot = True, fmt = 'd', # 데이터 값 표시 여부, 정수형 포맷
           cmap = 'YlGnBu', # 컬러 맵
           linewidth = .5, # 구분 선 굵기
           cbar = False) # 컬러바 표시 여부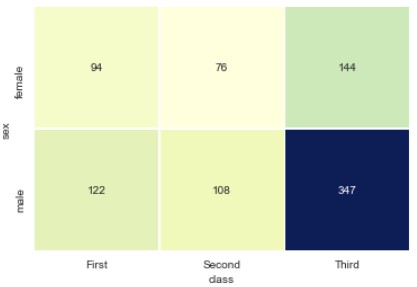
4) 범주형 데이터의 산점도
import seaborn as sns
import matplotlib.pyplot as plt

titanic = sns.load_dataset('titanic')

sns.set_style('whitegrid')
# 스타일 테마 설정

fig = plt.figure(figsize = (15, 5))
ax1 = fig.add_subplot(1,3,1)
ax2 = fig.add_subplot(1,3,2)
ax3 = fig.add_subplot(1,3,3)

sns.stripplot(x = 'class',
             y = 'age',
             data = titanic,
             ax = ax1)
# 이산형 변수의 분포 (데이터 분산 미고려)

sns.swarmplot(x = 'class',
             y = 'age',
             data = titanic,
             ax = ax2)
# 이산형 변수의 분포 (데이터 분산 고려 - 중복 X)

sns.swarmplot(x = 'class',
             y = 'age',
             data = titanic,
             ax = ax3,
             hue = 'sex')
# 이산형 변수의 분포 (데이터 분산 고려 - 중복 X)
# 성별 열의 데이터 값인 남/여 성별을 색상으로 구분하여 출력

plt.show()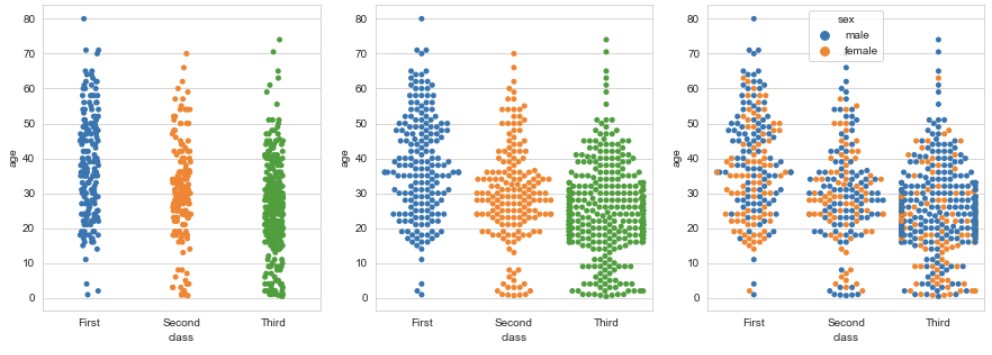
5) 막대 그래프
import seaborn as sns
import matplotlib.pyplot as plt

titanic = sns.load_dataset('titanic')

sns.set_style('whitegrid')
# 스타일 테마 설정

fig = plt.figure(figsize = (15, 5))
ax1 = fig.add_subplot(1,3,1)
ax2 = fig.add_subplot(1,3,2)
ax3 = fig.add_subplot(1,3,3)

sns.barplot(x = 'sex', y = 'survived', data = titanic, ax = ax1)
# x축, y축에 변수 할당
sns.barplot(x = 'sex', y = 'survived', hue = 'class', data = titanic, ax = ax2)
# x축, y축에 변수 할당 / hue 옵션 추가(class 별로 색상 다르게)
sns.barplot(x = 'sex', y = 'survived', hue = 'class', dodge = False, data = titanic, ax = ax3)
# # x축, y축에 변수 할당 / hue 옵션 추가(class 별로 색상 다르게) / 누적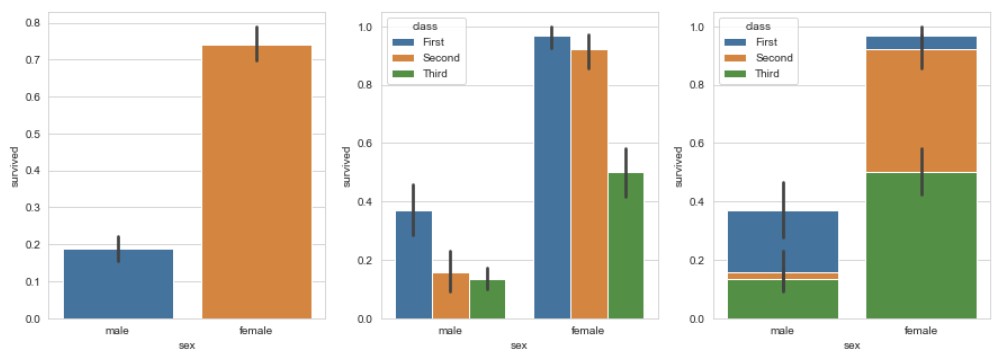
6) 빈도 그래프
import seaborn as sns
import matplotlib.pyplot as plt

titanic = sns.load_dataset('titanic')

sns.set_style('whitegrid')
# 스타일 테마 설정

fig = plt.figure(figsize = (15, 5))
ax1 = fig.add_subplot(1,3,1)
ax2 = fig.add_subplot(1,3,2)
ax3 = fig.add_subplot(1,3,3)

sns.countplot(x = 'class', palette = 'Set1', data = titanic, ax = ax1)
# 기본값
# palette를 다르게 하여 색상 변경 가능

sns.countplot(x = 'class', hue = 'who', palette = 'Set2', data = titanic, ax = ax2)
# who 별로 다르게 하여 색상 표현

sns.countplot(x = 'class', hue = 'who', palette = 'Set3', dodge = False, data = titanic, ax = ax3)
# who 별로 다르게 하여 색상 표현
# 누적 출력

plt.show()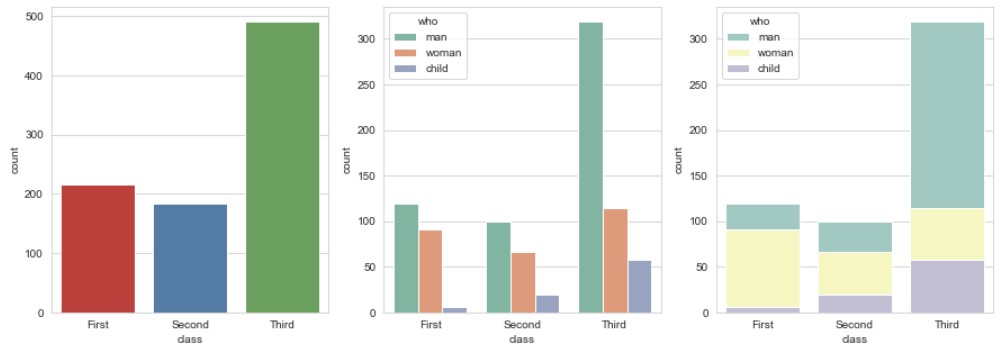
7) 박스 플롯/바이올린 그래프
import seaborn as sns
import matplotlib.pyplot as plt

titanic = sns.load_dataset('titanic')

sns.set_style('whitegrid')
# 스타일 테마 설정

fig = plt.figure(figsize = (15, 10))
ax1 = fig.add_subplot(2,2,1)
ax2 = fig.add_subplot(2,2,2)
ax3 = fig.add_subplot(2,2,3)
ax4 = fig.add_subplot(2,2,4)

sns.boxplot(x = 'alive', y = 'age', data = titanic, ax = ax1)
# 박스 플롯 (기본값)

sns.boxplot(x = 'alive', y = 'age', hue = 'sex', data = titanic, ax = ax2)
# 성별을 나눠서 박스 플롯을 그림

sns.violinplot(x = 'alive', y = 'age', data = titanic, ax = ax3)
# 바이올린 그래프 (기본값)

sns.violinplot(x = 'alive', y = 'age', hue = 'sex', data = titanic, ax = ax4)
# 성별을 나눠서 바이올린 그래프를 그림

plt.show()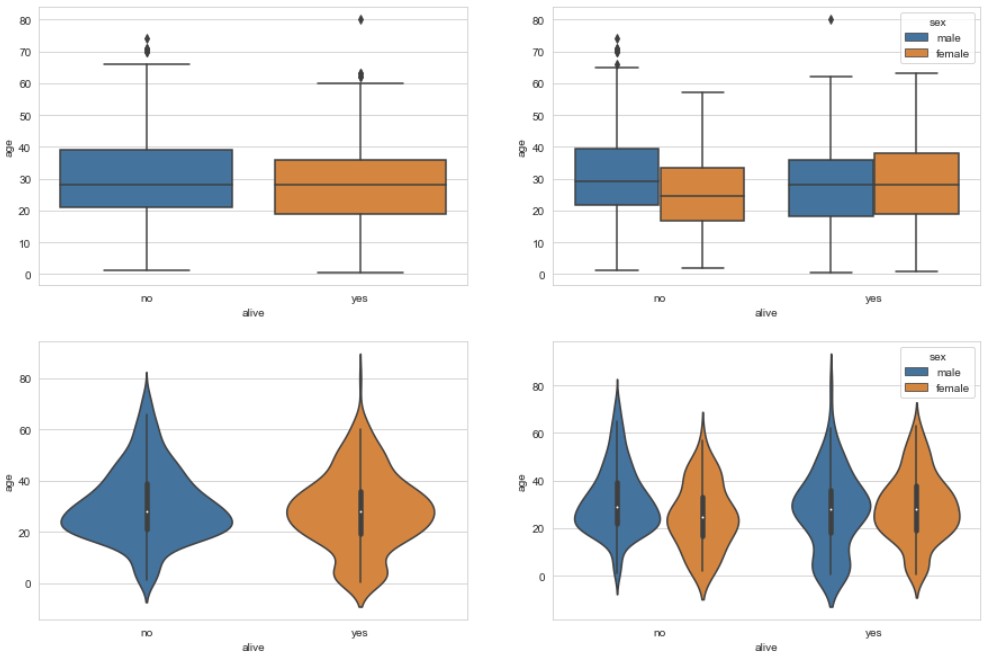
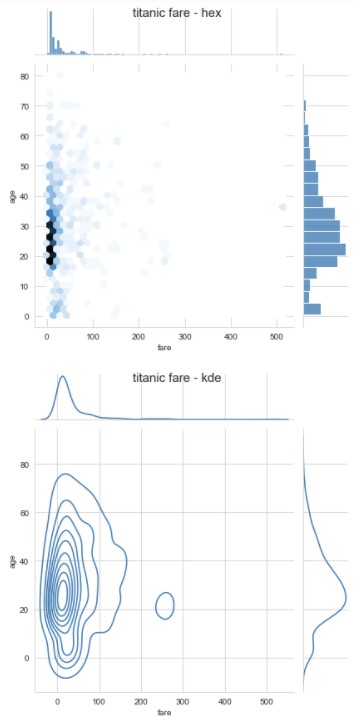
8) 조인트 그래프
조인트 그래프는 산점도를 기본으로 표시하고
x-y축에 각 변수에 대한 히스토그램을 동시에 보여줌
: 두 변수의 관계와 데이터가 분산되어 있는 정도를 한눈에 파악하기 좋음
import seaborn as sns
import matplotlib.pyplot as plt

titanic = sns.load_dataset('titanic')

sns.set_style('whitegrid')
# 스타일 테마 설정

j1 = sns.jointplot(x = 'fare', y = 'age', data = titanic)
# 산점도
j2 = sns.jointplot(x = 'fare', y = 'age', kind = 'reg', data = titanic)
# 회귀선
j3 = sns.jointplot(x = 'fare', y = 'age', kind = 'hex', data = titanic)
# 육각 그래프
j4 = sns.jointplot(x = 'fare', y = 'age', kind = 'kde', data = titanic)
# 커럴 밀집 그래프

j1.fig.suptitle('titanic fare - scatter', size = 15)
j2.fig.suptitle('titanic fare - reg', size = 15)
j3.fig.suptitle('titanic fare - hex', size = 15)
j4.fig.suptitle('titanic fare - kde', size = 15)

plt.show()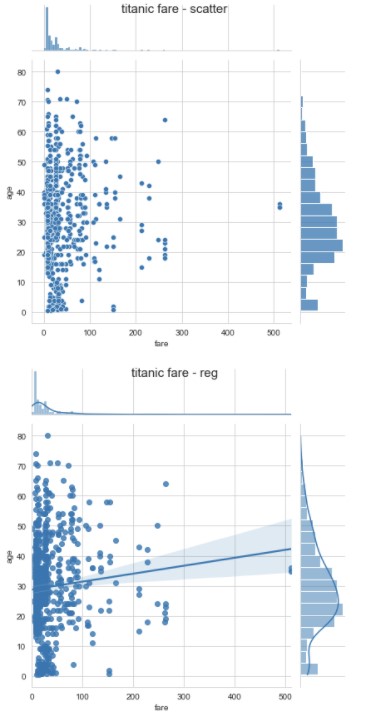
9) 조건을 적용하여 화면을 그리드로 분할하기
import seaborn as sns
import matplotlib.pyplot as plt

titanic = sns.load_dataset('titanic')

sns.set_style('whitegrid')
# 스타일 테마 설정

g = sns.FacetGrid(data = titanic, col = 'who', row = 'survived')
# 조건에 따라 그리드 나누기
# who열과 row열에 따라 나누기

g = g.map(plt.hist, 'age')
# 그래프 적용하기
# 각 조건에 맞는 탑승객을 구분하여 age열의 나이를 기준으로 히스토그램을 그림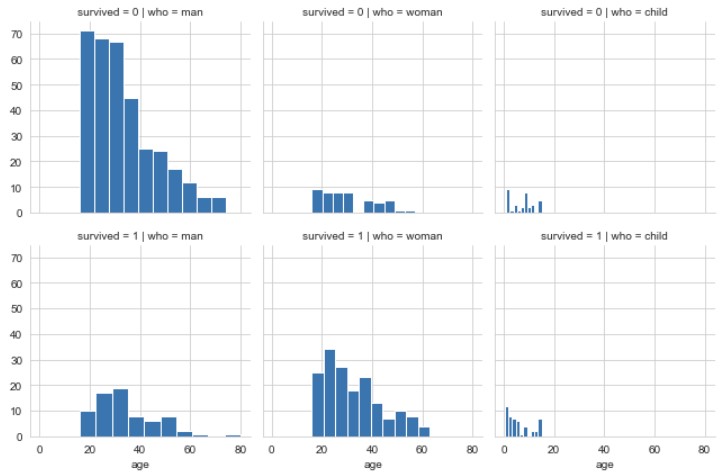
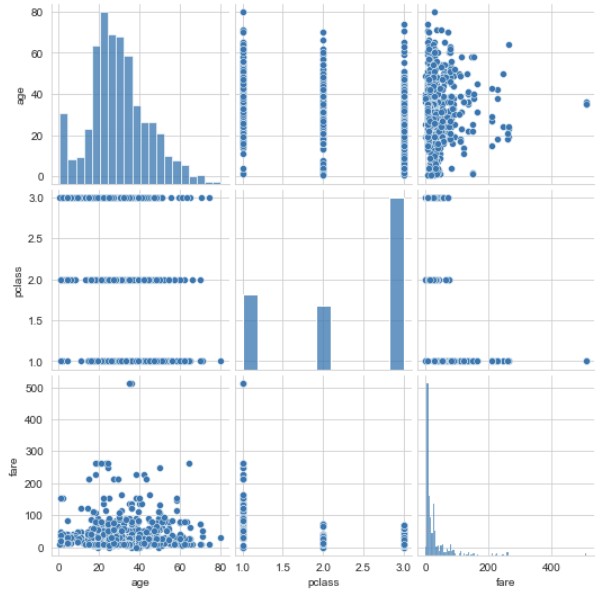
10) 이변수 데이터의 분포
pairplot() 함수는 인자로 전달되는 데이터프레임의 열을
2개씩 짝을 지을 수 있는 모든 조합에 대해 표현함
import seaborn as sns
import matplotlib.pyplot as plt

titanic = sns.load_dataset('titanic')

sns.set_style('whitegrid')
# 스타일 테마 설정

titanic_pair = titanic[['age', 'pclass', 'fare']]
# 3개의 변수 선택
g = sns.pairplot(titanic_pair)
# 조건에 따라 그리드 나누기
# 변수가 3개이므로, 3*3 = 9개의 그리드가 만들어짐