
import numpy as np
import pandas as pd
import matplotlib.pyplot as plt
import seaborn as sns
from sklearn.preprocessing import LabelEncoder
from sklearn.model_selection import train_test_split
from sklearn.metrics import r2_score, mean_squared_error
from sklearn.linear_model import LogisticRegression, SGDClassifier
from sklearn.metrics import RocCurveDisplay, roc_auc_score‣ data : raisin data
‣ 7개의 feature 들 중 4개를 골라, Class를 예측하는 분류기를 만들기.
pd_data = pd.read_csv('Raisin_Dataset.csv', encoding = 'cp949')
pd_data.head()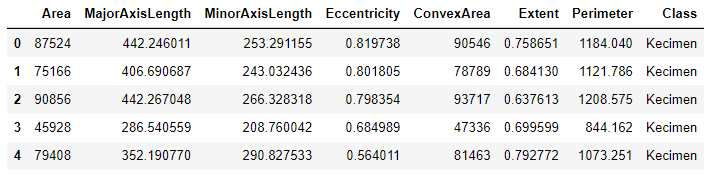
Label Encoding
sklearn LabelEncoding
print(pd_data['Class'].unique())

# ['Kecimen' 'Besni']

encoder = LabelEncoder()
pd_data['Class'] = encoder.fit_transform(pd_data['Class'])
pd_data.head()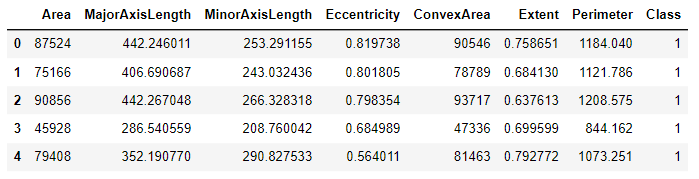
using pandas category dtype
pd_data = pd.read_csv('Raisin_Dataset.csv', encoding = 'cp949')

pd_data['Class'] = pd_data['Class'].astype('category').cat.codes
custom category dtype
from pandas.api.types import CategoricalDtype

pd_data = pd.read_csv('Raisin_Dataset.csv', encoding = 'cp949')

myclass_dtype = CategoricalDtype(['Kecimen','Besni'], ordered = True)  # 순서 바꾸면 1,0 이 됨.
pd_data['Class'] = pd_data['Class'].astype(myclass_dtype).cat.codes
독립변수 4가지 선택하기
단, 독립변수들 사이에는 서로 상관도가 있으면 안된다는 것 주의 !
g1 = pd_data.groupby('Class')
print(g1.mean())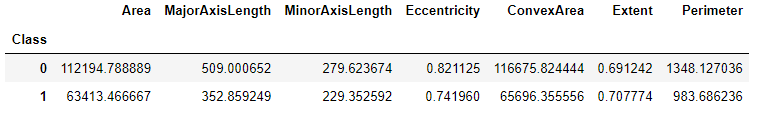
Class 별로 평균의 차이가 큰 변수 4개를 골라서 Class를 예측하면 성능이 좋을 것으로 예상한다.
⇛ Area, MajorAxisLength, Eccentricity, Perimeter 4가지 변수를 독립변수로 사용하겠다.
X = pd_data[['Area','MajorAxisLength', 'Eccentricity', 'Perimeter']]
y = pd_data['Class']
Scaling
- MinMaxScaler
from sklearn.preprocessing import MinMaxScaler

scaler = MinMaxScaler()
X = scaler.fit_transform(X)
print(X)
# [[0.29637031 0.28071404 0.7678721  0.27179088]
#  [0.23742726 0.23463777 0.73863618 0.24184205]
#  [0.31226271 0.2807413  0.73300911 0.28359405]
#  ...
#  [0.3542402  0.26705647 0.60801693 0.32412604]
#  [0.32498331 0.32490187 0.81025935 0.3076348 ]
# [0.28723648 0.37121445 0.91069529 0.3145209 ]]- StandardScaler
from sklearn.preprocessing import StandardScaler

scaler = StandardScaler()
X = scaler.fit_transform(X)
print(X)
# [[-0.00718637  0.09757695  0.42314164  0.06627397]
#  [-0.32421719 -0.20901207  0.22447639 -0.16125245]
#  [ 0.07829241  0.09775835  0.18623907  0.15594468]
#  ...
#  [ 0.30407232  0.00670023 -0.6631136   0.46387322]
#  [ 0.14671134  0.39160036  0.71117344  0.3385864 ]
#  [-0.05631357  0.69976181  1.39366043  0.39090133]]
모형적합
X_train, X_test, y_train, y_test = train_test_split(X, y, stratify=y, random_state = 10)

m = LogisticRegression(solver = 'liblinear')
m.fit(X_train, y_train)
pred = m.predict(X_test)
성능평가
print(roc_auc_score(y_test, pred))
# 0.8488859039190897

RocCurveDisplay.from_predictions(y_test, pred)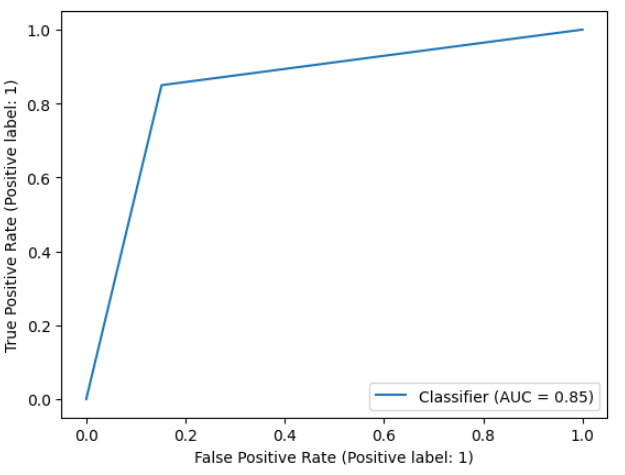

데이터 분석 / 데이터 사이언티스트 / AI 딥러닝