
import numpy as np
import pandas as pd
import seaborn as sns
🛻 catplot
catplot은 category별 분포를 나타내준다.
따라서, x축 변수는 categorical var이 들어가야한다.
⌨️ stripplot : default plot
sns.catplot(pd_pen, x='species', y ='bill_length_mm')
sns.catplot(pd_pen, x='species', y ='bill_length_mm', jiter=0.25)
sns.catplot(pd_pen, x='species', y ='bill_length_mm', jiter=0.25, hue= 'sex')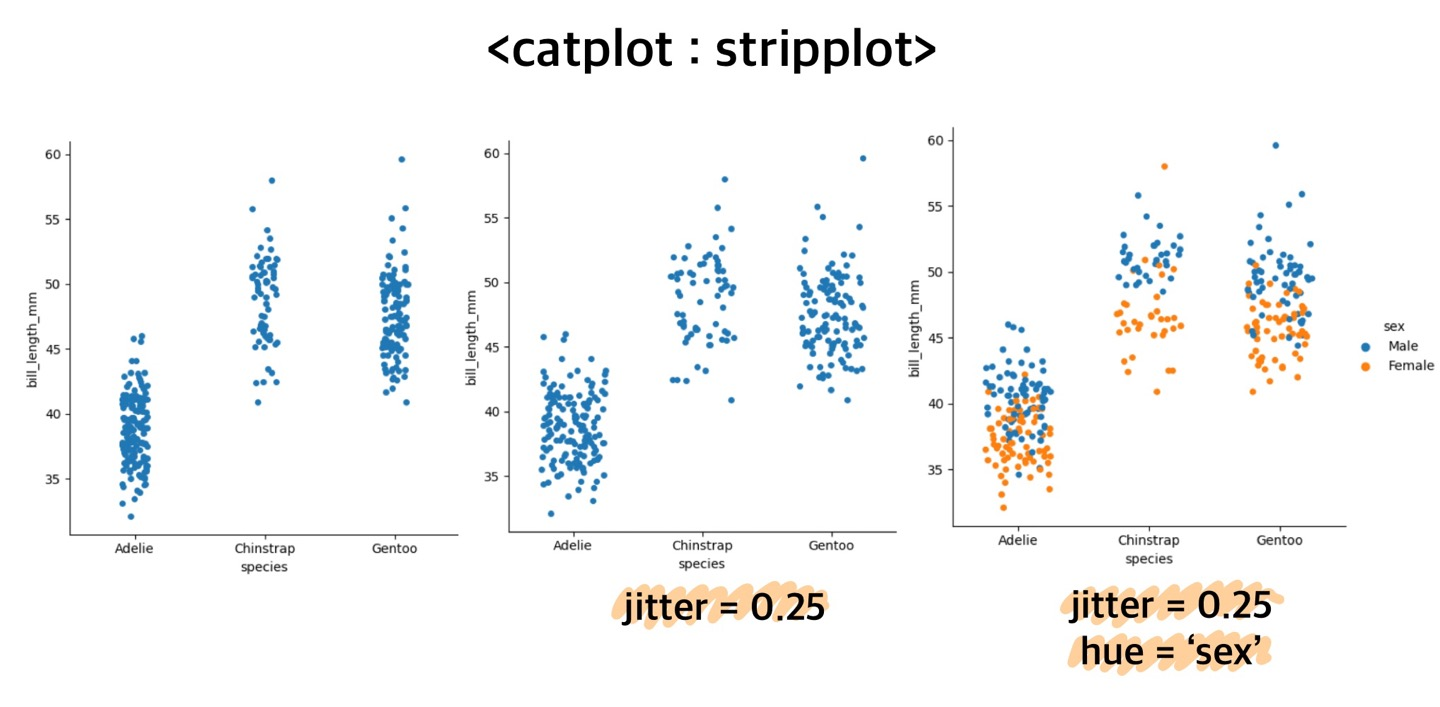 species = 'Adelie'의 bill_length 가 다른 종들에 비해 짧고,
모든 종에 대해서 sex = Female 의 bill_length 가 대체적으로 더 짧다는 것을 알 수 있다.
species = 'Adelie'의 bill_length 가 다른 종들에 비해 짧고,
모든 종에 대해서 sex = Female 의 bill_length 가 대체적으로 더 짧다는 것을 알 수 있다.
.
.
⌨️ swarmplot
kind = 'swarm'
sns.catplot(pd_pen, x='species', y ='bill_length_mm', kind = 'swarm')
sns.catplot(pd_pen, x='species', y ='bill_length_mm', kind = 'swarm', hue = 'sex')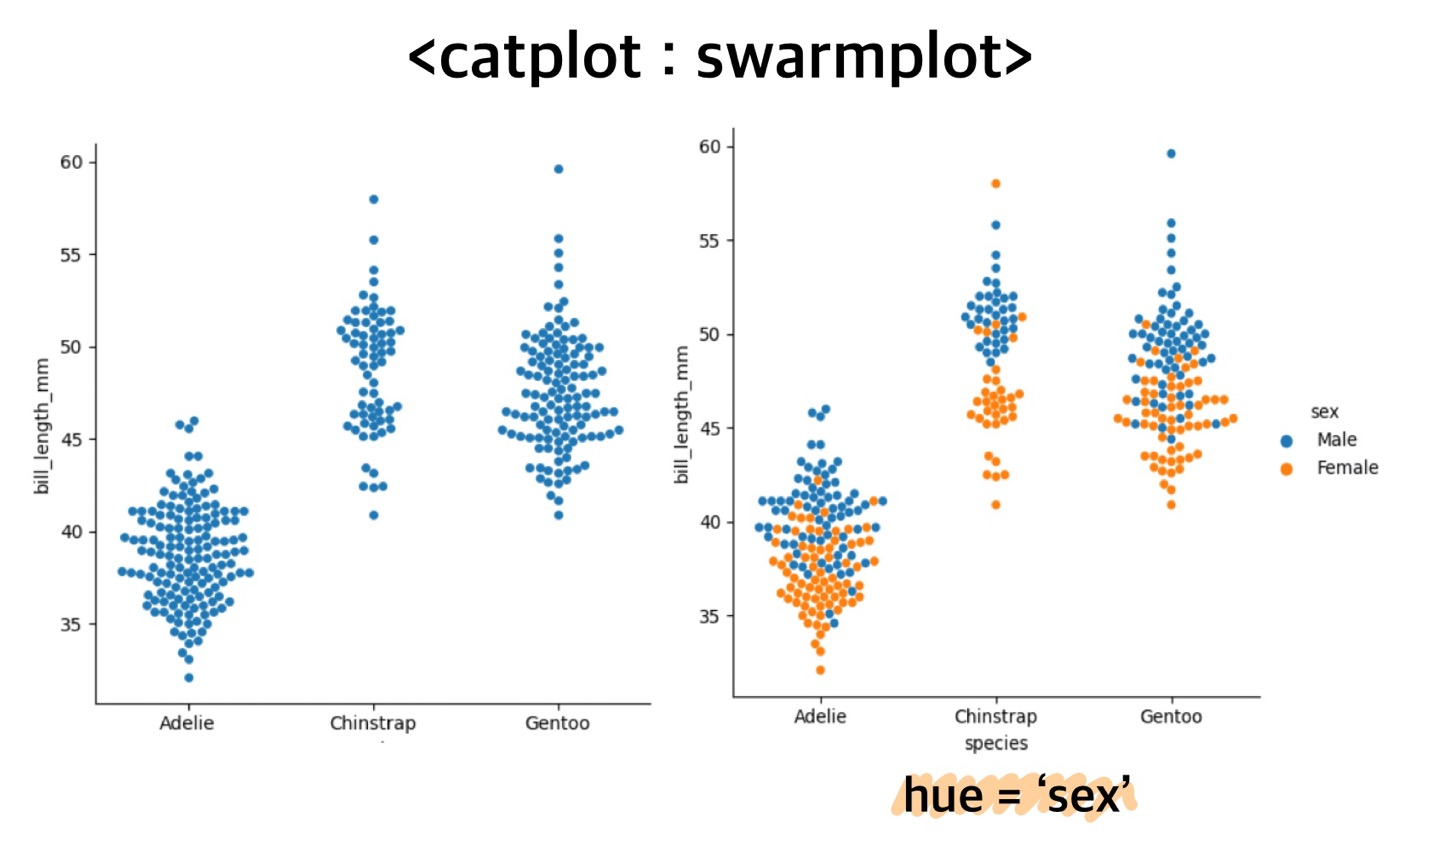
.
.
⌨️ boxplot
⌨️ violinplot
kind = 'violin' : 각 category별 kde 곡선 + boxplot
sns.catplot(pd_pen, x='species', y ='bill_length_mm',kind = 'violin')
# 좌우대칭임.
sns.catplot(pd_pen, x='species', y ='bill_length_mm',kind = 'violin', hue='sex')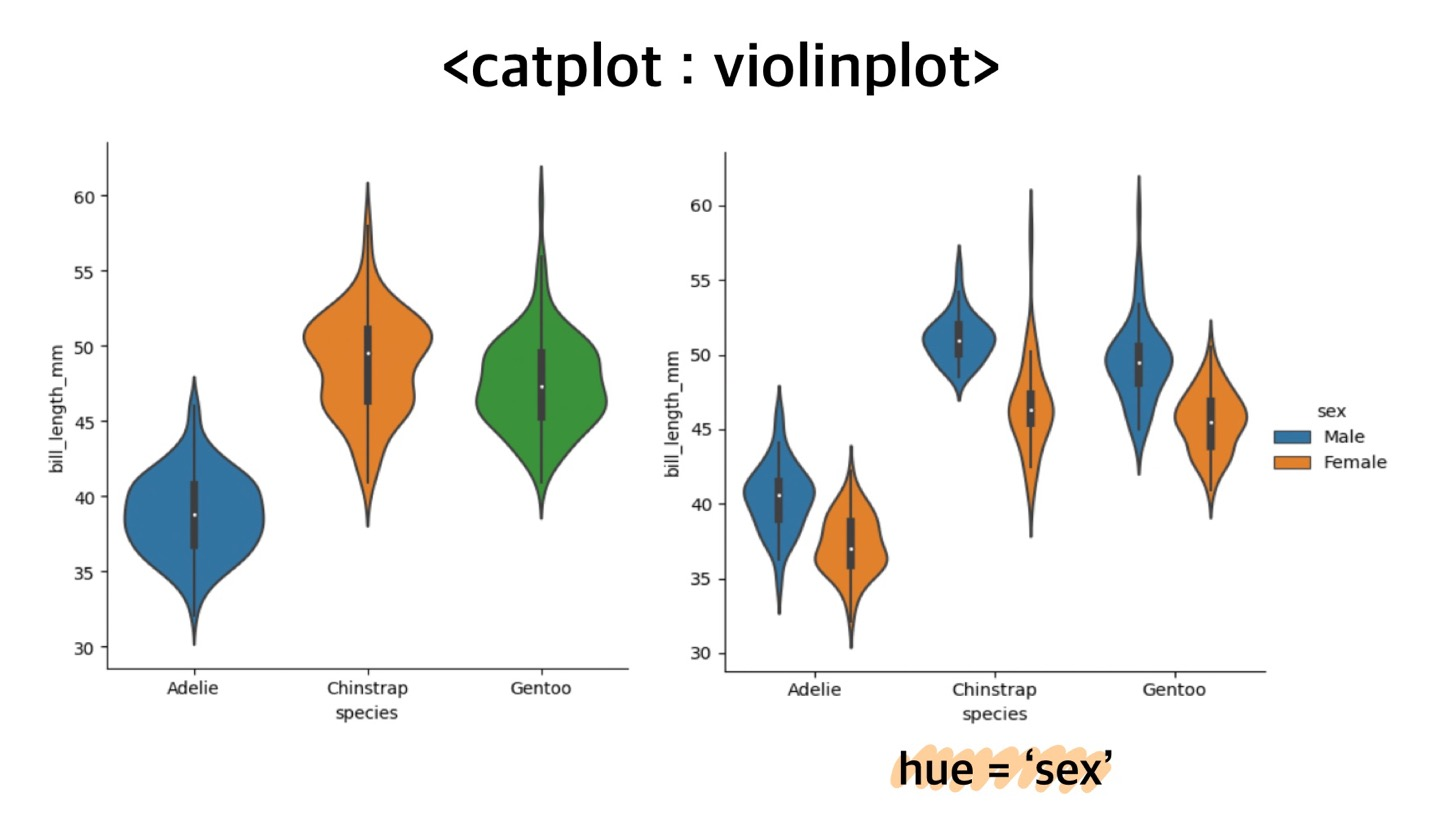
.
.
⌨️ barplot
- 이변량(bivariate) 분석을 위한 plot이다.
- x축에는 범주형 변수 / y축에는 연속형 변수를 넣는다
.
.
⌨️ boxenplot
kind = 'boxen' : boxplot + 분포
sns.catplot(pd_pen, x='species', y ='bill_length_mm', kind = 'boxen')
sns.catplot(pd_pen, x='species', y ='bill_length_mm', kind = 'boxen', hue = 'sex')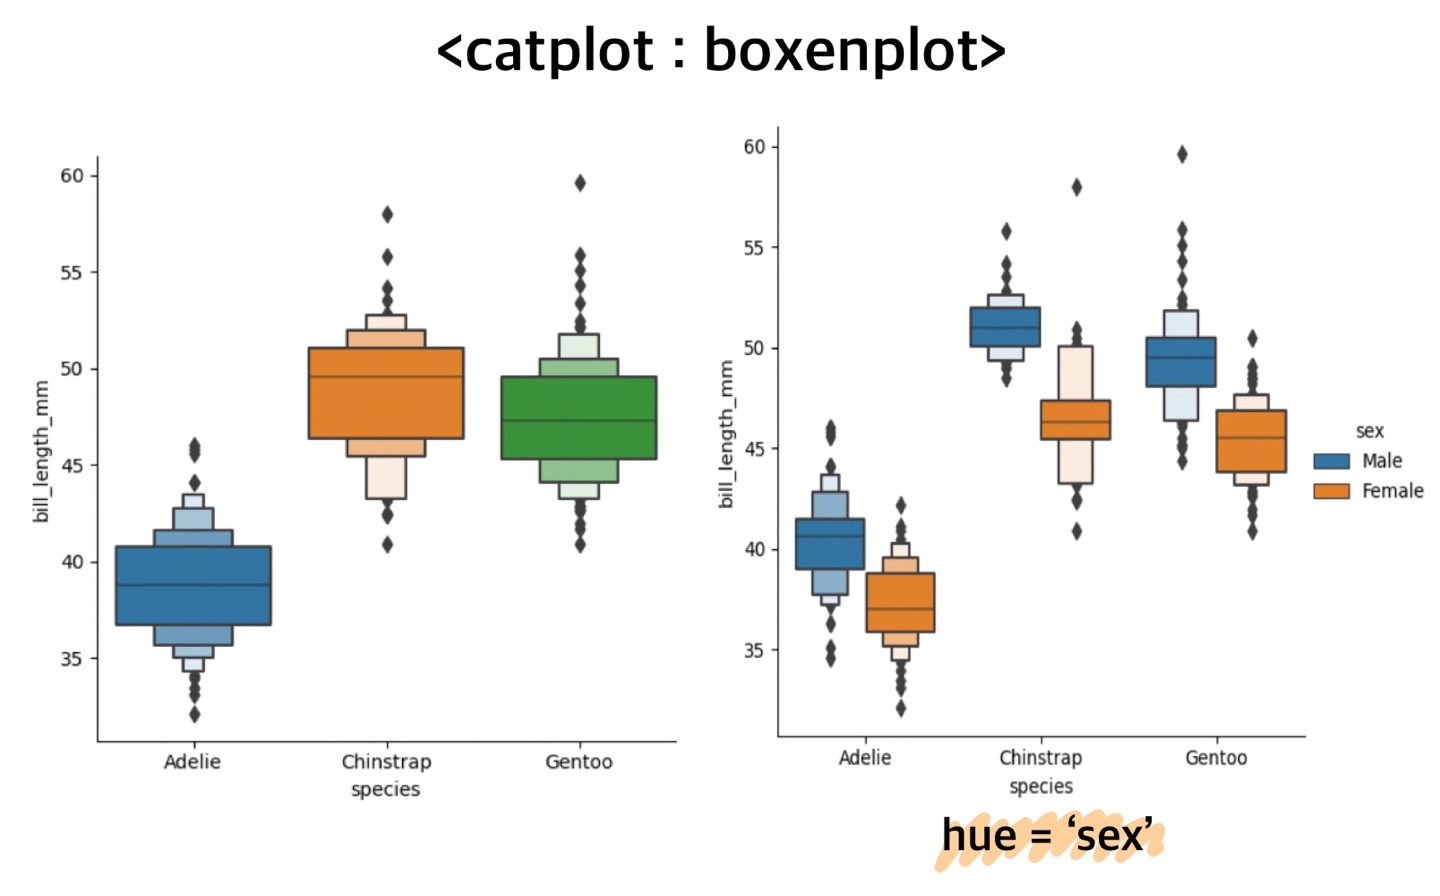

데이터 분석 / 데이터 사이언티스트 / AI 딥러닝