0. 이번 포스트의 주제
[DataBase]DB Query Optimization(Index) 아티클을 통해 데이터베이스 인덱스에 대해 간단하게 알아보았다.
이커머스 시스템에서 기능별로 고도화 작업을 진행하고 있는데,
1. DB Lock을 통한 동시성 제어방법
2. 캐싱을 이용한 성능개선
을 진행하였다.
이번엔 인덱스를 추가하여 얼마나 성능 개선이 되는지 알아보려고 한다.
1. 어디에 적용하면 좋을까?
인덱스가 적용되어야 하는 곳.
- 데이터 중복이 적어 한번에 찾을 수 있어야하고
- 데이터 삽입, 수정이 적은 컬럼
- 조회에 자주 사용되며
- 규모가 작지 않은 테이블
에서 사용되어야 한다.
조회가 많이 일어나는 곳?
이커머스에서 사용되는 기능 중 조회가 많이 일어나는 곳은
- 상품 조회
- 주문 조회
- 랭킹 시스템
- 포인트 조회
UPDATE, DELETE가 적은 곳
- 랭킹 시스템
- 주문 정보를 조회만 하며 update나 delete가 쿼리 내에서 일어나지 않는다.
- 주문 조회
- 주문 정보가 INSERT는 되지만 UPDATE나 DELETE는 잘 일어나지 않는다.
- 더군다나 내 주문 테이블에는 배송 상태에 대한 값이 없으므로 더욱더 수정이 일어날 일이 없다.
- 상품 조회
- 상품 재고에 대한 변경은 자주 일어나지만 상품 정보자체에 대한 변경은 잘 일어나지 않으므로 적절하다.
- 포인트 조회
- 포인트 금액은 변하지만 한번 들어간 고객정보는 변하지 않는다.
2. K6를 이용한 부하테스트
Dummy Data 생성
-- 고객 더미 데이터 생성
INSERT INTO customer (balance)
SELECT FLOOR(RAND() * 100000)
FROM dual
LIMIT 10000;

-- product 테이블에 100개의 상품 데이터 생성
INSERT INTO product (product_nm, price, category)
SELECT
    CONCAT('Product_', LPAD(seq.seq, 3, '0')),
    FLOOR(RAND() * 1000) + 1000,  -- 가격은 1000~1999 사이로 설정
    CASE WHEN RAND() < 0.5 THEN 'category1' ELSE 'category2' END
FROM
    (SELECT @rownum := @rownum + 1 AS seq FROM (SELECT 1 UNION SELECT 2 UNION SELECT 3 UNION SELECT 4) a,
          (SELECT 1 UNION SELECT 2 UNION SELECT 3 UNION SELECT 4) b,
          (SELECT 1 UNION SELECT 2 UNION SELECT 3 UNION SELECT 4) c,
          (SELECT 1 UNION SELECT 2 UNION SELECT 3 UNION SELECT 4) d,
          (SELECT 1 UNION SELECT 2 UNION SELECT 3 UNION SELECT 4) e,
          (SELECT @rownum := 0) r
    ) seq
LIMIT 100;

-- product_inventory 테이블에 각 product의 inventory 데이터 생성
INSERT INTO product_inventory (product_id, amount)
SELECT
    product_id,
    FLOOR(RAND() * 50) + 1  -- 재고는 1~50 사이로 설정
FROM
    product
LIMIT 100;


-- 고객 주문 더미 데이터 생성
INSERT INTO customer_order (customer_id)
SELECT
    FLOOR(RAND() * 10000) + 1
FROM dual
LIMIT 10000;

-- 주문 상품 더미 데이터 생성
INSERT INTO order_product (order_id, product_id, amount, price)
SELECT
    FLOOR(RAND() * 10000) + 1,
    FLOOR(RAND() * 10000) + 1,
    FLOOR(RAND() * 10) + 1,
    FLOOR(RAND() * 1000) + 1000
FROM dual
LIMIT 10000;

-- 장바구니 더미 데이터 생성
INSERT INTO cart (customer_id, product_id, amount)
SELECT
    FLOOR(RAND() * 10000) + 1,
    FLOOR(RAND() * 10000) + 1,
    FLOOR(RAND() * 5) + 1
FROM dual
LIMIT 10000;
2. Ranking API에 K6적용
import http from 'k6/http';
import { sleep } from 'k6';

export default function () {

    let url = 'http://localhost:8080/ranks/2024-11-10\';
    let params = {
        headers: {
            'Content-Type' : 'application/json; charset=utf-8',
        },
    };
    http.get(url, params);
    sleep(1);
}
ranks는 최근 3일간의 판매 Top5를 뽑아내는 API이다.
3. k6 적용 후 성능 테스트
3-1. Ranking API 성능 테스트
js코드가 있는 위치로 가서
k6 run --vus 10(가상 사용자 수) --duration 30s(부하시간) --out csv=test.csv(출력되는 결과물 형식) script.js(실행할 스크립트)
해당 코드를 PowerShell에서 실행시킨다.
3-1-1. 캐싱❌ 인덱싱❌
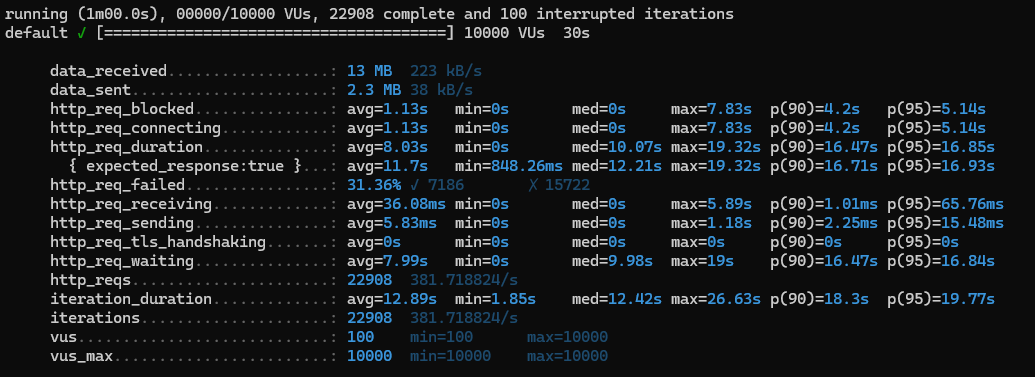
dummyData를 넣어준 날짜로 ranking api를 조회해 보았다.
10000명이 30초동안 몰린다고 생각했을 때 성능이다.
성능 테스트 분석
1) http_req_duration (avg: 8.03s):
평균 8초 이상 소요되는 것은 응답 시간이 상당히 느리다는 뜻이고
최댓값은 19.32초로, 특정 요청은 응답이 매우 오래 걸렸다.
이는 서버가 많은 요청을 동시에 처리하면서 성능 저하가 발생했을 가능성을 보여준다.
2) http_req_failed (31.36%):
테스트 중 31.36%의 요청이 실패한 것으로 나타났다.
요청이 약 1/3정도가 실패한걸 보면 서버가 높은 부하를 감당하지 못했거나 시간 초과 등의 이유로 요청이 실패했을 수 있다.
서버 성능을 높이거나 요청을 효율적으로 분산할 필요가있다.
3) iterations (22,908):
30초 동안 약 22,908회의 요청이 완료되었으며, 100회의 요청이 중단되었다.
이는 10,000명의 가상 사용자가 30초 동안 요청을 발생시켰을 때 수행된 요청 횟수를 의미 한다.
4) iteration_duration (avg: 12.89s):
각 반복에 걸린 시간은 평균 12.89s 이며 사용자 요청이 완료되는 데 걸리는 총 시간이다.
최댓값은 26.63초로, 특정 요청이 완료되는 데 오랜 시간이 소요된 경우가 있었다.
5) http_req_waiting (avg: 7.99s):
요청을 보내고 응답을 받을 때까지의 대기 시간은 평균 7.99초로, 서버가 요청을 처리하는 데 상당한 지연이 있음을 나타낸다.
6) http_req_receiving (avg: 36.08ms):
서버에서 데이터를 전송받는 데 걸리는 시간이다. 평균 36ms로, 전송 시간 자체는 비교적 짧으나 실제 응답이 오기까지의 대기 시간이 길기 때문에 전체 응답 시간에 영향을 미친다고 볼 수 있다.
ranking API에는 캐싱도 적용해 놓았기 때문에 다시한번 실행해 보았다.
3-1-2. 캐싱⭕ 인덱싱❌
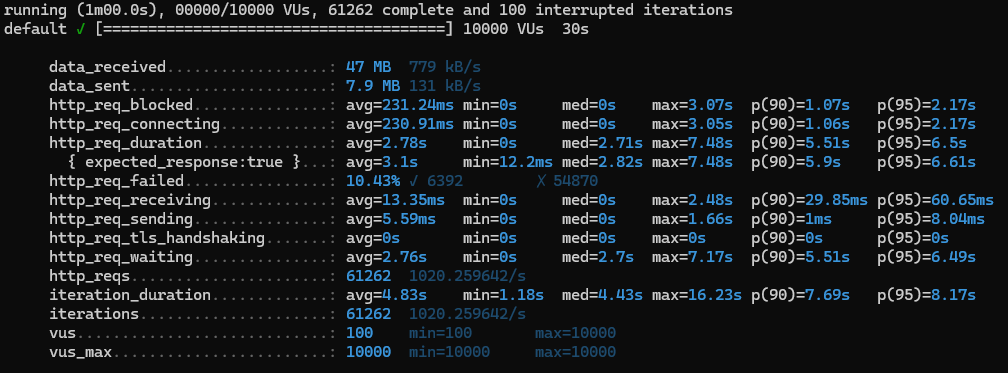
1) http_req_duration (avg: 2.78s):
avg 8s ➡️ avg 2.78s
2) http_req_failed (10.43%):
31.36% ➡️ 10.43%
테스트 중 10.43%의 요청이 실패한 것으로 나타났다.
1/3의 실패에서 1/10으로 줄어들었다.
3) iterations (61262):
30초 동안 약 61262회의 요청이 완료되었으며, 100회의 요청이 중단되었다.
4) iteration_duration (avg: 12.89s):
12.89s ➡️ 4.83s
최대값은 16.23s 로 처음 요청의 26.63초보다 10초 줄어들었다.
5) http_req_waiting (avg: 2.76s):
7.99s ➡️2.76s
6) http_req_receiving (avg: 13.35ms):
36.08ms ➡️ 13.35ms
캐싱을 적용하니 훨씬 빨라졌다.
3-1-3. 캐싱❌ 인덱싱⭕
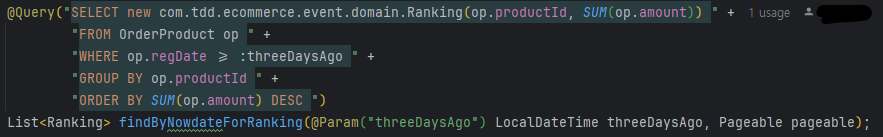
랭킹시스템의 쿼리는 위와같이 되어있다.
어떤 컬럼을 적용하는게 가장 성능을 향상시킬지 알아보자.
1) productId
regDate로 검색해서 집계를 하는 쿼리인데 Cardinality가 높은 컬럼은 현재 productId일 것 같다.
CREATE INDEX idx_produtId ON ORDER_PRODUCT (product_id)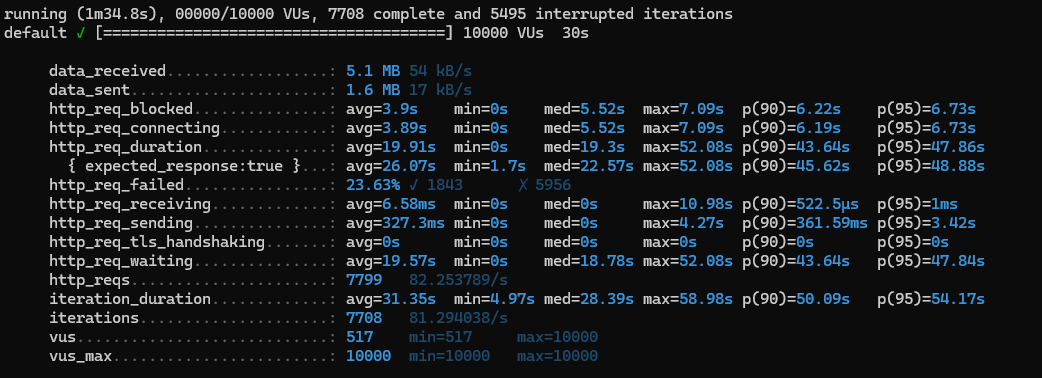
1) http_req_duration (avg: 19.91s):
avg 8s ➡️ avg 19.91s
2) http_req_failed (26.63%):
31.36% ➡️ 26.63%
3) iterations (7708):
22908 ➡️ 7708
4) iteration_duration (avg: 31.35s):
12.89s ➡️ 31.35s
최대가 58.98s
5) http_req_waiting (avg: 19.57s):
7.99s ➡️ 19.57s
6) http_req_receiving (avg: 6.58ms):
36.08ms ➡️ 6.58ms
👉🏻 http_req_receiving 을 제외하곤 전부 성능이 더 악화됐다!!!
내가 생각한 인덱스가 단단히 잘못 걸린 듯 하다.
2) regDate
앞의 productId 인덱스를 삭제하고 regDate로 설정해보았다.
ALTER TABLE order_product DROP INDEX idx_produtId;

CREATE INDEX idx_regDate ON ORDER_PRODUCT (reg_date);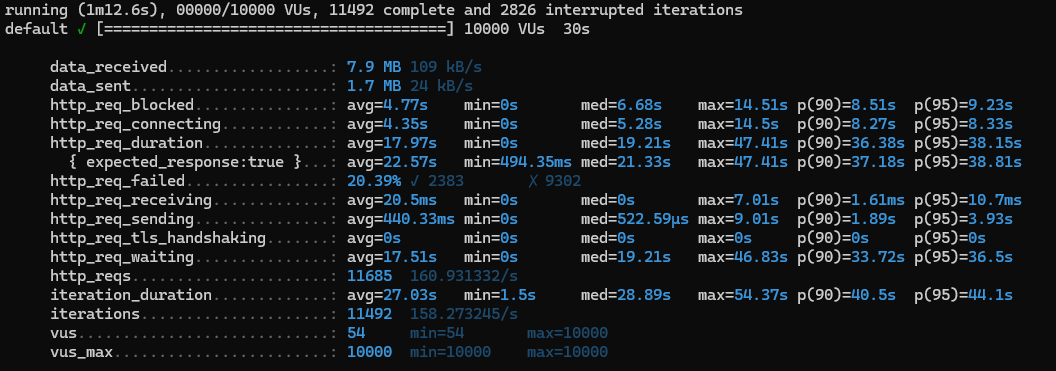
흠..? 딱봐도 성능이 더 안좋아졌다!!!!??
3-1-4 캐싱 ⭕ 인덱싱⭕

1) http_req_duration (avg: 5.96s):
avg 8s ➡️ avg 5.96s
2) http_req_failed (19.18%):
31.36% ➡️ 19.18%
3) iterations (27522):
4) iteration_duration (avg: 10.25s):
12.89s ➡️ 10.25s
최대값은 20.11s
5) http_req_waiting (avg: 5.77s):
7.99s ➡️ 5.77s
6) http_req_receiving (avg: 13.35ms):
36.08ms ➡️ 13.35ms
👉🏻 해당 API에서는 Index를 적용하면 성능이 더 악화되므로 성능개선을 위해선 Index사용 보다는 캐시사용이 적절하다.(?)
3-2. 주문 조회 API
주문 조회는 주문번호를 이용한 단건 조회로 이루어지므로 캐시를 따로 사용하지않는다.
그러므로 인덱스 유무에 따른 성능 테스트만 해보려고한다.
3-2-1. 인덱스❌
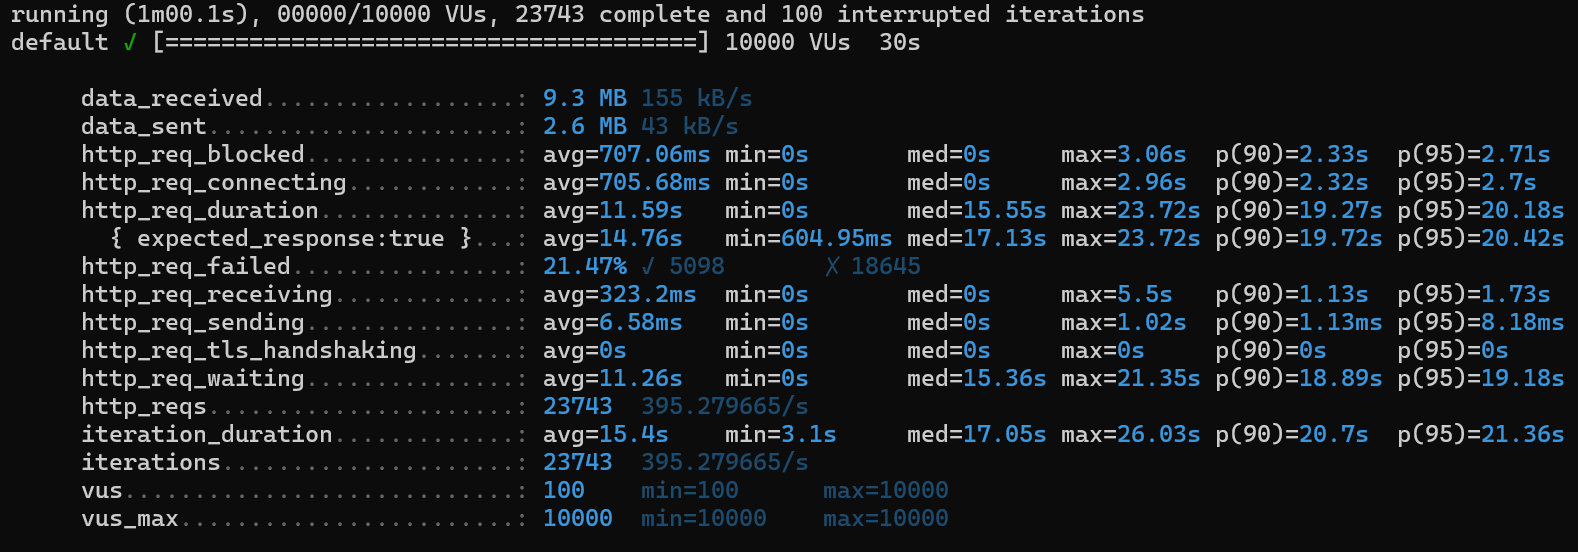
1) http_req_duration (avg: 15.4s)
2) http_req_failed (21.47%)
3) iterations (23743):
4) iteration_duration (avg: 15.4s)
5) http_req_waiting (avg: 11.26s)
6) http_req_receiving (avg: 323.2ms)
3-2-2. 인덱스⭕(customer_order테이블만)
CREATE INDEX idx_orderId ON CUSTOMER_ORDER (order_id);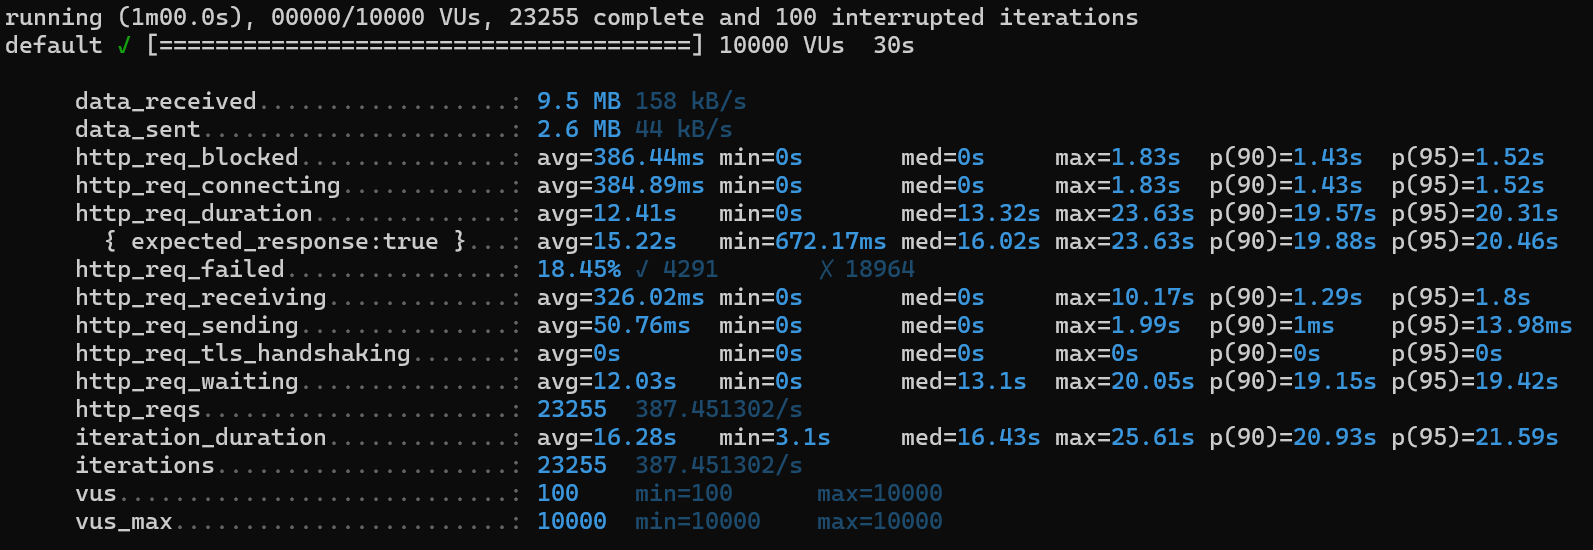
1) http_req_duration
avg 15.4s ➡️ avg 12.41s
2) http_req_failed
21.47% ➡️ 18.45%
3) iterations
23743 ➡️ 23255
4) iteration_duration
15.4s ➡️ 16.28s
5) http_req_waiting
avg 11.26s ➡️ 12.03s
6) http_req_receiving
avg 323.2ms ➡️ avg 326.02ms
👉🏻일정 부분에서 미세한 성능 향상이 일어났지만 눈에 띄는 변화는 아닌듯 하다.
왜냐하면 MySQL에서는 기본적으로 PK가 클러스터 인덱스이며, PK가 없으면 내부적으로 PK를 만들어내므로 모든 테이블이 클러스터링 테이블이라고 볼 수 있다.
이미 인덱스로 설정되어있는 pk에 또 인덱스를 건 격이다.
3-2-3. 인덱스⭕(order_product 인덱스 추가)
CREATE INDEX idx_orderId ON ORDER_PRODUCT (order_id);주문 정보 조회는 customer_order테이블과 order_product를 함께 조회하고 있어 두 곳 모두 order_id로 인덱스를 걸어주었다.
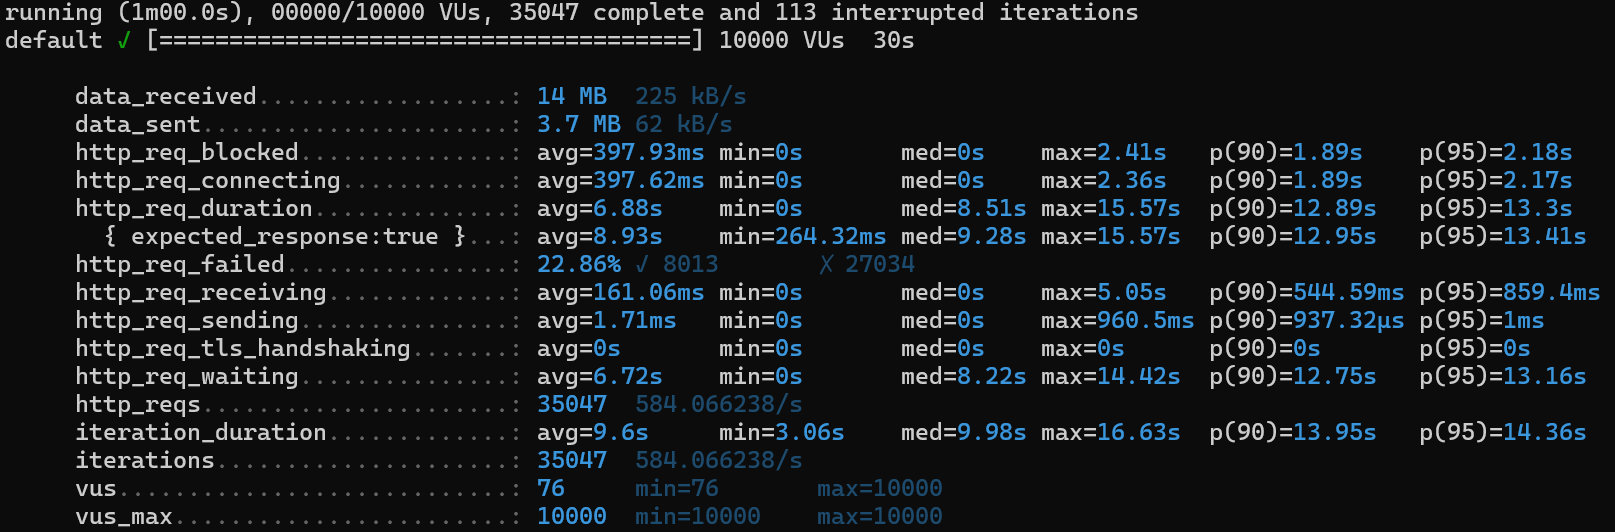
1) http_req_duration
avg 15.4s ➡️ avg 12.41s ➡️ avg 6.88s ✔️
2) http_req_failed
21.47% ➡️ 18.45% ➡️ 22.86%
3) iterations
23743 ➡️ 23255 ➡️35047
4) iteration_duration
15.4s ➡️ 16.28s ➡️ 9.6s ✔️
5) http_req_waiting
avg 11.26s ➡️ 12.03s ➡️ 6.72s ✔️
6) http_req_receiving
avg 323.2ms ➡️ avg 326.02ms ➡️ 161.06ms ✔️
👉🏻 같은 조회 쿼리를 같은 횟수로 전송하였는데 속도가 눈에 띄게 줄어들었다!
3-3. 상품 조회API
CREATE TABLE product (
     product_id INT PRIMARY KEY AUTO_INCREMENT,
     product_nm VARCHAR(255) NOT NULL,
     price INT NOT NULL,
     category VARCHAR(10) DEFAULT 'etc',
     reg_date TIMESTAMP DEFAULT CURRENT_TIMESTAMP,
     edit_date TIMESTAMP DEFAULT CURRENT_TIMESTAMP ON UPDATE CURRENT_TIMESTAMP
);

CREATE TABLE product_inventory (
    id INT PRIMARY KEY AUTO_INCREMENT,
    product_id INT NOT NULL,
    amount INT NOT NULL,
    reg_date TIMESTAMP DEFAULT CURRENT_TIMESTAMP,
    edit_date TIMESTAMP DEFAULT CURRENT_TIMESTAMP ON UPDATE CURRENT_TIMESTAMP
);
상품 테이블과 상품 재고 테이블이다.
pk는 각각 product_id, id에 걸려있다.
product_id로 조인되는 형태이므로 위의 결과를 참고하여 예상해보았을 때, product_inventory의 product_id에 index를 건다면 성능향상의 이점을 볼 수 있을 것이다.
 @GetMapping()
    public ResponseEntity<?> getProductsInStock() {
        try{
            List<ProductInfo> products = productFacade.getProducts();

            return ResponseUtil.buildSuccessResponse("현재 재고가 있는 상품들입니다.", products);
        }
        catch(BusinessException e){
            log.warn(ECommerceExceptions.OUT_OF_STOCK.getMessage());
            return ResponseUtil.buildErrorResponse(ECommerceExceptions.OUT_OF_STOCK, ECommerceExceptions.OUT_OF_STOCK.getMessage());
        }
    }
http://localhost:8080/products 는 재고가 존재하는 상품을 모두 반환한다.
import http from 'k6/http';
import { sleep } from 'k6';

export default function () {

    let url = 'http://localhost:8080/products';
    let params = {
        headers: {
            'Content-Type' : 'application/json; charset=utf-8',
        },
    };
    http.get(url, params);
    sleep(1);
}
현재 상품 데이터를 100개 넣어놨고 재고가 0인 상품은 없으므로
고객 한명 당 100개의 데이터를 반환해야한다.
인덱스를 적용하지 않으면 조회만 하는데 굉장한 부하가 생길것이다.
(1000개 했다가 뻗어서 100개로 줄임..)
3-3-1. 인덱스❌ 캐시❌
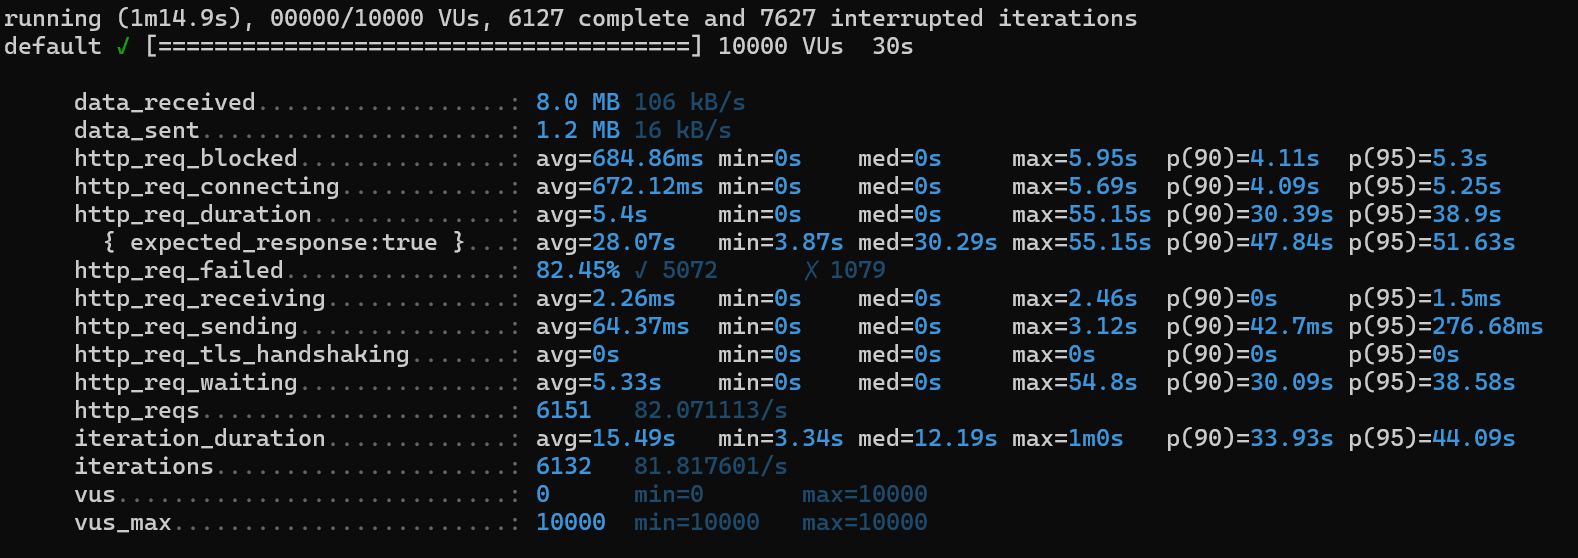
1) http_req_duration (avg: 5.4s)
2) http_req_failed (82.45%)
3) iterations (6132):
4) iteration_duration (avg: 15.49s)
5) http_req_waiting (avg: 5.33s)
6) http_req_receiving (avg: 2.26ms)
3-3-2. 인덱스(product_id)⭕ 캐시❌
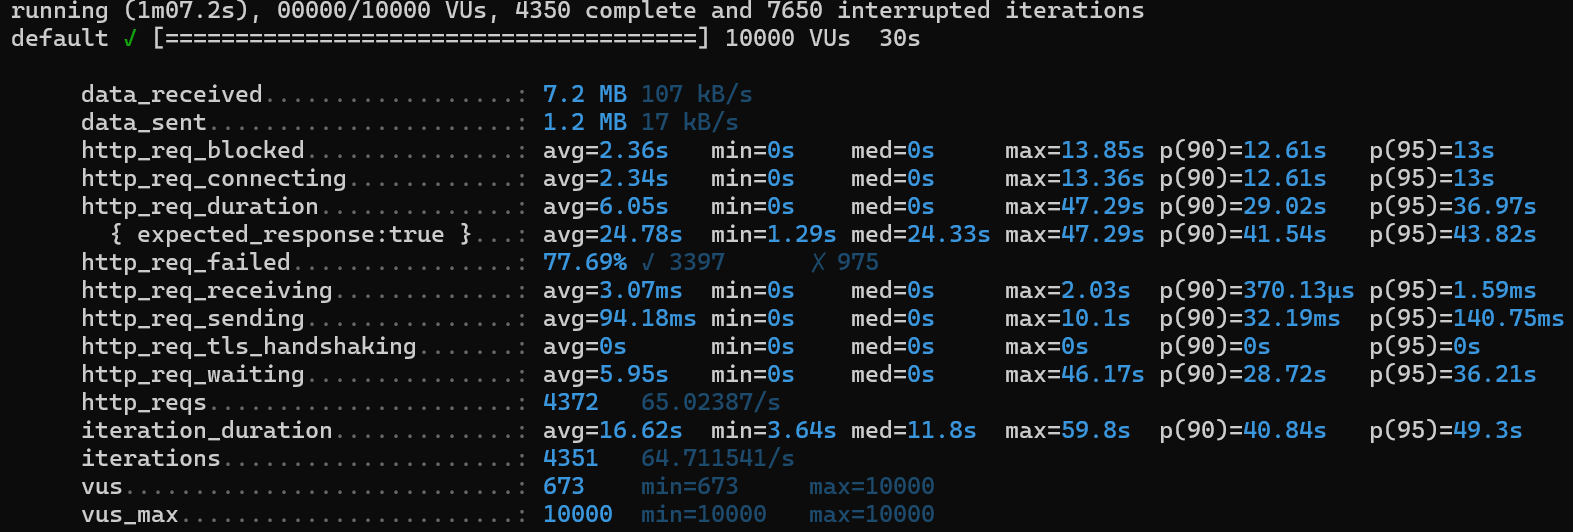
1) http_req_duration
avg 5.4s ➡️ avg 16.62s
2) http_req_failed
82.45% ➡️ 77.69%
3) iterations
6132 ➡️ 4351
4) iteration_duration
15.49s ➡️ 16.62s
5) http_req_waiting
avg 5.33s ➡️ 5.95s
6) http_req_receiving
avg 2.26ms ➡️ 3.07ms
성능이 더 안 좋아졌다!!!!
그 이유는 List<ProductInfo> products = productFacade.getProducts()
여기에 있다.
public List<ProductServiceResponse> getProducts(){
        List<ProductInventory> productInventories = productInventoryRepository.findProductsByAmountGreaterThanZero();

        if (productInventories == null) {
            throw new BusinessException(ECommerceExceptions.OUT_OF_STOCK);
        }

        return productInventories.stream()
                .map(inventory -> {
                    Product product = productRepository.findByProductId(inventory.getProductId());

                    return new ProductServiceResponse(
                            product.getProductId(),
                            product.getProductName(),
                            product.getCategory(),
                            product.getPrice(),
                            inventory.getAmount()
                    );
                }).collect(Collectors.toList());

    }
productInventoryRepository.findProductsByAmountGreaterThanZero 여기에서 재고가 있는 상품의 product_id를 뽑아서 리스트로 받아온 뒤 product테이블에서 다시 product_id로 조회하는데, 상품 개수가 작을 때는 문제없이 반환되지만
조회 결과가 많으면 성능저하의 원인인 ✔️N+1문제가 발생할 수 있다.
ProductInventory 데이터가 많아질수록, 각 Product를 개별적으로 조회하기 때문에 데이터베이스와의 왕복 요청이 많이 발생하게 된다. 이 경우 ProductInventory 목록을 가져오는 1개의 쿼리와 각 Product를 조회하는 N개의 쿼리가 실행되므로 총 1 + N개의 쿼리가 발생하게 된다.
그래서, product와 product_inventory를 조인해서 가져오는 방식으로 변환하였다.
public List<ProductServiceResponse> getProducts() {
        List<ProductServiceResponse> products = productInventoryRepository.findProductsWithInventoryGreaterThanZero();

        if (products.isEmpty()) {
            throw new BusinessException(ECommerceExceptions.OUT_OF_STOCK);
        }

        return products;
    }
ProductService.java
@Query("SELECT new com.tdd.ecommerce.product.application.ProductServiceResponse(p.productId, p.productName, p.category, p.price, pi.amount) " +
            "FROM ProductInventory pi " +
            "INNER JOIN Product p " +
            "ON pi.productId = p.productId " +
            "WHERE pi.amount > 0")
    List<ProductServiceResponse> findProductsWithInventoryGreaterThanZero();
ProductInventoryJpaRepository.java
3-3-3. 인덱스(product_id)⭕ 캐시❌

이번엔 변경된 코드로 다시 실행해보았다.
1) http_req_duration
avg 5.4s ➡️ avg 16.62s ➡️ 15.93s
2) http_req_failed
82.45% ➡️ 77.69% ➡️ 19.02%
3) iterations
6132 ➡️ 4351 ➡️ 19852
4) iteration_duration
15.49s ➡️ 16.62s ➡️ 15.93s
5) http_req_waiting
avg 5.33s ➡️ 5.95s ➡️ 7.06s
6) http_req_receiving
avg 2.26ms ➡️ 3.07ms ➡️ 2.32ms
👉🏻 전체 처리 개수는 눈에 띄게 늘었으나 응답속도에서는 눈에띄는 향상이 일어나지 않았다.
3-3-3. 인덱스(amount, product_id)⭕ 캐시❌
CREATE INDEX idx_product_inventory_amount_product_id ON PRODUCT_INVENTORY(amount, product_id);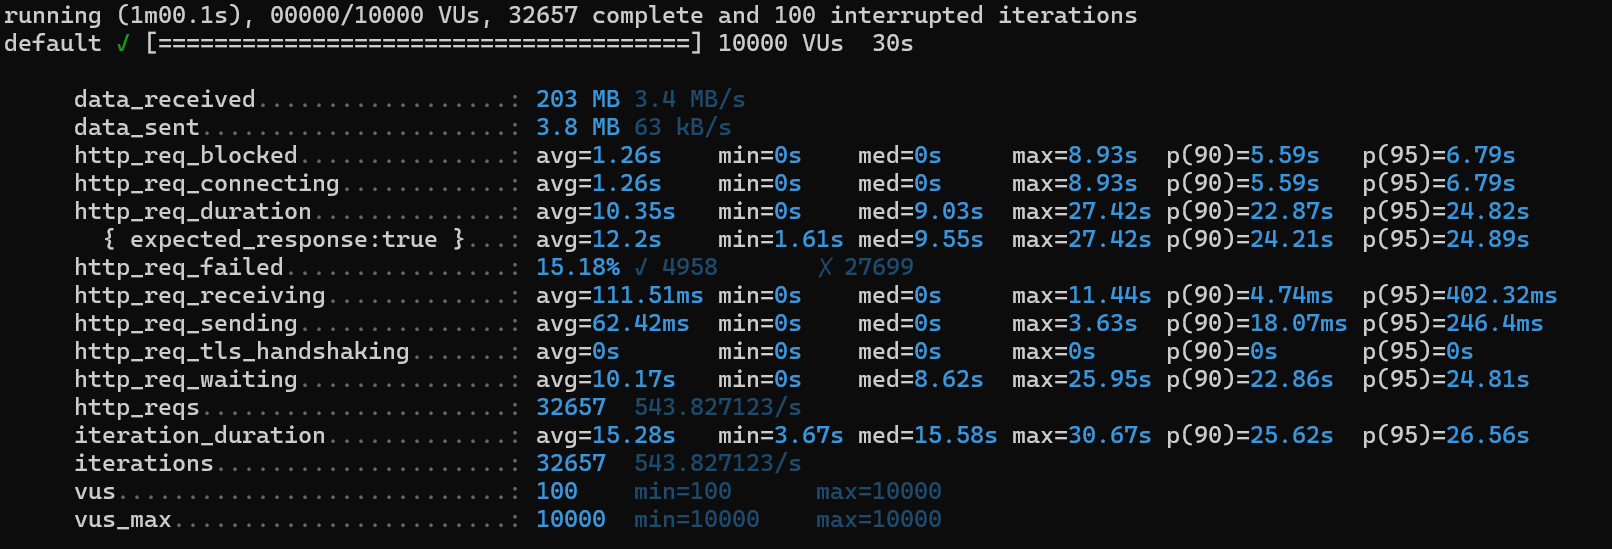
1) http_req_duration
avg 5.4s ➡️ avg 16.62s ➡️ avg 15.93s ➡️ avg 10.35s
2) http_req_failed
82.45% ➡️ 77.69% ➡️ 19.02% ➡️ 15.18%
3) iterations
6132 ➡️ 4351 ➡️ 19852 ➡️ 32657
4) iteration_duration
15.49s ➡️ 16.62s ➡️ 15.93s ➡️ 15.28s
5) http_req_waiting
avg 5.33s ➡️ 5.95s ➡️ 7.06s ➡️ 10.17s
6) http_req_receiving
avg 2.26ms ➡️ 3.07ms ➡️ 2.32ms ➡️ 111.51 ms
👉🏻 이 친구도 처리속도는 별로 나아지지 않았으나 더 많은 부하를 견딜 수 있는 것으로 파악된다.
해당 내용을 개선할 수 있는 방법은 여러가지이다.
- 캐싱의 사용
- FETCH JOIN의 사용 > 지양하는편..!
- 데이터 페이징
3-3-4. 인덱스(amount, product_id)⭕ 캐시⭕
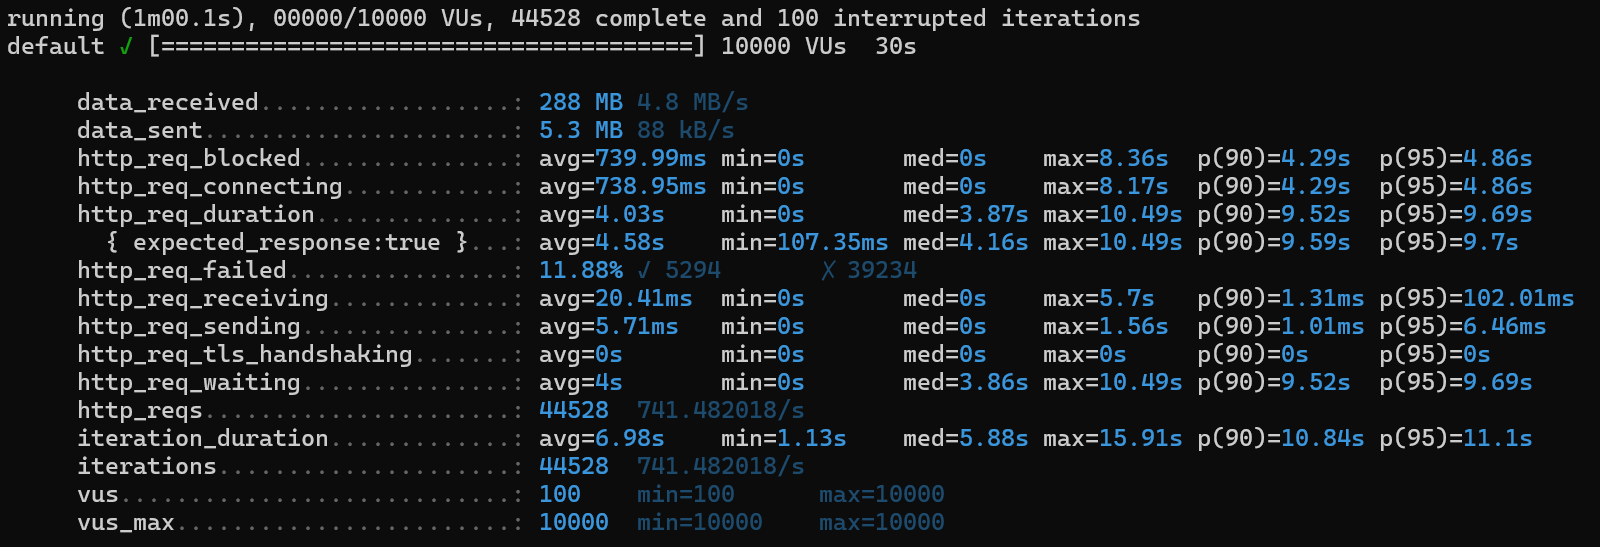
1) http_req_duration
avg 5.4s ➡️ avg 16.62s ➡️ avg 15.93s ➡️ avg 10.35s ➡️ 4.03s
2) http_req_failed
82.45% ➡️ 77.69% ➡️ 19.02% ➡️ 15.18% ➡️ 11.88%
3) iterations
6132 ➡️ 4351 ➡️ 19852 ➡️ 32657 ➡️ 444528
4) iteration_duration
15.49s ➡️ 16.62s ➡️ 15.93s ➡️ 15.28s ➡️ 6.98s
5) http_req_waiting
avg 5.33s ➡️ 5.95s ➡️ 7.06s ➡️ 10.17s ➡️ 4s
6) http_req_receiving
avg 2.26ms ➡️ 3.07ms ➡️ 2.32ms ➡️ 111.51 ms ➡️ 20.41ms