Matplotlib 기초
12 -> row 1, col2
121 -> row1, col2 개 중 인덱스 1
122 -> row1, colr2 개 중 인덱스 2
fig = plt.figure()
ax = fig.add_subplot(121)
ax = fig.add_subplot(122)
plt.show()
기본 라인 그리기
plt.plot(데이터) 혹은 ax.plot(데이터)로 그린다
fig = plt.figure()
ax = fig.add_subplot()
x = np.array([1,2,3])
plt.plot(x)
plt.show()
pythonic plot
ax는 객체이다. 객체에 직접 plot
fig = plt.figure()
x1= np.array([1,2,3])
x2 = np.array([3,2,1])

ax1 = fig.add_subplot(211)
ax1.plot(x1)
ax2 = fig.add_subplot(212)
ax2.plot(x2)
plt.show()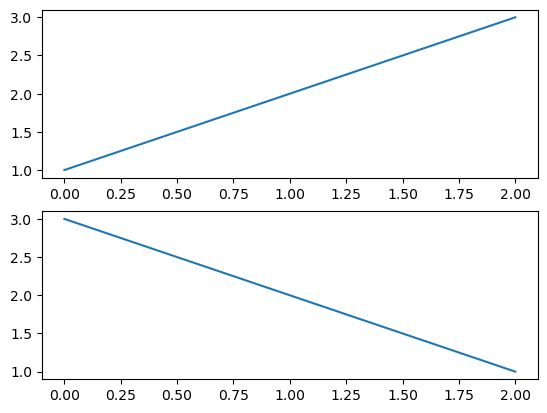
fig = plt.figure()
x1= np.array([1,1,1])
x2 = np.array([1,2,3])
x3 = np.array([3,3,3])

ax = fig.add_subplot(111)
ax.plot(x1)
ax.plot(x2)
ax.plot(x3)
plt.show()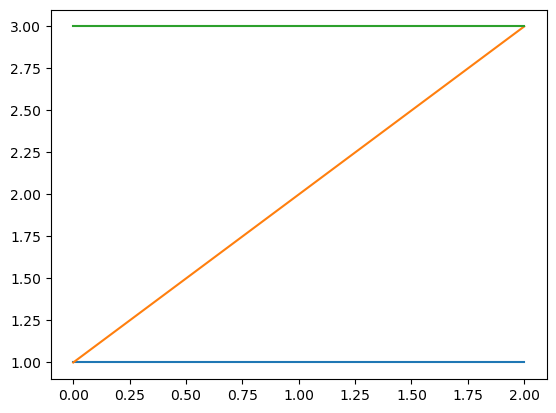
color 지정
ax.plot(x1, color = 'r')와 같이 컬러를 지정
ax.plot(x1, color = 'r')
ax.plot(x2, color = 'forestgreen')
ax.plot(x3, color = '#000000')
plt.show()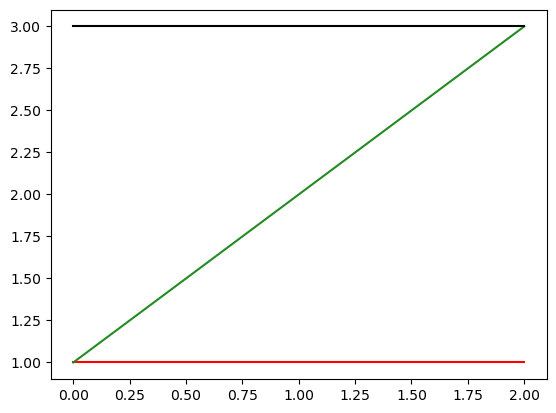
라벨 표시
ax.plot(x1, color = 'r', label = '1')과 같이 라벨을 표시하고
ax.legend()를 해주면 라벨을 표기할 수 있다.
ax = fig.add_subplot(111)
ax.plot(x1, color = 'r', label = '1')
ax.plot(x2, color = 'forestgreen', label = '2')
ax.plot(x3, color = '#000000', label = '3')
ax.legend()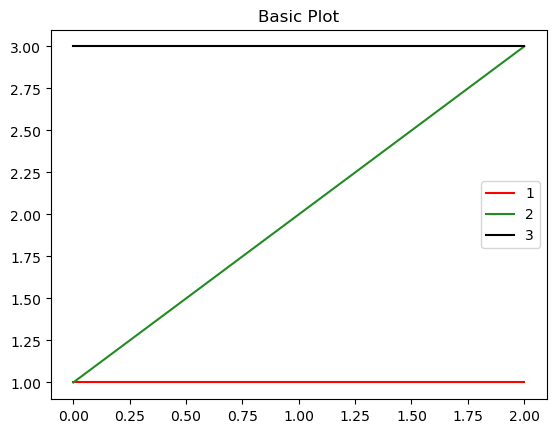
subplot 별 타이틀
ax 객체에 각각 set_title을 할 수 있고
fig 객체에 suptitle로 전체 제목을 설정할 수 있다.
fig = plt.figure()
ax1 = fig.add_subplot(121)
ax2 = fig.add_subplot(122)
ax1.set_title('ax1')
ax2.set_title('ax2')
fig.suptitle('fig')
plt.show()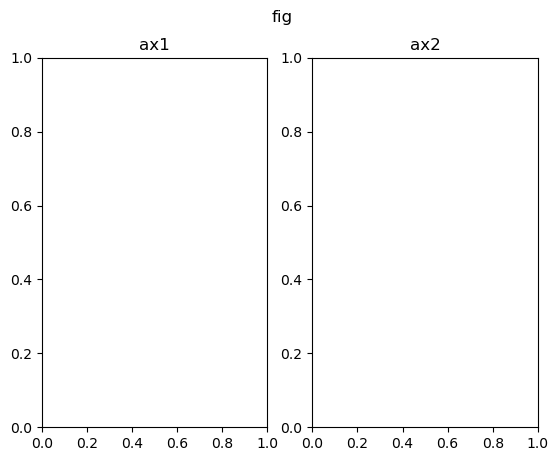
X 축 라벨 설정
set_xticks를 이용해서 축 설정이 가능
ax.set_xticklabels(['a','b','c'])를 이용하면 라벨도 바꿀 수 있다.
ax.set_xticks([0,1,2])
ax.set_xticklabels(['a','b','c'])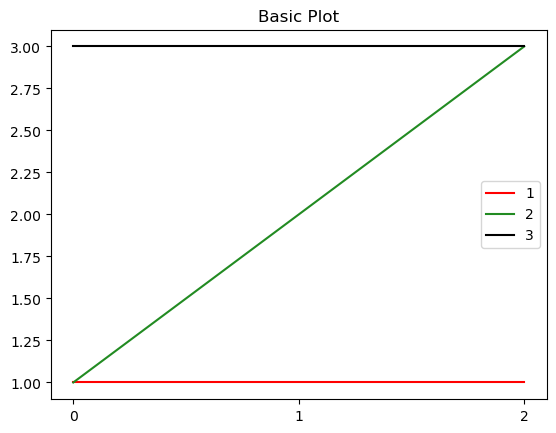

text 입력
원하는 위치에 텍스트를 적어주는 기능
ax.text(x = 1, y =2 , s ='text')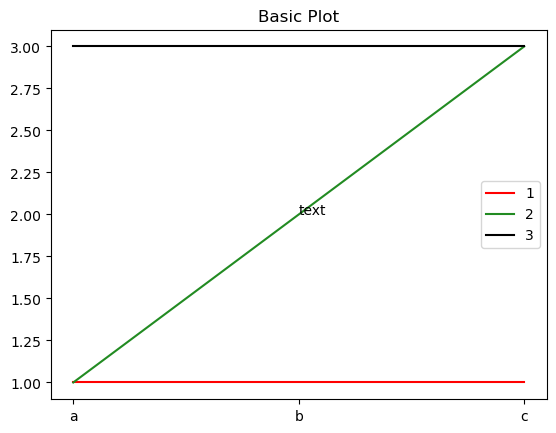
주석
ax.annotate(text = 'text', xy = (1,2),
            xytext = (1.2, 2.2),
            arrowprops = dict(facecolor = 'black'))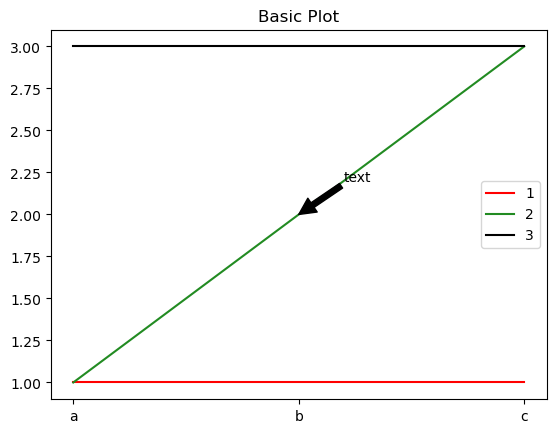

AI Engineer