pd.read_excel()의 argument에는 다음의 것들이 있다.
sheet_name : 엑셀의 몇번째 sheet를 가져올지
header : 몇번째 행을 column으로 할지
index_col : 몇번째 열을 index으로 할지
header , index_col
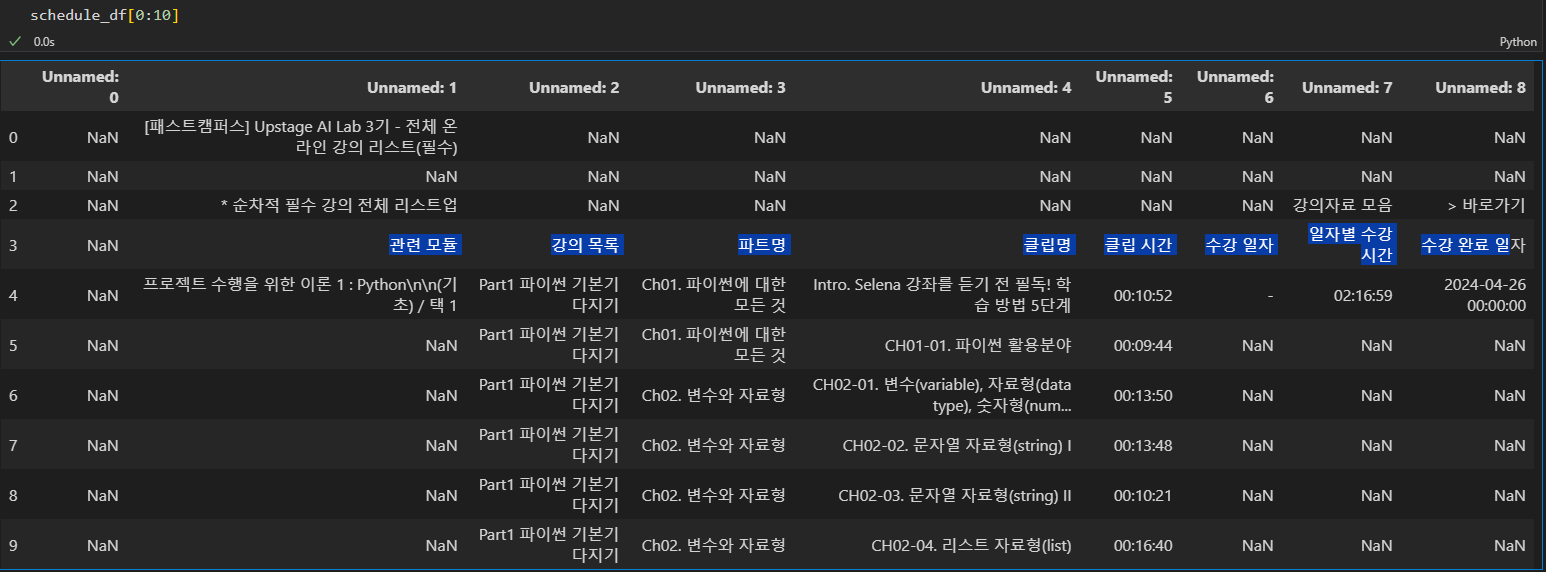
사진과 같이 위에 행들이 필요없는 경우, 3번을(4번째) 행으로 하려면 header=3으로 하자
또 맨 왼쪽 열도 필요없으니, 3번을(4번째) 열로 하려면 index_col=3로 하자
df1.merge(df2,how)
how
inner:
두 DataFrame의 키(columns)의 교집합에 대해 병합합니다.
교집합에 해당하는 행만 결과에 포함됩니다.
outer:
두 DataFrame의 키(columns)의 합집합에 대해 병합합니다.
합집합에 해당하는 행이 모두 결과에 포함됩니다.
누락된 값은 NaN으로 채워집니다.
left:
왼쪽 DataFrame의 키(columns)에 대해 병합합니다.
오른쪽 DataFrame에 매칭되는 값이 없는 경우 NaN으로 채워집니다.
right:
오른쪽 DataFrame의 키(columns)에 대해 병합합니다.
왼쪽 DataFrame에 매칭되는 값이 없는 경우 NaN으로 채워집니다.
pivot table : groupby랑 같은 기능 but 더 유용하다
# Pivot table 생성
pivot_df = df.pivot_table(index='Customer', columns='Product', values='Price', aggfunc='mean')
Pivot table을 사용하여 고객(Customer) 별로 제품(Product)을 행 인덱스로, 제품 가격(Price)을 열 인덱스로 하고 Price의 평균을 값을 입력한다
grouped_df = df.groupby(['Customer', 'Product']).mean()비슷한 기능으로 groupby가 있는데, pivot table이 더 유용하다
Seaborn
Histplot
Displot
Barplot
Countplot
Boxplot
Lineplot
Scatterplot
Pairplot
Heatmap
