
시작하기
Step 1.
만약에 패스워드를 사용하는 Redis 6.X 이상의 버전을 사용한다면 아래와 같은 포맷으로 Redis 서버 경로를 REDIS_ADDR 환경변수로 주입해 줘야 한다.
redis://<<username (optional)>>:<<PASSWORD>>@<<HOSTNAME>>:<<PORT>>
$ docker run -d --name redis-exporter --restart=unless-stopped -p 9121:9121 -e REDIS_ADDR=<redis_url> oliver006/redis_exporter
$ curl -v localhost:9121/metrics
Step 2. Prometheus 수집
global:
scrape_interval: 10s
scrape_timeout: 10s
evaluation_interval: 2m
scrape_configs:
- job_name: 'Redis'
metrics_path: '/metrics'
scheme: 'http'
static_configs:
- targets: ['*.*.*.*:9121']
labels:
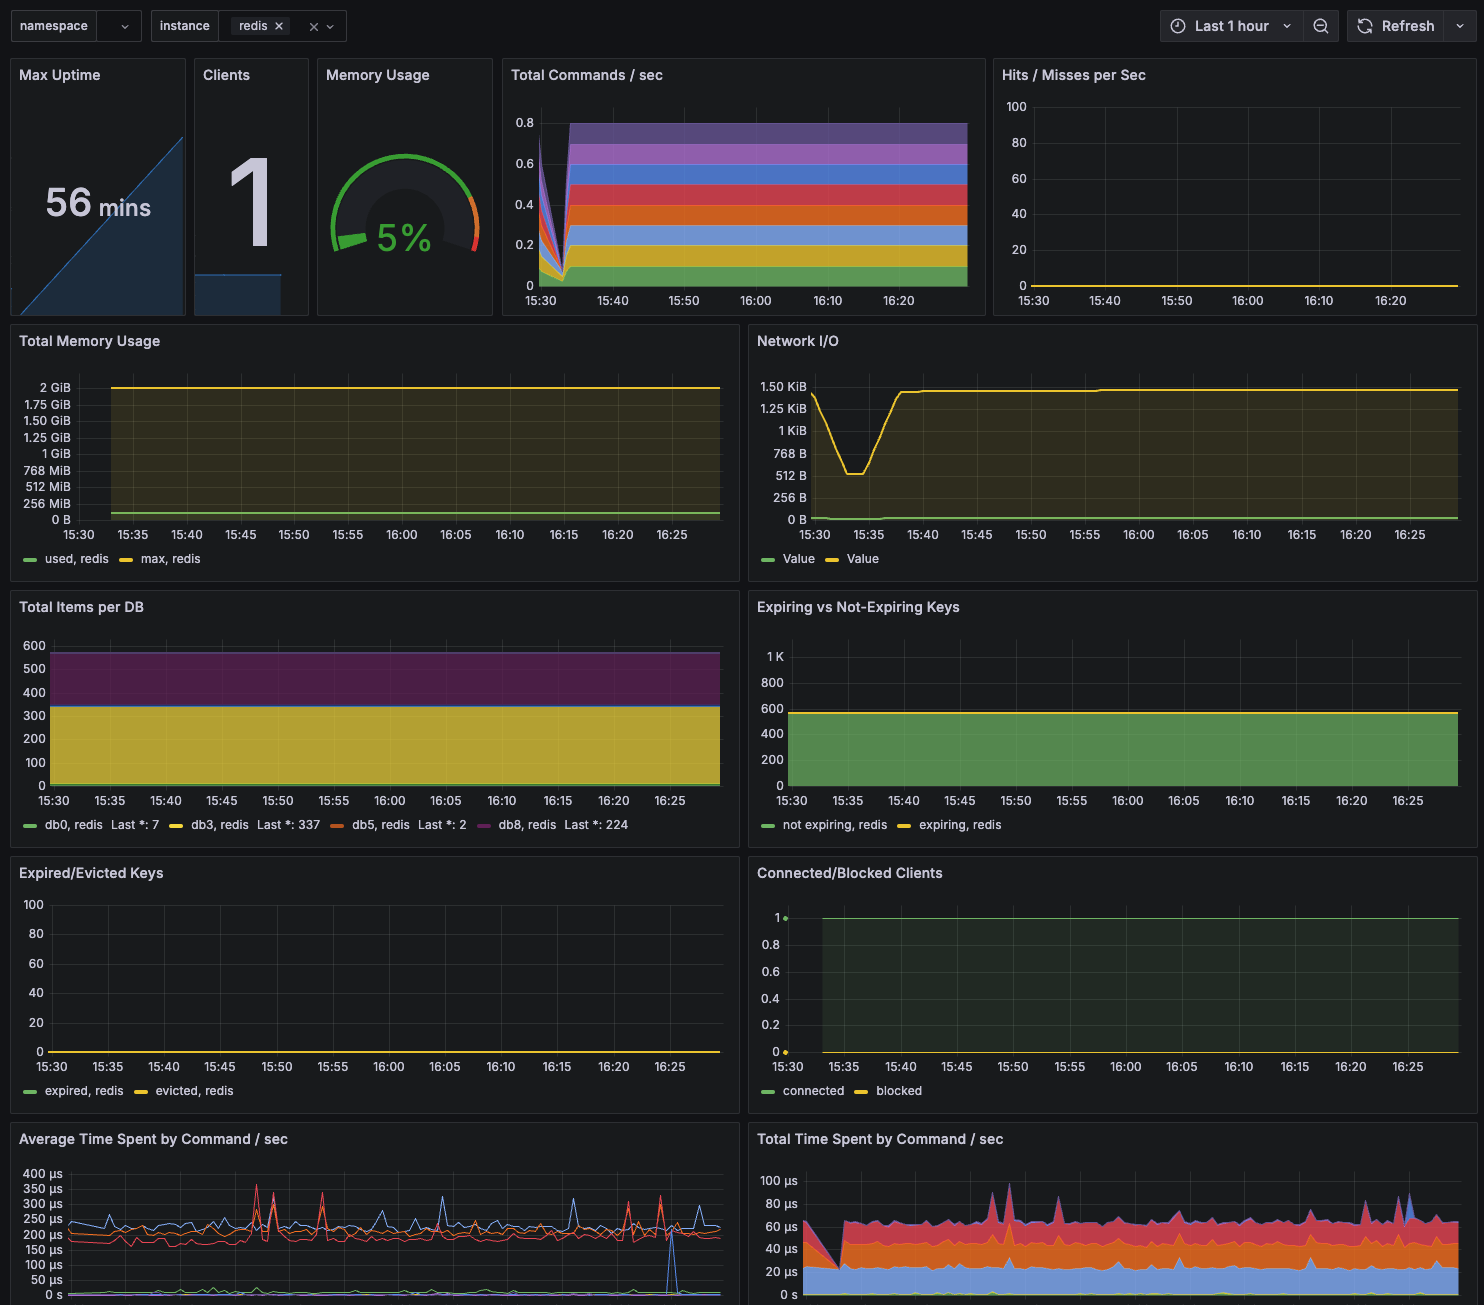
service: 'redis'Step 3. Grafana 연동
https://grafana.com/grafana/dashboards/763-redis-dashboard-for-prometheus-redis-exporter-1-x/
Trouble Shooting
redis_exporter 컨테이너의 로그에서 아래와 같이 redis 서버에 접속하지 못하는 상황이 있을 수 있다.
$ docker logs -f redis-exporter
...
time="2025-02-19T06:30:39Z" level=error msg="Couldn't connect to redis instance (redis://localhost:6379)"
이는 말 그대로 해당 exporter가 Redis에 접속하지 못하는 상황이기 때문에 아래 방법들을 확인해 본다.
- Redis 서버 접속 패스워드 누락
- [Redis도 docker로 실행한 경우] exporter와 동일한 네트워크인지 확인
- Redis 서버쪽 인바운드 설정 확인
Reference

🖥️