06. 데이터 시각화:ggplot2 패키지
06-1 그래프 그리기
install.packages("ggplot2")
library(ggplot2)
내장 데이터 airquality를 활용하자.

str(airquality)
ggplot(airquality, aes(x = Day, y = Temp))
ggplot(airquality, aes(x = Day, y = Temp)) +
geom_point(size = 3, color = "red")
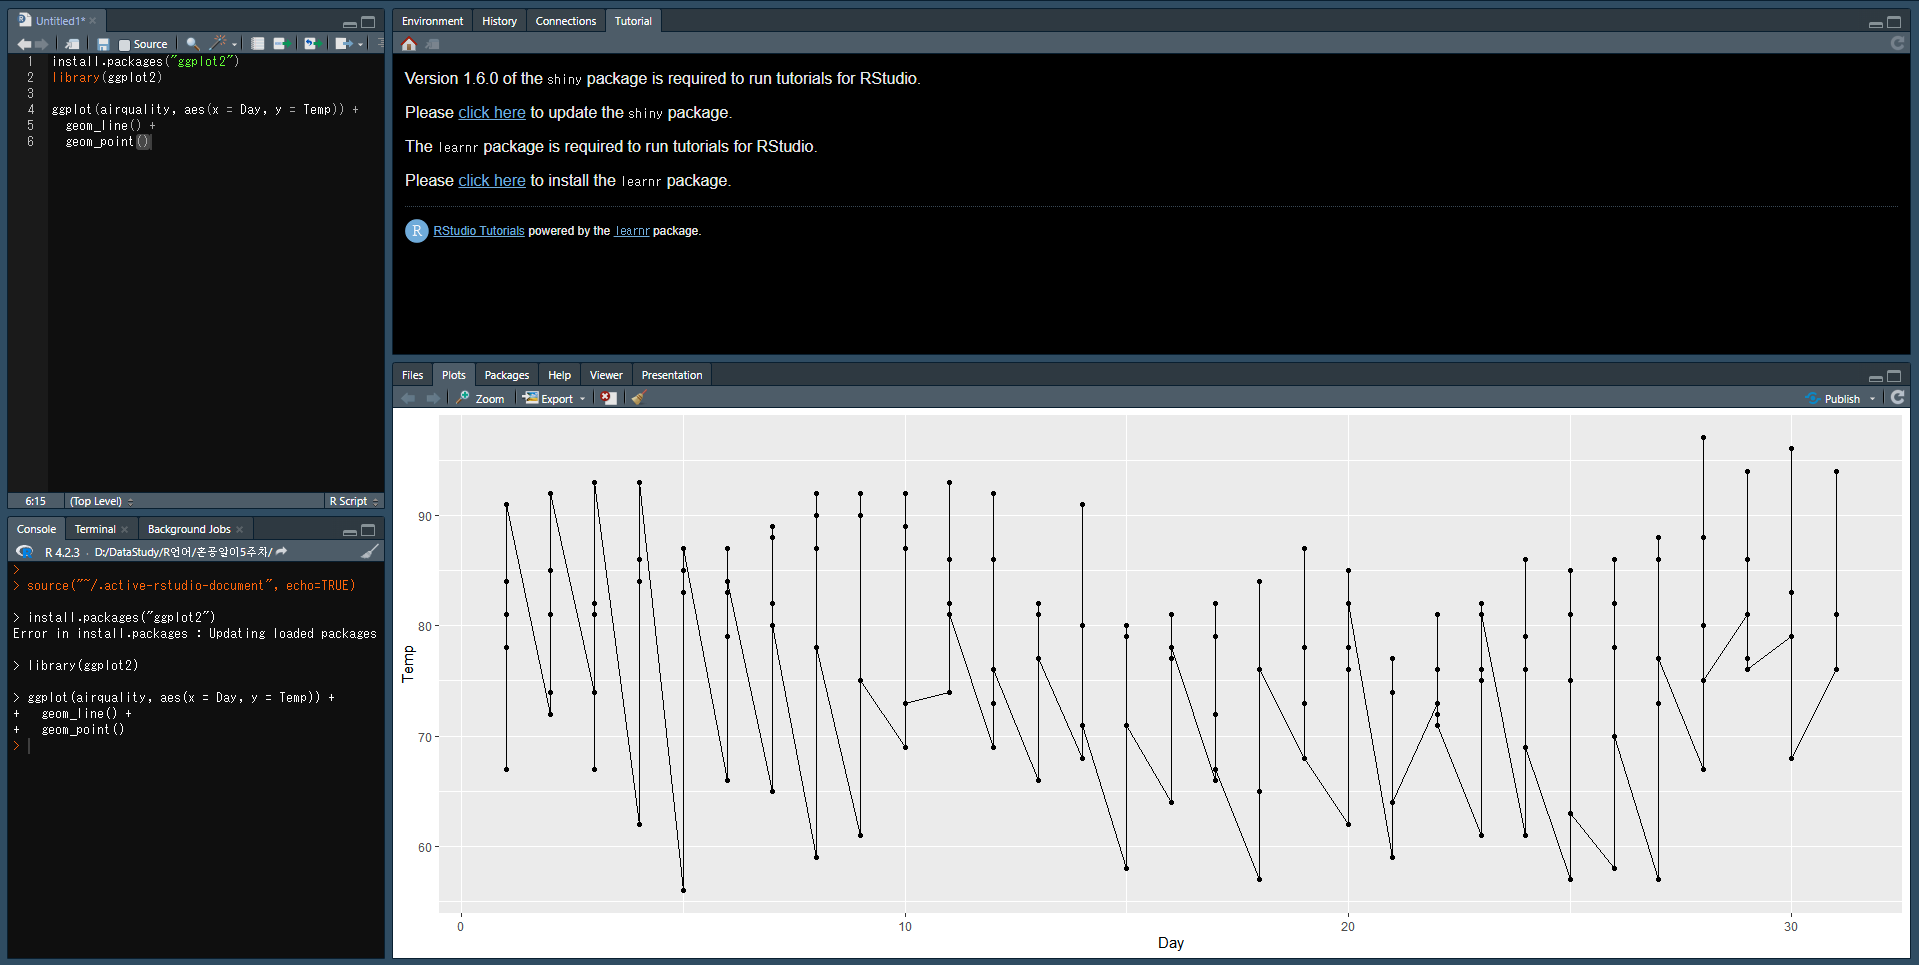
- 선 그래프 그리기: geom_line() 함수
ggplot(airquality, aes(x = Day, y = Temp)) +
geom_line()
- 막대 그래프 그리기: geom_bar() 함수
ggplot(airquality, aes(x = cyl)) +
geom_bar(width = 0.5)
ggplot(mtcars, aes(x = factor(cyl))) +
geom_bar(aes(fill = factor(gear)))
ggplot(mtcars, aes(x = factor(cyl))) +
geom_bar(aes(fill = factor(gear))) +
coord_polar()
ggplot(mtcars, aes(x = factor(cyl))) +
geom_bar(aes(fill = factor(gear))) +
coord_polar(theta = "y")
- 상자 그림 그리기: geom_boxplot() 함수
ggplot(airquality, aes(x = Day, y = Temp, group = Day)) +
geom_boxplot()
- 히스토그램 그리기: geom_histogram() 함수
ggplot(airquality, aes(Temp)) +
geom_histogram()
그래프에 그래프 더하기(기본미션)
06-2 그래프에 객체 추가하기
geom_abline(intecept = 절편, slope = 기울기)
geom_hline(yintercept = y절편)
geom_vline(xintercept = x절편)
geom_text(aex(label = 레이블, vjust = 세로 위치, hjust = 가로 위치))
- 도형 및 화살표 넣기: annotate() 함수
annotate("모양", xmin = x축 시작, xmax = x축 끝, ymin = y축 시작, ymax = y축 끝)
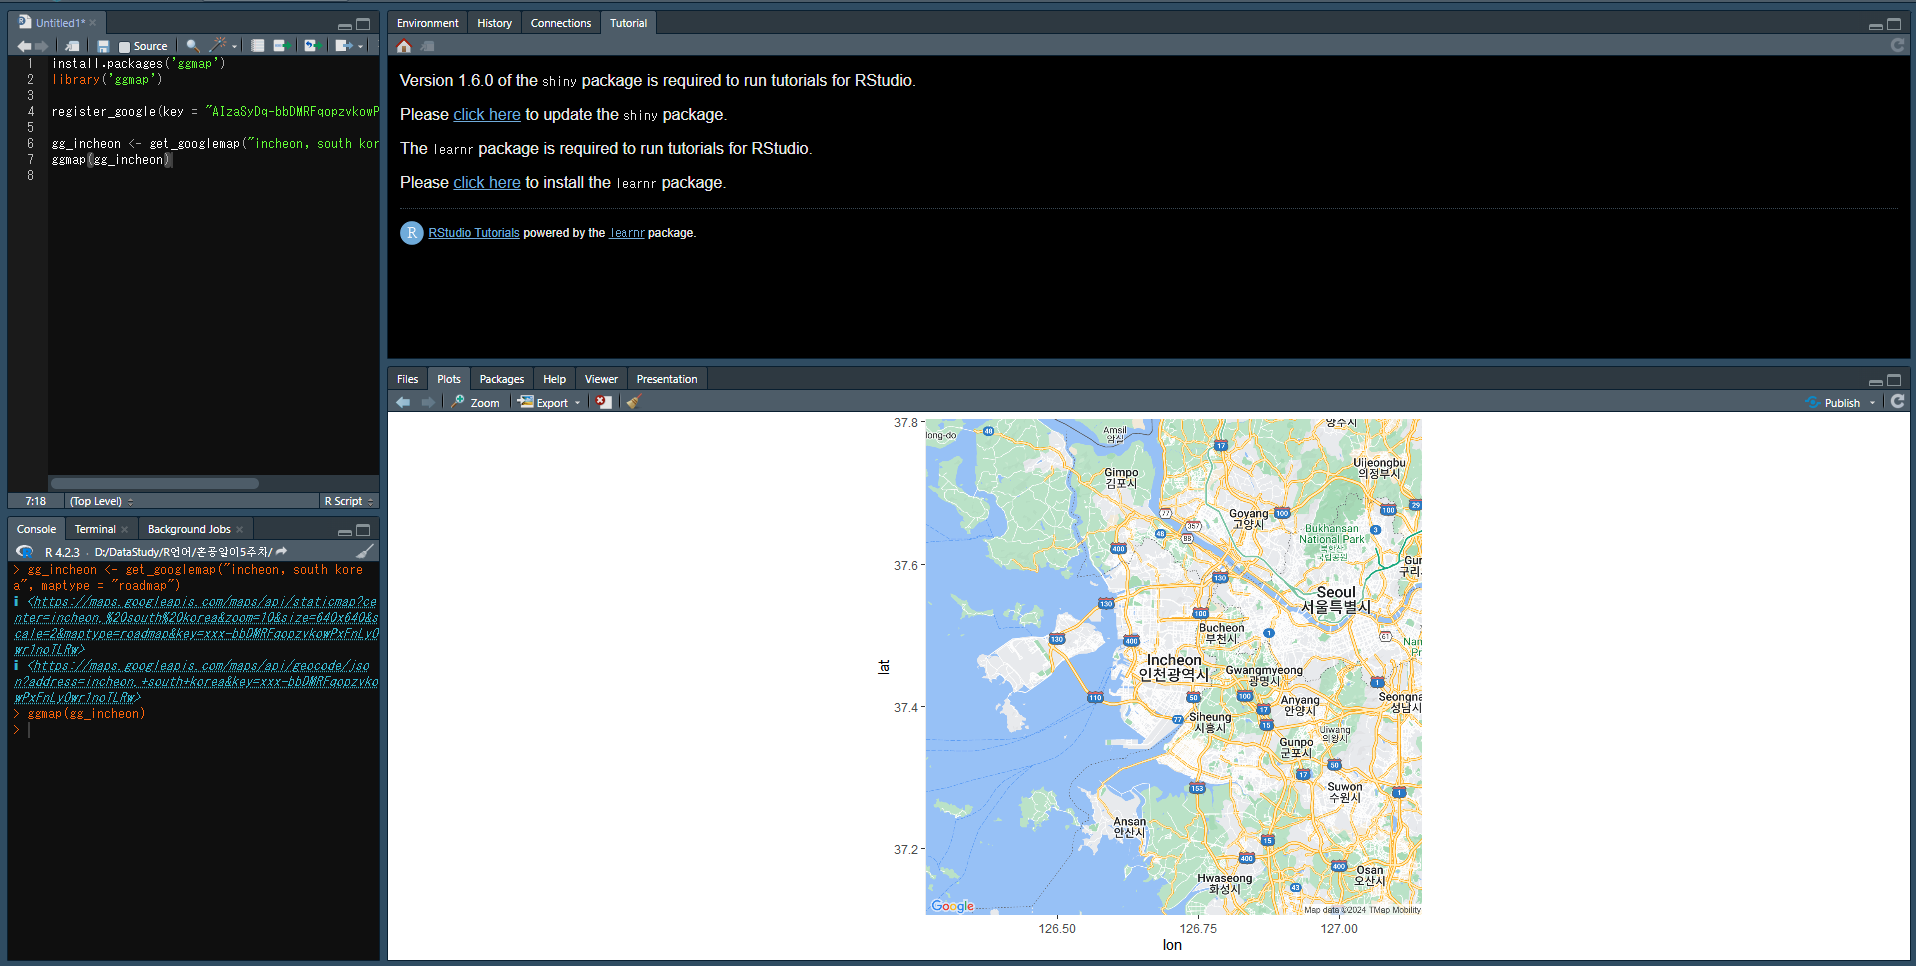
06-3 지도 시각화: ggmap 패키지
register_google(key = "사용자 api key")
get_googlemap(center, maptype = "지도유형")

- 위치 데이터를 지도로 시각화
ggmap()

- 위치를 포함하는 문자열을 위도와 경도 값으로 반환
geocode()
선택 미션