import numpy as np
import pandas as pd
import matplotlib.pyplot as plt
synthetic data
drink = np.array([101.8, 101.5, 101.8, 102.6, 101, 96.8, 102.4, 100, 98.8, 98.1,
                  98.8, 98, 99.4, 95.5, 100.1, 100.5, 97.4, 100.2, 101.4, 98.7,
                  101.4, 99.4, 101.7, 99, 99.7, 98.9, 99.5, 100, 99.7, 100.9,
                  99.7, 99, 98.8, 99.7, 100.9, 99.9, 97.5, 101.5, 98.2, 99.2,
                  98.6, 101.4, 102.1, 102.9, 100.8, 99.4, 103.7, 100.3, 100.2, 101.1,
                  101.8, 100, 101.2, 100.5, 101.2, 101.6, 99.9, 100.5, 100.4, 98.1,
                  100.1, 101.6, 99.3, 96.1, 100, 99.7, 99.7, 99.4, 101.5, 100.9,
101.3, 99.9, 99.1, 100.7, 100.8, 100.8, 101.4, 100.3, 98.4, 97.2])np.mean(drink) #평균100.04125np.median(drink) #중앙값100.05print(np.var(drink)) #분산값
print(np.var(drink, ddof=1)) #분산값 (n-1)2.287173437500001
2.316125000000001print(np.std(drink)) #표준편차
print(np.std(drink, ddof=1)) #표준편차 (n-1)1.5123403841397614
1.521882058505192np.max(drink)103.7np.min(drink)95.5np.percentile(drink, [25, 50, 75])array([ 99.175, 100.05 , 101.2 ])drink_df = pd.DataFrame(drink) #numpy인 drink 데이터를 데이터프레임으로 만들기
drink_df.columns = ['Value']drink_df| Value | |
|---|---|
| 0 | 101.8 |
| 1 | 101.5 |
| 2 | 101.8 |
| 3 | 102.6 |
| 4 | 101.0 |
| ... | ... |
| 75 | 100.8 |
| 76 | 101.4 |
| 77 | 100.3 |
| 78 | 98.4 |
| 79 | 97.2 |
80 rows × 1 columns
drink_df.describe() #데이터프레임 요약| Value | |
|---|---|
| count | 80.000000 |
| mean | 100.041250 |
| std | 1.521882 |
| min | 95.500000 |
| 25% | 99.175000 |
| 50% | 100.050000 |
| 75% | 101.200000 |
| max | 103.700000 |
drink_df.info() #데이터프레임 정보<class 'pandas.core.frame.DataFrame'>
RangeIndex: 80 entries, 0 to 79
Data columns (total 1 columns):
# Column Non-Null Count Dtype
--- ------ -------------- -----
0 Value 80 non-null float64
dtypes: float64(1)
memory usage: 768.0 bytesBox-plot (상자그림) 그리기
import seaborn as snssns.boxplot(data=drink)
plt.show()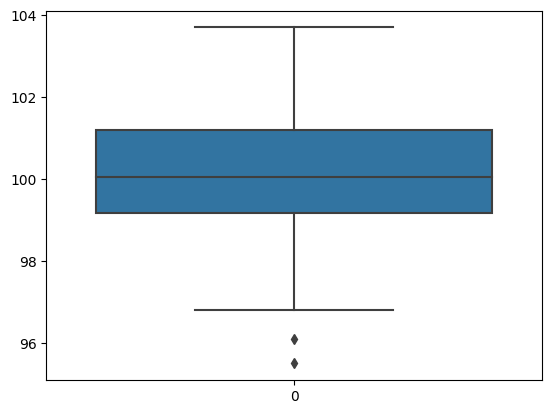
타이타닉 데이터
df = sns.load_dataset("titanic")df.head(5)| survived | pclass | sex | age | sibsp | parch | fare | embarked | class | who | adult_male | deck | embark_town | alive | alone | |
|---|---|---|---|---|---|---|---|---|---|---|---|---|---|---|---|
| 0 | 0 | 3 | male | 22.0 | 1 | 0 | 7.2500 | S | Third | man | True | NaN | Southampton | no | False |
| 1 | 1 | 1 | female | 38.0 | 1 | 0 | 71.2833 | C | First | woman | False | C | Cherbourg | yes | False |
| 2 | 1 | 3 | female | 26.0 | 0 | 0 | 7.9250 | S | Third | woman | False | NaN | Southampton | yes | True |
| 3 | 1 | 1 | female | 35.0 | 1 | 0 | 53.1000 | S | First | woman | False | C | Southampton | yes | False |
| 4 | 0 | 3 | male | 35.0 | 0 | 0 | 8.0500 | S | Third | man | True | NaN | Southampton | no | True |
sns.boxplot(data=df)
plt.show()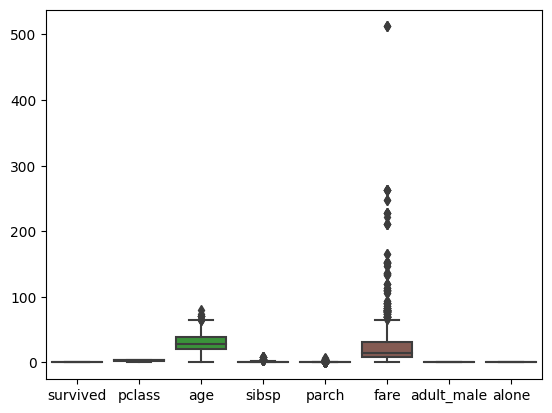
sns.boxplot(data=df, x="age", y="class",)
plt.show()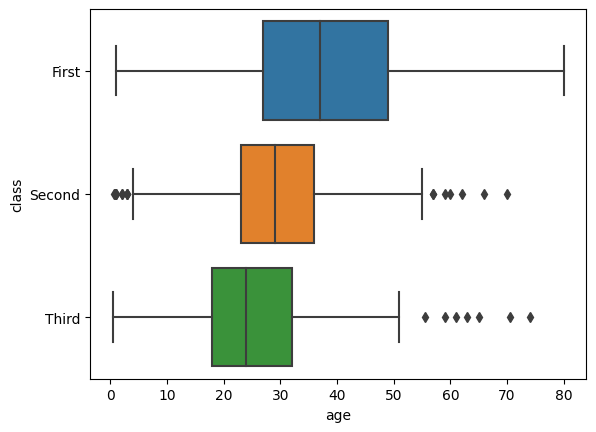
sns.boxplot(data=df, x="age", y="class", hue = 'survived')
plt.show()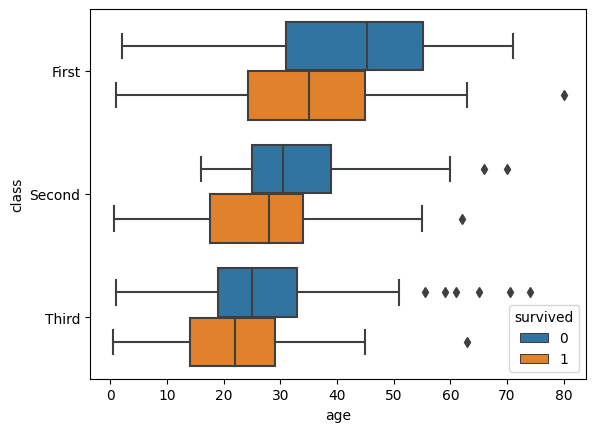
Deep Learning, Multi-Agent RL, Large Language Model, Statistics