확률변수 X가 이항분포, 즉 X ~ Bin(n, p)이고 np나 n(1-p)가 모두 클 경우에 (보통 10 이상) X는 근사적으로 평균이 np이고 표준편차가 인 정규분포를 따른다. 즉, 로 표현된다.
라이브러리 불러오기
import numpy as np
import matplotlib.pyplot as plt
from math import factorial

# Probability density of the binomial distribution
def bin_dist(k, n, p):
    nck = factorial(n) / (factorial(k) * factorial(n - k))
    pd = nck * p**k * (1-p)**(n-k) #이항분포의 확률질량함수 구하는식
    return pd
N을 계속 키워나갔을 때 이항분포의 모양이 정규분포에 근사함을 확인할 수 있음.
plt.figure(figsize=(50, 8))

plt.subplot(151)
x = np.arange(6)
pd1 = np.array([bin_dist(k, 5, 0.4) for k in range(6)]) #x가 0~15의 값을 가질때 확률들의 집합
plt.ylim(0, 0.4)
plt.title('N = 5, P = 0.4')
plt.bar(x, pd1, color='lightcoral')
plt.plot(pd1, color = 'green', linewidth = 5)

plt.subplot(152)
x = np.arange(13)
pd2 = np.array([bin_dist(k, 12, 0.4) for k in range(13)])
plt.ylim(0, 0.3)
plt.title('N = 12, P = 0.4')
plt.bar(x, pd2, color='lightcoral')
plt.plot(pd2, color = 'green', linewidth = 5)

plt.subplot(153)
x = np.arange(26)
pd3 = np.array([bin_dist(k, 25, 0.4) for k in range(26)])
plt.ylim(0, 0.2)
plt.title('N = 25, P = 0.4')
plt.bar(x, pd3, color='lightcoral')
plt.plot(pd3, color = 'green', linewidth = 5)

plt.subplot(154)
x = np.arange(51)
pd3 = np.array([bin_dist(k, 50, 0.4) for k in range(51)])
plt.ylim(0, 0.15)
plt.title('N = 50, P = 0.4')
plt.bar(x, pd3, color='lightcoral')
plt.plot(pd3, color = 'green', linewidth = 5)

plt.subplot(155)
x = np.arange(101)
pd3 = np.array([bin_dist(k, 100, 0.4) for k in range(101)])
plt.ylim(0, 0.1)
plt.title('N = 100, P = 0.4')
plt.bar(x, pd3, color='lightcoral')
plt.plot(pd3, color = 'green', linewidth = 5)
plt.show()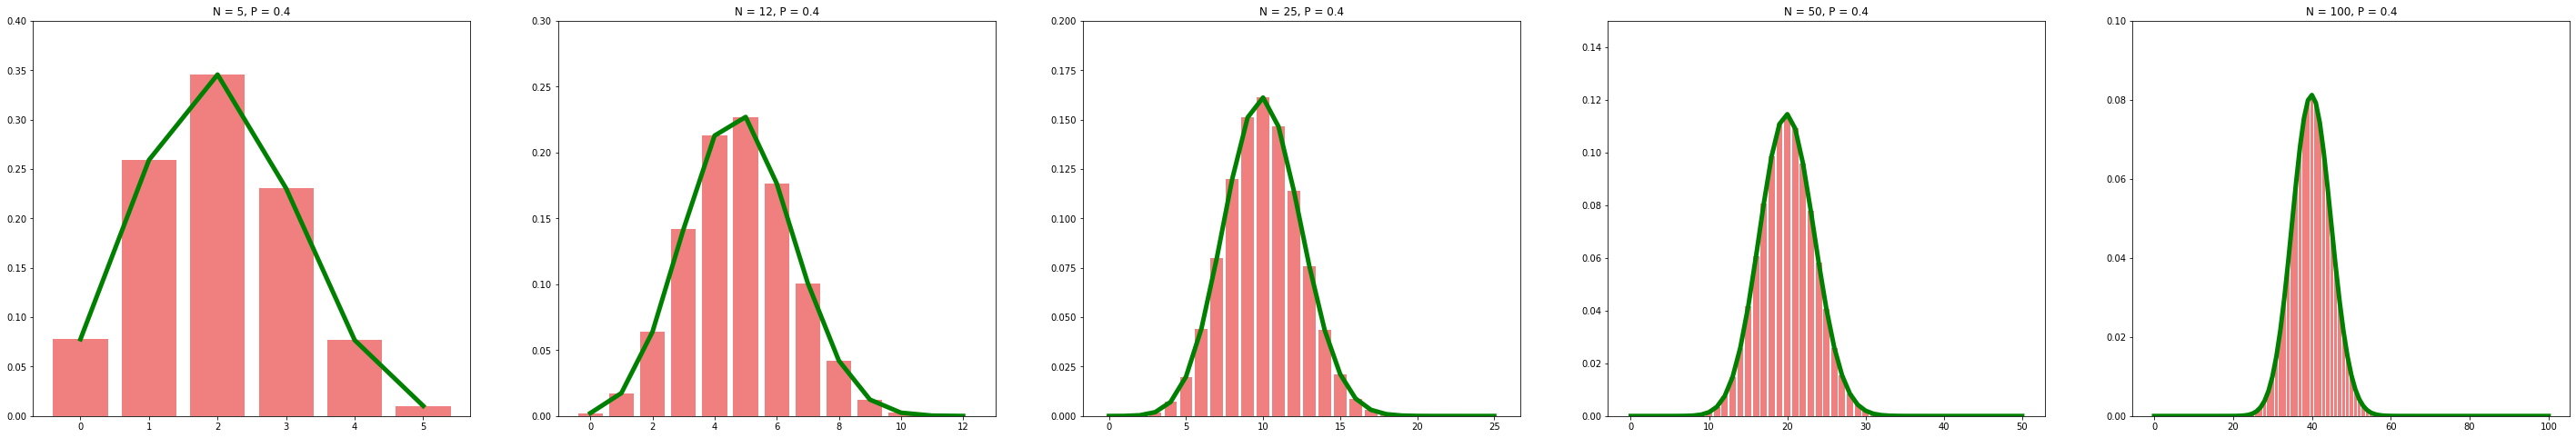

Deep Learning, Multi-Agent RL, Large Language Model, Statistics