.png)
이번 섹션에는 본격적으로 머신러닝을 배운다. 불과 한달 전까지만해도 머신러닝의 머자도 몰랐는데 신기하다. 지금까지 몰랐던 새로운 분야를 배운다는 것은 너무 즐겁고 행복하다. 너무 많은 것들이 머릿 속에 한번에 들어와 머리가 터질 것 같지만, 하루하루 아무 걱정없이 공부만 할 수 있다는게 너무 감사하다. 가끔 내게 주어진 시간이 많지만은 않다는 생각에 내 스스로를 조급하게 만들 때도 있지만, 그런 생각 할 시간에 하나라도 더 공부하고 알아가는게 나을 것이라고 스스로에게 채찍질한다. 정말 이건 나 자신과의 싸움이라고 생각한다.ㅋㅋㅋㅋㅋ
오늘도 오늘 하루를 감사하며 화이팅하자!
TDL
NOTE1
- 선형회귀(Linear Regression)
- Tabular data 테이블 형태 데이터
- 예측하는 방법
- 기존경험을 바탕으로 예측 2. 통계정보를 활용
- 확률밀도함수 그래프
sns.displot(df['열이름'], kde=True) #커널밀도그래프
plt.axvline(df['열이름'].median(), color='red') #중간값으로 수직선그리기 - 기준모델(Baseline Model)
분류문제 : 타겟의 최빈클래스, 회귀문제 : 평균값, 시계열회귀 : 이전 타임스탬프의 값 - MAE(Mean Absolute Error, 평균절대오차)
예측 error의 절대값 평균

#주택판매가격예측
predict = df['SalePrice'].mean()
errors = predict - df['SalePrice']
mean_absolute_error = errors.abs().mean()- RSS(Residual sum of squares) = SSE(Sum of Square Error)
=비용함수, 비용함수를 최소화하는 모델을 찾는 과정을 학습이라고 함. - 비용함수
- 회귀선
잔차 제곱들의 합 RSS를 최소화 하는 직선 - 회귀식

- 회귀계수
RSS를 최소화 하는 값으로 모델 학습을 통해 얻어지는 값
최소제곱법으로 선형 회귀계수를 쉽게 구할 수 있음. - 최소제곱회귀, 최소제곱법 (OLS, Ordinary least squares)
잔차제곱합을 최소화하는 방법 - 보간(interploate)
- 외삽(Extrapolate)
- 단순 선형 회귀(Simple Linear Regression)
1개의 특성을 사용하는 회귀알고리즘모델
from sklearn.linear_model import LinearRegression
model = LinearRegression()
feature = ['GrLivArea']
target = ['SalePrice']
X_train = df[feature]
y_train = df[target]
model.fit(X_train, y_train)
y_pred = model.predict(X_test)

#기준모델 Error
y_pred = model.predict(X_train)
mae = mean_absolute_error(y_train, y_pred)
print(f'훈련 에러: {mae:.2f}')

#MAE
y_pred = model.predict(X_test)
mae = mean_absolute_error(y_test, y_pred)
print(f'테스트 에러: {mae:.2f}')- 계수(Coefficients)
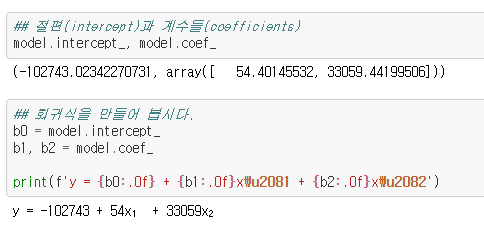
## 계수(coefficient)
model.coef_

## 절편(intercept)
model.intercept_- ipywidgets
from ipywidgets import interact

# 데코레이터 interact를 추가합니다.
@interact
def explain_prediction(sqft=(500,10000)):
    y_pred = model.predict([[sqft]])
    pred = f"{int(sqft)} sqft 주택 가격 예측: ${int(y_pred[0])} (1 sqft당 추가금: ${int(model.coef_[0])})"

    return pred
NOTE2
- 다중선형회귀(Multiple Linear Regression)
2개 이상의 특성을 사용. 하나의 특성을 사용한 단순선형회귀모델보다 테스트 오류가 더 줄어듦.
# 다중모델 학습을 위한 특성
features = ['GrLivArea',
            'OverallQual']
X_train = train[features]
X_test = test[features

# 모델 fit
model.fit(X_train, y_train)
y_pred = model.predict(X_train)
mae = mean_absolute_error(y_train, y_pred)
print(f'훈련 에러: {mae:.2f}')

# 테스트 데이터에 적용해 봅시다
y_pred = model.predict(X_test)
mae = mean_absolute_error(y_test, y_pred)
print(f'테스트 에러: {mae:.2f}')- train/test set split
- 무작위 나누기
## train/test 데이터를 sample 메소드를 사용해 나누겠습니다.
train = df.sample(frac=0.75,random_state=1)
test = df.drop(train.index)- 3d scatter plot
# 1. plt로 그리기
import matplotlib.pyplot as plt
import numpy as np
from matplotlib import style

style.use('seaborn-talk')
fig = plt.figure()

# for 3d plot
ax = fig.gca(projection='3d')
ax.scatter(train['GrLivArea'], train['OverallQual'], train['SalePrice'])
ax.set_xlabel('GrLivArea', labelpad=12)
ax.set_ylabel('OverallQual', labelpad=10)
ax.set_zlabel('SalePrice', labelpad=20)

plt.suptitle('Housing Prices', fontsize=15)
plt.show()
# 2. plotly로 간단히 그리기
import plotly.express as px
px.scatter_3d(
train,
x='GrLivArea',
y='OverallQual',
z='SalePrice',
title='House Prices'
)- 다중선형회귀식

- 계수(Coefficients or parameters)

- 선형회귀의 단점
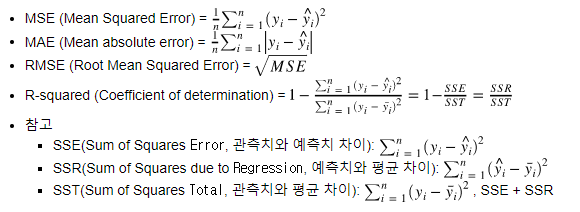
선형회귀는 다른 ML 모델에 비해 상대적으로 학습이 빠르고 설명력이 강합니다. 하지만 선형 모델의 이므로 과소적합(underfitting)이 잘 일어난다는 단점이 있습니다. - 회귀모델의 평가지표들(Evaluation metrics)

from sklearn.metrics import mean_squared_error, mean_absolute_error, r2_score- 일반화(Generalization)
- 과적합(Overfitting)
모델이 훈련데이터에만 특수한 성질을 과하게 학습해 일반화를 못해 결국 테스트데이터에서 오차가 커지는 현상을 말합니다 - 과소적합(Underfitting)
훈련데이터에 과적합도 못하고 일반화 성질도 학습하지 못해, 훈련/테스트 데이터 모두에서 오차가 크게 나오는 경우를 말합니다. - Bias/Variance Trade-off
high Variance : 과적합
high Bias : 과소적합

reducible Error : Bias, Variance
Bias = 예측값-실제값
Var = 예측값-평균값
좋은 모델 (일반화가 된 모델) : 편향과 분산이 낮은 모델 - 다항회귀모델(Polynomial regression)
독립변수와 타겟변수 사이에 비선형 관계를 학습할 수 있는 알고리즘 모델
from sklearn.preprocessing import PolynomialFeatures
poly = PolynomialFeatures(2) #degree =2
X_poly = poly.fit_transform(X1)
Python Data Science Handbook
다항특성을 방정식에 추가하는 것. 다항특성은 특성들의 상호작용을 보여줄 수 있기 때문에 상호작용특성(Interaction Features)라고도 부른다.
NOTE4
- Logistic Regression
- 훈련/검증/테스트 데이터 (train/validate/test)
- 분류(classification) vs 회귀(Regression)
- 두 데이터셋의 다른 컬럼 찾기
df.shape[1]
df.columns.difference(df1.columns) - Model selection
- hyperparameter tuning
- K_fold cross-validation(교차검증)
- 훈련, 검증 데이터 나누기
sklearn.modle_selection.train_test_split
train, val = train_test_split(train, random_state=2)-
분류 기준모델 : Majority class (가장 빈번하게 나타나는 범주)
(시계열데이터의 기준모델 : 기준 시점의 이전 시간데이터) -
분류하기 전 항상 target의 범주들의 비율을 확인
-
분류의 평가지표(evaluation metrics)
: 정확도(Accurany) = 올바르게 예측한수를 전체예측수로 나눈 것from sklearn.metrics import accuracy_score accuracy_score(y_train, y_pred)``` -
결측치를 평균 값으로 채우기
from sklearn.impute import SimpleImputer
imputer = SimpleImputer()
X_train_imputed = imputer.fit_transform(X_train)
X_val_imputed = imputer.transform(X_val)-
로지스틱 회귀 모델
-
로지스틱 함수 : 관측치가 특정 클래스에 속할 확률값(1과 0)

- Logit(log-odds) transformation (로짓 변환) : 비선형 -> 선형
Odds를 통해 변환가능 - Odds (오즈) : 실패확률에 대한 성공확률의 비
ex) odds=4 성공확률이 실패확률의 4배
(분류문제 = 클래스1확률에 대한 클래스0확률의 비)

- 로지스틱회귀 모델
from sklearn.linear_model import LogisticRegression
logistic = LogisticRegression()
logistic.fit(X_train_imputed, y_train)
logistic.predict(X_val_imputed)
- 정확도 .score(메소드)
print('검증세트 정확도', logistic.score(X_val_imputed, y_val))- 확률값
logistic.predict_proba(test_case)- 로지스틱회귀 모델의 계수
logistic.coef_
coefficients.sort_values().plot.barh();- 로지스틱회귀 모델 순서
- 훈련/검증/테스트 나누기
- 피쳐/타겟 선택
- 원핫인코딩, 결측치변환, 특성값표준화하기
from category_encoders import OneHotEncoder
from sklearn.impute import SimpleImputer
from sklearn.linear_model import LogisticRegression
from sklearn.preprocessing import StandardScaler
- 로지스틱회귀 모델 만들기
5.검증데이터로 예측하고, 정확도 보기
6.계수확인하기
- 절편(intercept)는 관측할 수 없는 예시로 해석이 유용하지 않음
