
fbprophet
시계열 데이터란?
시간에 흐름에 대해 특정 패턴과 같은 정보를 가지고 있는 경우
install
conda install pandas-datareader
pip install pystan
conda install plotly

conda install -c conda-forge fbprophet

pip install fbprophet
※ 안될 시
pip install prophetModule Load
- fbprohet이 update되면서 키워드가 변경됨.
from pandas_datareader import data
from prophet import Prophet
함수 기초
- 가장 기초적인 모양의 def 정의
- 이름(
test_df)과 입력 인자(a, b)를 정해준다 - 출력(
return)을 작성
def test_def(a, b):
    return a + b

test_def(2, 1)- global 변수를 def 내에서 사용하고 싶다면 global로 선언
- def 내에서의 변수와 밖에서의 변수는 같은 이름이어도 같은 것이 아니다
a = 1 # 전역변수

def edit_a(i):
    global a #
    a = i

edit_a(2)
함수 이용 그래프 그리기
import matplotlib.pyplot as plt
import numpy as np
%matplotlib inline
def plotSinWave(amp, freq, endTime, sampleTime, startTime, bias):
"""
plot sine wave
y = a sin(2 pi f t + t_0) + b
"""
time = np.arange(startTime, endTime, sampleTime)
result = amp * np.sin(2 * np.pi * freq * time + startTime) + bias
plt.figure(figsize=(12, 6))
plt.plot(time, result)
plt.grid(True)
plt.xlabel("time")
plt.ylabel("sin")
plt.title(str(amp) + "*sin(2*pi" + str(freq) + "*t+" + str(startTime) + ")+" + str(bias))
plt.show()
plotSinWave(2, 1, 10, 0.01, 0.5, 0)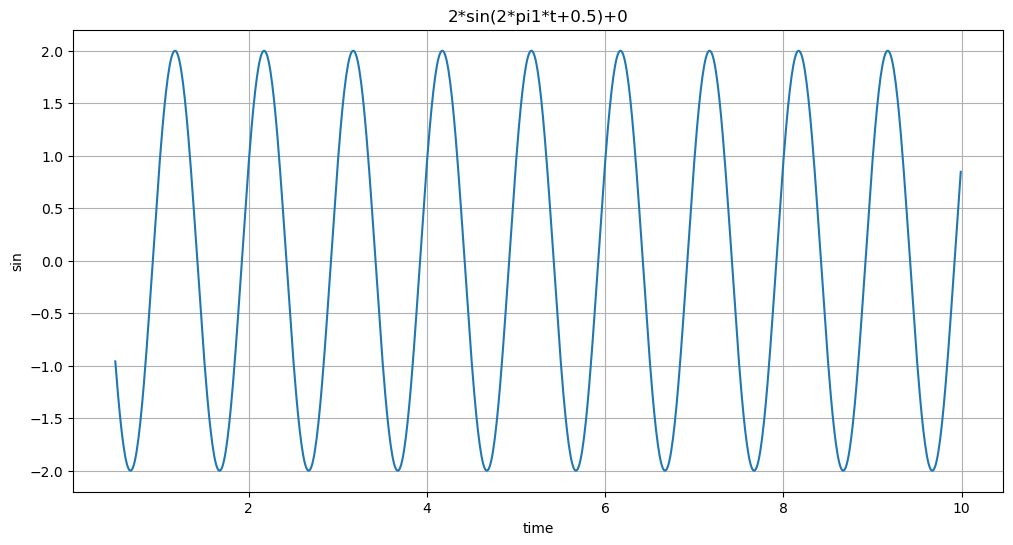
def plotSinWave(**kwargs):
    """
    plot sine wave
    y = a sin(2 pi f t + t_0) + b
    """
    endTime = kwargs.get("endTime", 1)
    sampleTime = kwargs.get("sampleTime", 0.01)
    amp = kwargs.get("amp", 1)
    freq = kwargs.get("freq", 1)
    startTime = kwargs.get("startTime", 0)
    bias = kwargs.get("bias", 0)
    figsize = kwargs.get("figsize", (12, 6))

    time = np.arange(startTime, endTime, sampleTime)
    result = amp * np.sin(2 * np.pi * freq * time + startTime) + bias

    plt.figure(figsize=(12, 6))
    plt.plot(time, result)
    plt.grid(True)
    plt.xlabel("time")
    plt.ylabel("sin")
    plt.title(str(amp) + "*sin(2*pi" + str(freq) + "*t+" + str(startTime) + ")+" + str(bias))
    plt.show()

plotSinWave()
plotSinWave(amp=2, freq=0.5, endTime=10)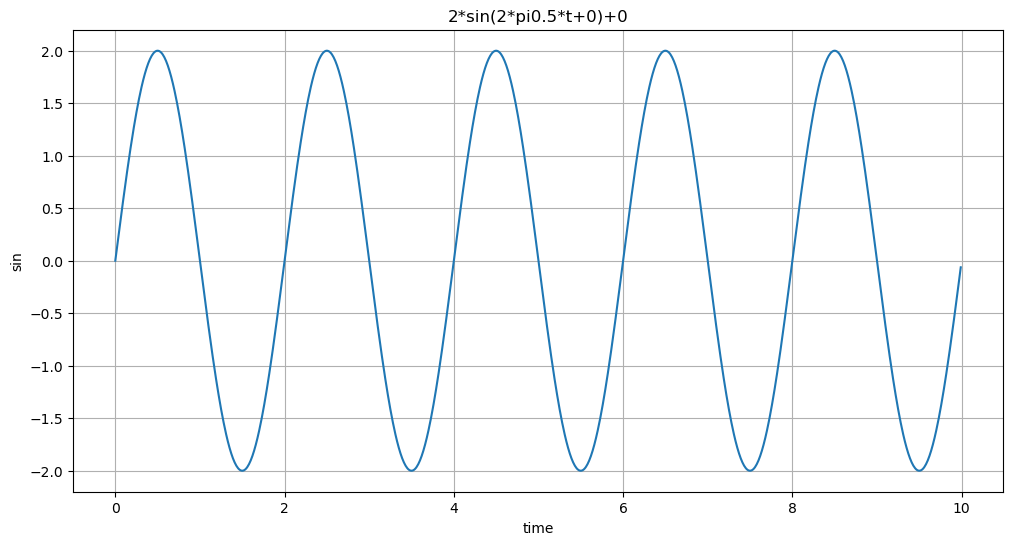
내가 만든 함수 Import
💡 Python 모듈(module)로 만들어서 import
%%writefile ./drawSinWave.py # drawSinWave.py을 만들겠다

import numpy as np
import matplotlib.pyplot as plt

def plotSinWave(**kwargs):
    """
    plot sine wave
    y = a sin(2 pi f t + t_0) + b
    """
    endTime = kwargs.get("endTime", 1)
    sampleTime = kwargs.get("sampleTime", 0.01)
    amp = kwargs.get("amp", 1)
    freq = kwargs.get("freq", 1)
    startTime = kwargs.get("startTime", 0)
    bias = kwargs.get("bias", 0)
    figsize = kwargs.get("figsize", (12, 6))

    time = np.arange(startTime, endTime, sampleTime)
    result = amp * np.sin(2 * np.pi * freq * time + startTime) + bias

    plt.figure(figsize=(12, 6))
    plt.plot(time, result)
    plt.grid(True)
    plt.xlabel("time")
    plt.ylabel("sin")
    plt.title(str(amp) + "*sin(2*pi" + str(freq) + "*t+" + str(startTime) + ")+" + str(bias))
    plt.show()

if __name__ == "__main__":
    print("hello world~!!")
    print("this is test graph!!")
plotSinWave(amp=1, endTime=2)- 함수를 만든 후, Import
import drawSinWave as dS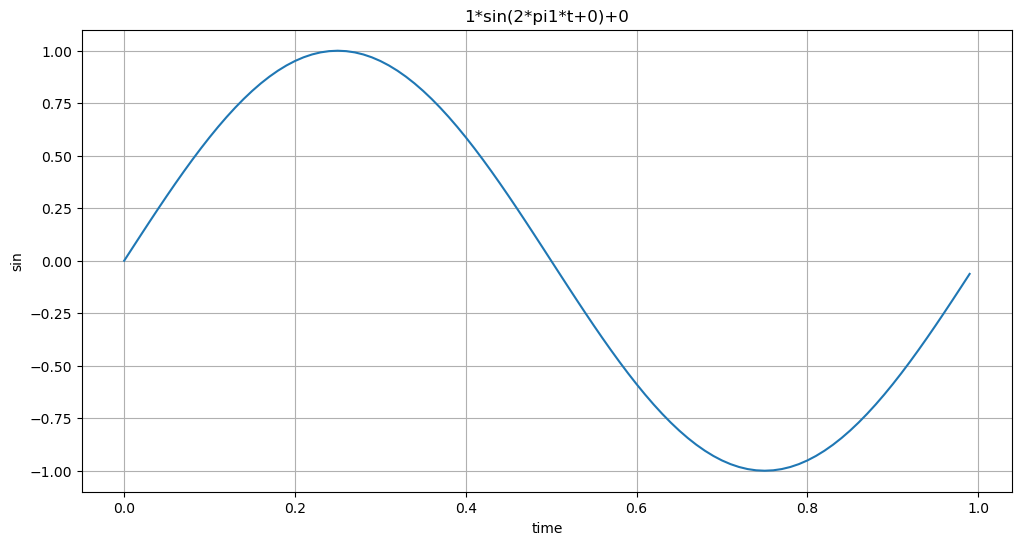
- 만든 함수를 구현
dS.plotSinWave()
그래프 한글 설정
%%writefile ./set_matplotlib_hangul.py

import platform
import matplotlib.pyplot as plt
from matplotlib import font_manager, rc

path = "c:/Windows/Fonts/malgun.ttf"

if platform.system() == "Darwin":
    print("Hangul OK in your MAC!!!")
    rc("font", family="Arial Unicode MS")
elif platform.system() == "Windows":
    font_name = font_manager.FontProperties(fname=path).get_name()
    print("Hangul OK in your Windows!!!")
    rc("font", family=font_name)
else:
    print("Unknown system.. sorry~~~")

plt.rcParams["axes.unicode_minus"] = False- import 확인
import set_matplotlib_hangul- 한글 문제여부 확인
plt.title("한글")
Prophet (구. Fbprophet) 기초
※ 안될 경우
conda install -c conda-forge prophet # conda 이용해서 한 번 더 설치Module Load
import pandas as pd
import numpy as np
import matplotlib.pyplot as plt
%matplotlib inline
예제 1
테스트 데이터 생성
time = np.linspace(0, 1, 365*2)
result = np.sin(2*np.pi*12*time)
ds = pd.date_range("2018-01-01", periods=365*2, freq="D")
df = pd.DataFrame({"ds": ds, "y": result})
df.head()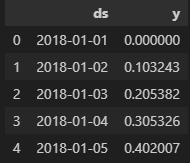
df["y"].plot(figsize=(10, 6));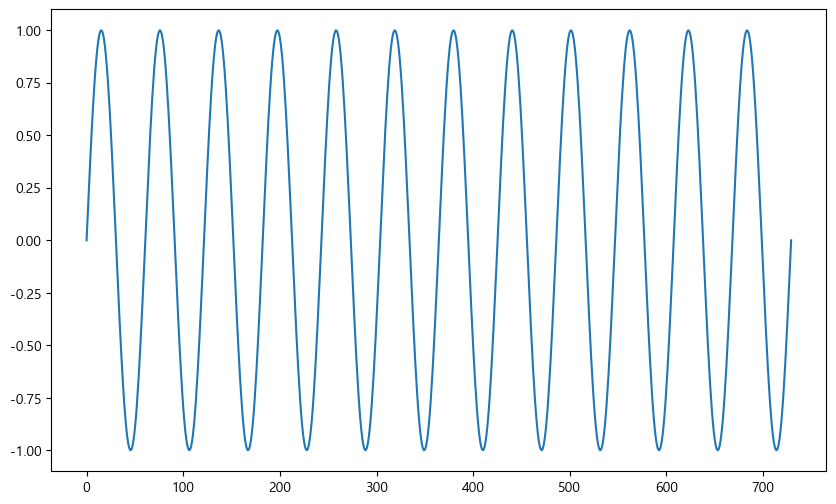
from pandas_datareader import data
from prophet import Prophet
m = Prophet(yearly_seasonality = True, daily_seasonality = True)
m.fit(df)Output :
11:59:35 - cmdstanpy - INFO - Chain [1] start processing 11:59:35 - cmdstanpy - INFO - Chain [1] done processing
future = m.make_future_dataframe(periods=30)
forecast = m.predict(future)m.plot(forecast)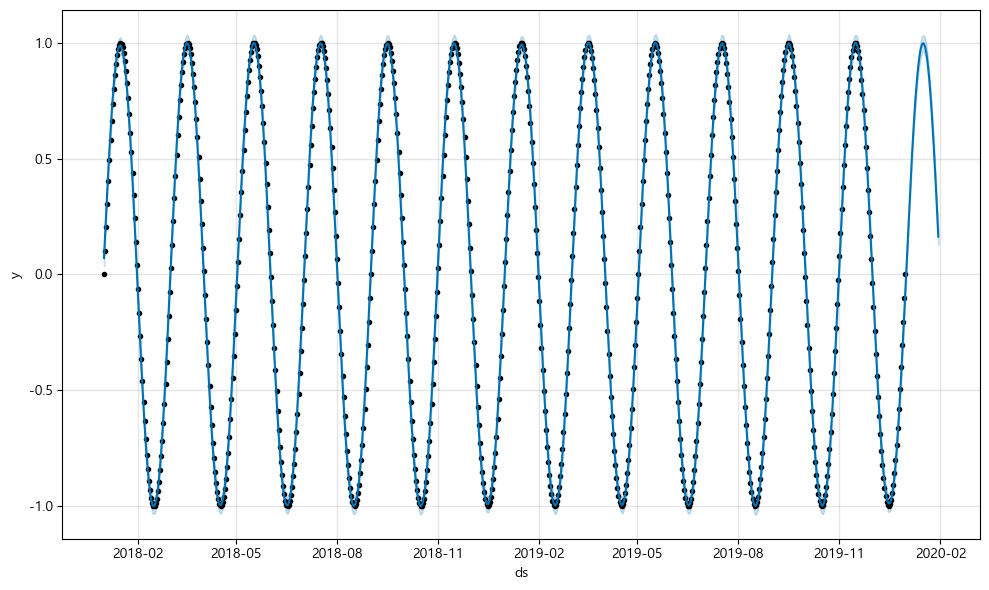
예제 2
time = np.linspace(0, 1, 365*2)
result = np.sin(2*np.pi*12*time) + time

ds = pd.date_range("2018-01-01", periods=365*2, freq="D")
df = pd.DataFrame({"ds": ds, "y": result})

df["y"].plot(figsize=(10, 6));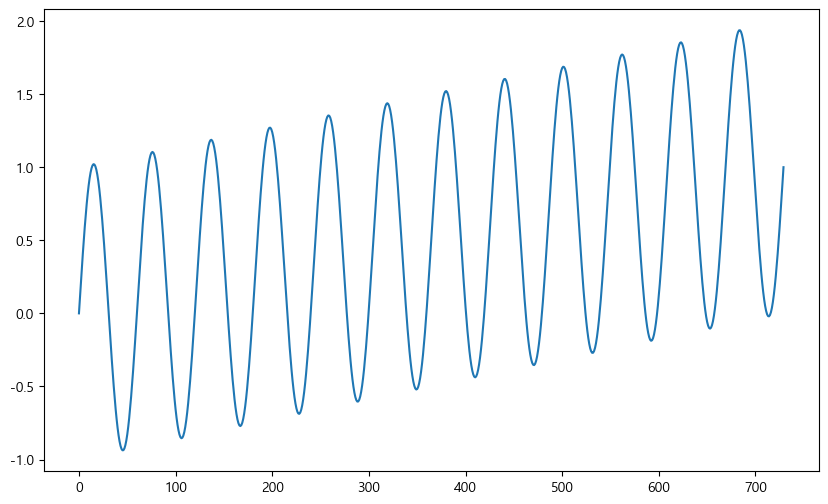
- 30일 간 예측을 원함
m = Prophet(yearly_seasonality=True, daily_seasonality=True)
m.fit(df)
future = m.make_future_dataframe(periods=30) # 30일간 예측을 원함
forecast = m.predict(future)
m.plot(forecast);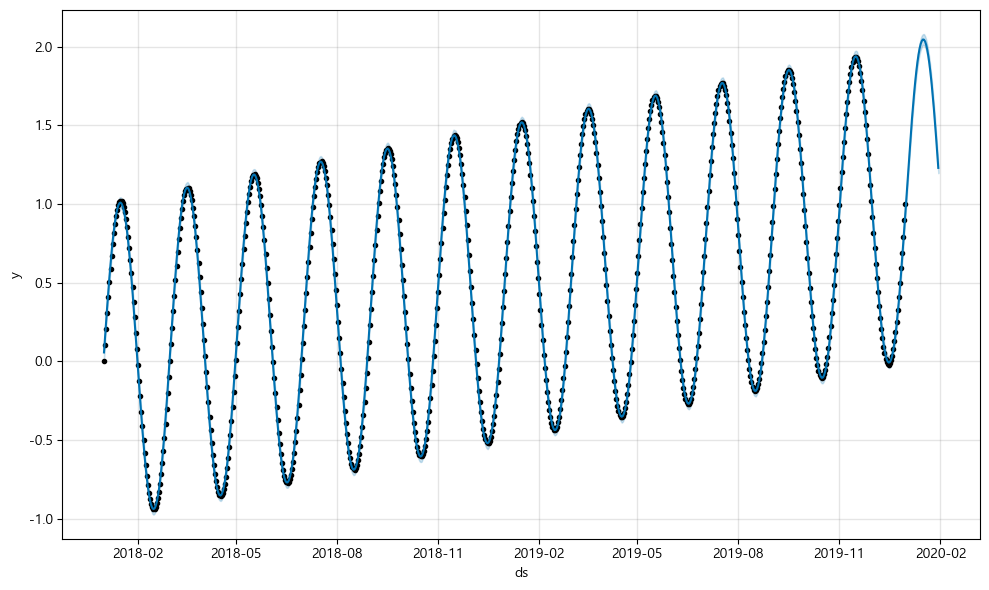
- Noise 추가
time = np.linspace(0, 1, 365*2)
result = np.sin(2*np.pi*12*time) + time + np.random.randn(365*2)/4 # noise 추가

ds = pd.date_range("2018-01-01", periods=365*2, freq="D")
df = pd.DataFrame({"ds": ds, "y": result})

df["y"].plot(figsize=(10, 6));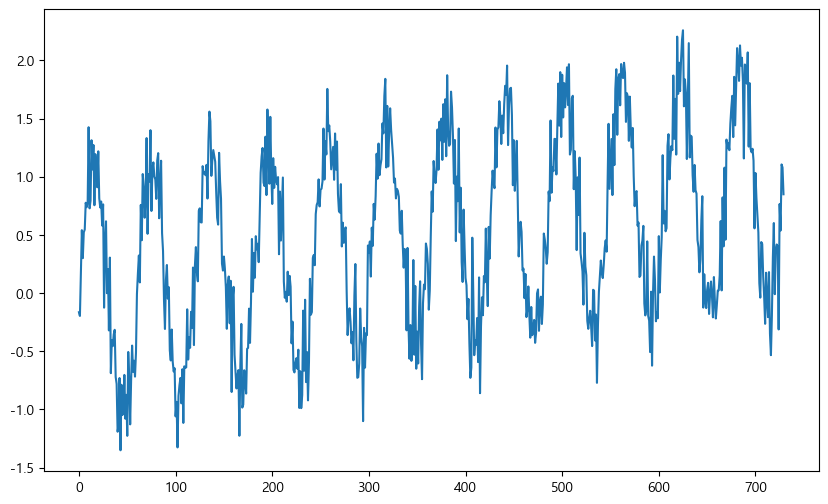
m = Prophet(yearly_seasonality=True, daily_seasonality=True)
m.fit(df)
future = m.make_future_dataframe(periods=30)
forecast = m.predict(future)
m.plot(forecast);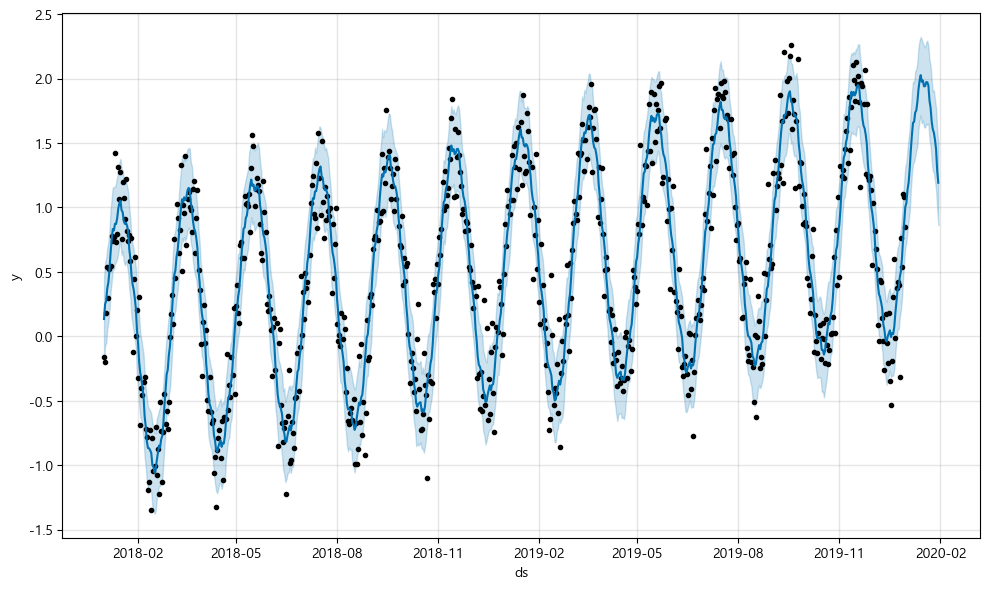

Start