Timeseries Anomaly Detection-(4)
Clustering : Outlier Detection using K-means
Use k-means to divide the normal and outlier data groups.
from sklearn.cluster import KMeans

kmeans = KMeans(n_clusters=2, random_state=0).fit(norm_rdf)
print(kmeans.labels_)

lbl, cnt = np.unique(kmeans.labels_,return_counts=True)
print(lbl)
print(cnt)[0 0 0 ... 0 0 0]
[0 1]
[2623 3007]Since the difference in the number of labels of 0 and 1 is not large, it is difficult to judge either of them as outliers, so the number of groups should be increased and analyzed.
from sklearn.cluster import KMeans

kmeans = KMeans(n_clusters=20, random_state=0).fit(norm_rdf)
lbl, cnt = np.unique(kmeans.labels_,return_counts=True,)
['group:{}-count:{}'.format(group, count) for group, count in zip(lbl, cnt)]['group:0-count:454',
'group:1-count:191',
'group:2-count:460',
'group:3-count:102',
'group:4-count:158',
'group:5-count:695',
'group:6-count:539',
'group:7-count:113',
'group:8-count:805',
'group:9-count:127',
'group:10-count:6',
'group:11-count:258',
'group:12-count:837',
'group:13-count:37',
'group:14-count:40',
'group:15-count:246',
'group:16-count:4',
'group:17-count:162',
'group:18-count:41',
'group:19-count:355']Groups 10, 13, 14, 16, and 18, which are particularly smaller than other groups, can be classified as singular groups and judged as outliers.
- See which days are categorized
df[(kmeans.labels_==10)|(kmeans.labels_==13)
 |(kmeans.labels_==14)|(kmeans.labels_==16)|(kmeans.labels_==18)]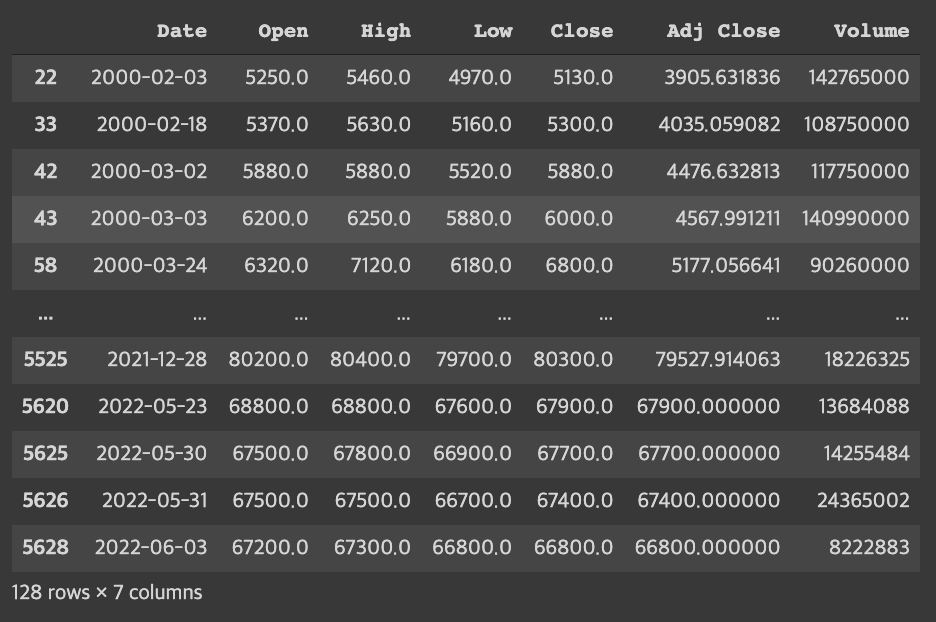
df.describe()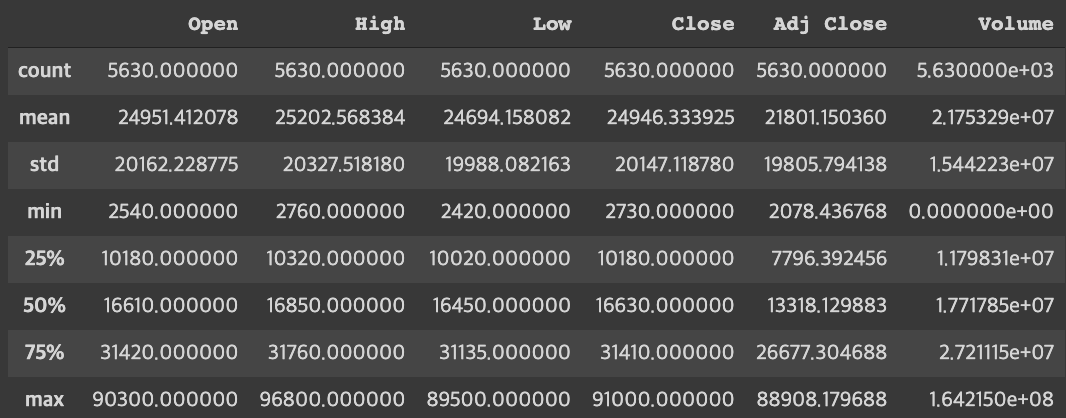
- Check the values at the center of each group
Group with a particularly high volume level: 13
Groups with particularly high or low Open, High, Low, and Close numbers: 10,14,16,18
fig = plt.figure(figsize=(15,9))
ax = fig.add_subplot(111)
df.Close.plot(ax=ax, label='Observed', legend=True, color='b')
tdf.Close.plot(ax=ax, label='Trend', legend=True, color='r')
rdf.Close.plot(ax=ax,label='Resid', legend=True, color='y')
plt.show()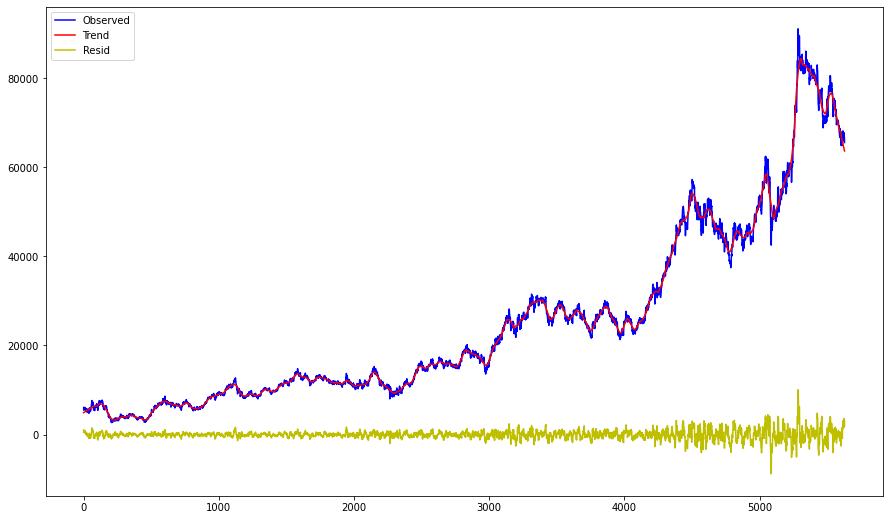
Blue: Actual Samsung Stock Price Index
Red: Trend
Yellow: Residual
The parts with a large difference in residuals can be classified into unexpected outliers.
Clustering: Exploring Outliers with DBSCAN
DBSCAN: Density-based spatial clustering with noise (DBSCAN), which uses dense clustering in clustering algorithms, is a method of clustering using distance between clusters, such as K Means or Hierarchical clustering.
In other words, if there are more than n points in the radius x based on a certain point, it is recognized as a single cluster.
from sklearn.cluster import DBSCAN

clustering = DBSCAN(eps=0.7, min_samples=2).fit(norm_rdf)
print(clustering)  # BSCAN(eps=0.7, min_samples=2)
print(clustering.labels_)  # [0 0 0 ... 0 0 0]

lbl, cnt = np.unique(clustering.labels_,return_counts=True)
['group:{}-count:{}'.format(group, count) for group, count in zip(lbl, cnt)]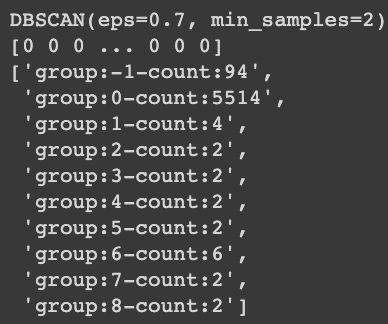
→ Groups of values other than group 0 where the majority of values are clustered can be identified as outliers.
