KNN 이란?
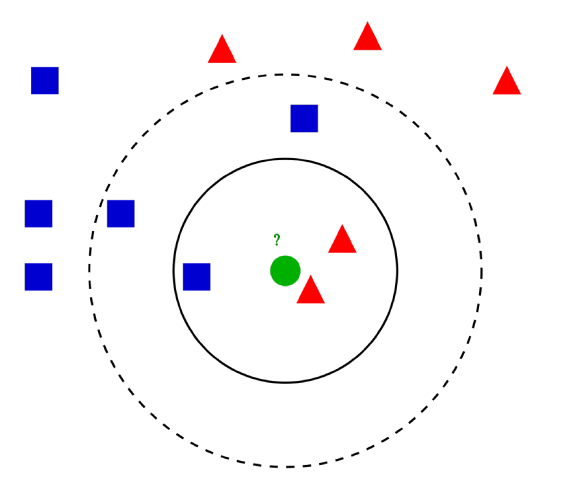
- 새로운 데이터가 주어졌을 때, 기존 데이터 중 가장 가까운 k개의 데이터를 정보로 새로운 데이터를 예측하는 방법론
K는 어떻게 정할까?
- 너무 큰 k는 미세한 경계부분을 잘못 분류할 것이다!
- 너무 작은 k는 이상치의 영향을 크게받을것이고, 패턴이 직관적이지 못할것이다!
Majority voting
- 위 그림을 예시로 Blue 데이터가 Red 데이터보다 훨씬 많다면?
- 거리에 반비례하는 Weight를 줄 필요가 있다! (거리(d)가 가까운(=유사도가 높은) 데이터에 좀 더 가중치를 준다는 뜻)
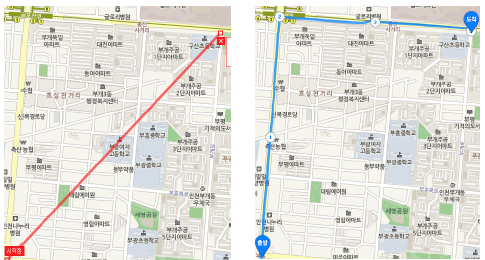
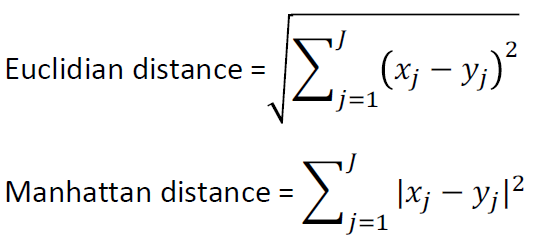
거리는 어떻게 구할래
- 범주형 변수 : Hamming distance
- 연속형 변수 : Euclidian distance, Manhattan distance
(예시)
K를 결정하는 방법에 대해서 알아보자!
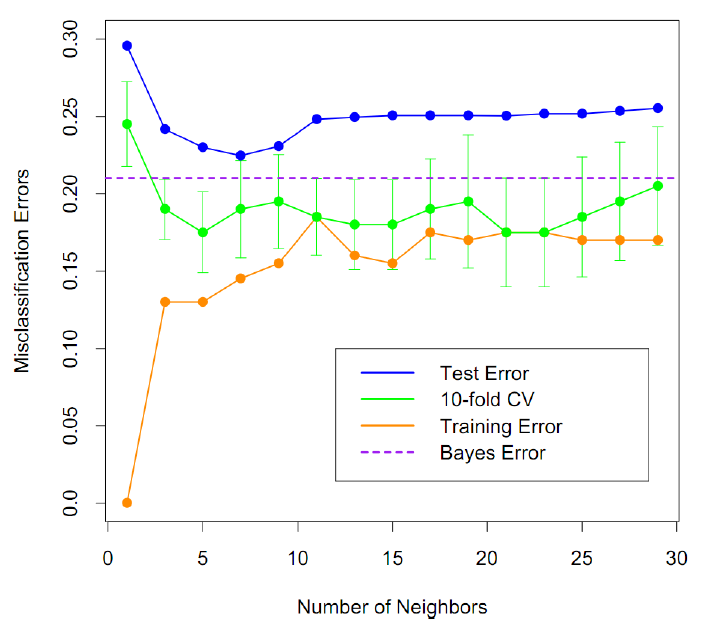
Training error
- k=1일때 가장 낮음
- 과적합의 가능성
Test error
- 데이터에 따라 최적의 k가 존재
k의 결정
- Test Error를 작게하는 k
- cross validation 이용
KNN algorithm 실습 코드
데이터, 모듈 불러오기 및 KNN 피팅
from sklearn import neighbors, datasets


import numpy as np
import matplotlib.pyplot as plt
from matplotlib.colors import ListedColormap

iris = datasets.load_iris()

X = iris.data[:, :2]
y = iris.target

# 모델 구축

clf = neighbors.KNeighborsClassifier(5)
clf.fit(X,y)

y_pred=clf.predict(X)

from sklearn.metrics import confusion_matrix

confusion_matrix(y,y_pred)
cross-validation을 이용해 k 찾기
from sklearn.model_selection import cross_val_score

k_range = range(1,100)
k_scores = []

for k in k_range:
    knn = neighbors.KNeighborsClassifier(k)
    scores = cross_val_score(knn, X, y, cv = 10, scoring='accuracy')
    k_scores.append(scores.mean())

plt.plot(k_range, k_scores)
plt.xlabel('Value of K for KNN')
plt.ylabel('Cross-validated accuracy')
plt.show()
Weight를 준 kNN
n_neighbors = 40

h = .02  # step size in the mesh

cmap_light = ListedColormap(['#FFAAAA', '#AAFFAA', '#AAAAFF'])
cmap_bold = ListedColormap(['#FF0000', '#00FF00', '#0000FF'])

for weights in ['uniform', 'distance']:
    clf = neighbors.KNeighborsClassifier(n_neighbors, weights=weights)
    clf.fit(X, y)

    # Plot the decision boundary. For that, we will assign a color to each
    # point in the mesh [x_min, x_max]x[y_min, y_max].
    x_min, x_max = X[:, 0].min() - 1, X[:, 0].max() + 1
    y_min, y_max = X[:, 1].min() - 1, X[:, 1].max() + 1
    xx, yy = np.meshgrid(np.arange(x_min, x_max, h),
                         np.arange(y_min, y_max, h))
    Z = clf.predict(np.c_[xx.ravel(), yy.ravel()])

    # Put the result into a color plot
    Z = Z.reshape(xx.shape)
    plt.figure()
    plt.pcolormesh(xx, yy, Z, cmap=cmap_light)

    # Plot also the training points
    plt.scatter(X[:, 0], X[:, 1], c=y, cmap=cmap_bold,
                edgecolor='k', s=20)
    plt.xlim(xx.min(), xx.max())
    plt.ylim(yy.min(), yy.max())
    plt.title("3-Class classification (k = %i, weights = '%s')"
              % (n_neighbors, weights))

plt.show()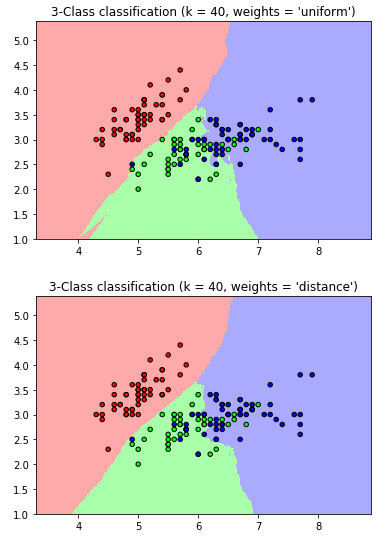
위와 같은 결과를 통해 weights를 distance로 정해준 경우가 더 부드럽게 분류해내는것을 볼 수 있다!