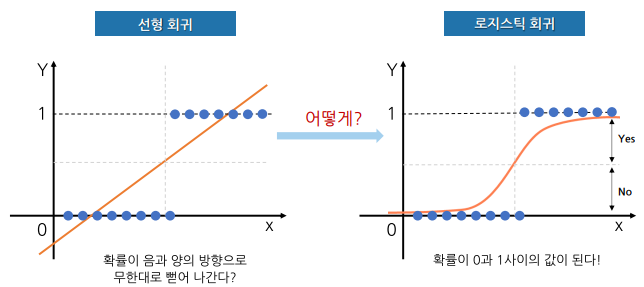
Logistic Regression
- 회귀를 사용하여 데이터가 어떤 범주에 속할 확률을 0과 1사이의 값으로 예측하고 그 확률에 따라 가능성이 더 높은 범주에 속하는 것으로 분류해주는 지도 학습 알고리즘
sigmoid function
- 시그모이드 함수
- 확률을 0 ~ 1 사이로 나타내는데 이걸 가능하게 해주는 게 바로
sigmoid 함수이다.
- 확률값 p는 선형 판별식 값이 커지면 1, 작아지면 0에 가까운 값이 됨
임계값
- 로지스틱 회귀 알고리즘의 결과 값은 '분류확률'
- 기본 임계값은 0.5이다.
분류 모델 구현만 가능
- 알고리즘 함수:
sklearn.linear_model.LogisticRegression - 성능평가 함수:
sklearn.metrics.confusion_matrix,sklearn.metrics.classification_report등
# 불러오기
from sklearn.linear_model import LogisticRegression
from sklearn.metrics import confusion_matrix, classification_report

# 선언하기
model = LogisticRegression()

# 학습하기
model.fit(x_train, y_train)

# 예측하기
y_pred = model.predict(x_test)

# 평가하기
print(confusion_matrix(y_test, y_pred))
print(classification_report(y_test, y_pred))
모델 살펴보기
#회귀계수 확인
print(model.coef_)
print(model.intercept_)

#선형 판별식( f(x), z)
z = model.decision_function(x_test)
print(z[10:21])

#시그모이드 함수
from scipy.special import expit
print(expit(z)[10:21].round(2))

#우리가 에상했던 값
y_pred[10:21]

#확률값 확인
p = model.predict_proba(x_test)
print(p[10:21])
임계값 조정
#확률값 얻기
p = model.predict_proba(x_test)

#1의 확률
p1 = p[:,1]
print(p1[:10])

#임계값 = 0.5
y_pred2 = [1 if x > 0.5 else 0 for x in p1]
print(y_pred2[:10])
print(classification_report(y_test,y_pred2))
난 성미다.