
시계열 데이터
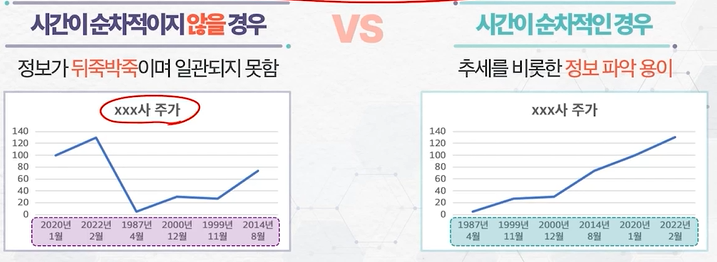
- 순차적인 시간의 흐름으로 기록된 관측치의 집합
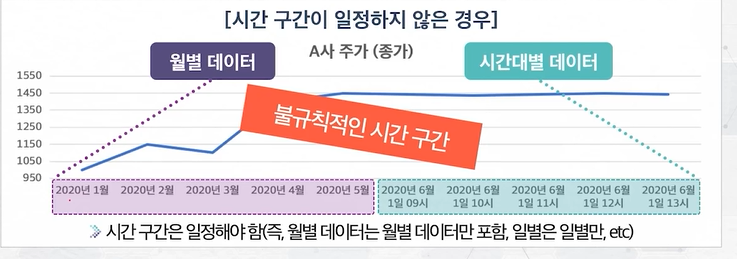
시계열 데이터는 고정된 시간 구간으로 나타나야 함
(즉, A 구간은 일별, B 구간은 월별인 데이터는 존재 불가
특징
-
순차적인 시간의 흐름
-
고정된 시간 구간의 관측치
Pandas의 시계열데이터
DatatimeIndex자료형 사용 -pd.to_datatime()
Pandas의 Resample
일별 -> 월별 / 월별 -> 일별 등 시간 간격 재조정 가능-
down-sampling
- 시간 구간을 크게 만들어 데이터 양이 감소한다면
down-sampling라고함 - 원래의 데이터가 그룹으로 묶여 대표 값 필요
- 시간 구간을 크게 만들어 데이터 양이 감소한다면
-
up-sampling
up-sampling: 실제로 존재하지 않은 데이터를 만듦
시간 그래프(Time Plot)
패턴, 이상치, 시간에 따른 변화, 계절성 등의 데이터의 많은 특징을 눈으로 볼 수 있게 해줌
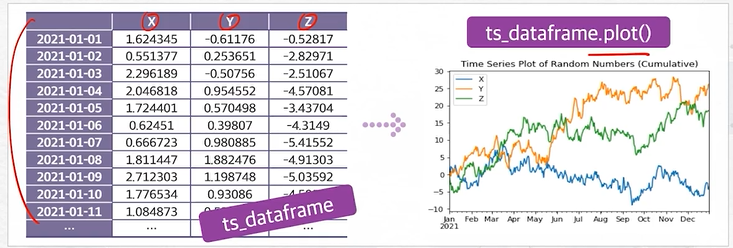
Pandas의 시도표 시각화
pandas.DataFrame.plot()
pd.to_datetime
#날짜 - 콤마 띄어쓰기 가능
date = ['2020/01/01', '2020/01/01', '2020/01/01', '2020/01/01'] #날짜 문자열
date_idx = pd.to_datetime(date) #날짜 문자열 -> Datetimeindex
pd.date_range
#시작일과 기간을 인수
pd.date_range('2020-1-1', '2020-5-31') #해당기간 일별데이터 출력
#월별 데이터 출력
pd.date_range('2020-1-1', '2020-5-31' freq='M') #M : 월말, MS : 월초
freq인수
D: 일별
W: 주별 (일요일기준)
W-MON: 주별 (월요일기준)
M: 월 말
MS: 월 초
B: 주말 제외 평일
#종료일 명시
pd.date_range(start='2020-1-1', periods=45) #일별데이터 리턴
시계열의 shift
np.random.seed(1) # 고정된 난수만 출력하도록 시드 설정
arr = np.random.randn(12) # 가우시안 정규분포 확률을 따르는 난수 12개 설정

ts_idx = pd.date_range('2020-1-1', periods=12, freq='MS') #해당 난수값의 날짜 인덱스 생성

ts = pd.Series(arr, index=ts_idx) #시리즈 생성
print(ts)

#1개월치 데이터 이동
ts.shift(1)
#4개월치 데이터 이동
ts.shift(4)
#각 월 첮주 일요일 기준으로 데이터 이동
ts.shift(1, freq='W')
diff(n): 행 - n기간전 행
#1개월치 차분 값 연산
ts.diff(1) #차분 값 = 현재 달 - 1달 전
#연산 방식
ts[1] - ts[0]
resample
np.random.seed(1) #고정된 난수 출력을 위해 시드 설정

arr = np.random.randn(365) #365일치 난수 생성
time_idx = pd.date_range('2021-1-1', periods=365, freq='D')

ts = pd.Series(arr, index=time_idx)
print(ts)
down-sampling
ts.resample('M').mean() #일별 -> 월별up-sampling
#없는데이터만들어야함
arr = np.random.randn(10)
time_idx = pd.date_range('2021-1-1', periods-10, freq='W') #주별 데이터 10개 생성

ts = pd.Series(arr, index=time_idx)
print(ts)

#foward filling / ffill: 각 기간의 첫일을 참고하여 결측값 보관
ts.resample('D').ffill().head(21)
#backward filling : 각기간의 마지막날
ts.resample('D').bfill().head(21)
시계열 데이터 시각화
import numpy as np
import pandas as pd
import matplotlib.pyplot as plt #그래프 상세 속성
np.randam.seed(1)
ts_data = np.random.randn(365, 3) #365x3행렬 난수
ts_idx = pd.date_range(start='2021-1-1', periods=365, freq='D') #365개 시계열인덱스 생성
ts_df = pd.DataFrame(ts_data, index=ts_idx) #시계열 데이터 프레임
ts_df.head() #데이터 출력
ts_df.columns = ['X','Y','Z'] #열 이름 지정
ts_df.plot()
plt.title('~~~') #제목
plt.show() #그래프 출력# 누적합 함수를 이용하여 알아보기 쉽게 각 시리즈 변경
ts_df = ts_df.cumsum() #누적합 메소드 이용
ts_df.plot()
plt.title('~~')
plt.show()
ts_df.plot(figsize=(10, 3))
plt.title('~~')
plt.xlabel('~')
plt.ylabel('~') #x축 y축 이름
난 성미다.