

# 2023년 3월 31일부로 현재 네이버영화 서비스가 종료됨.. 아놔
# raw 데이터는 강의자료에 있으니, 데이터프레임 만들고 저장하기 전까지는 코드만 타이핑하고,
# 출력본은 강의자료에 있는걸 캡처해서 정리하자.
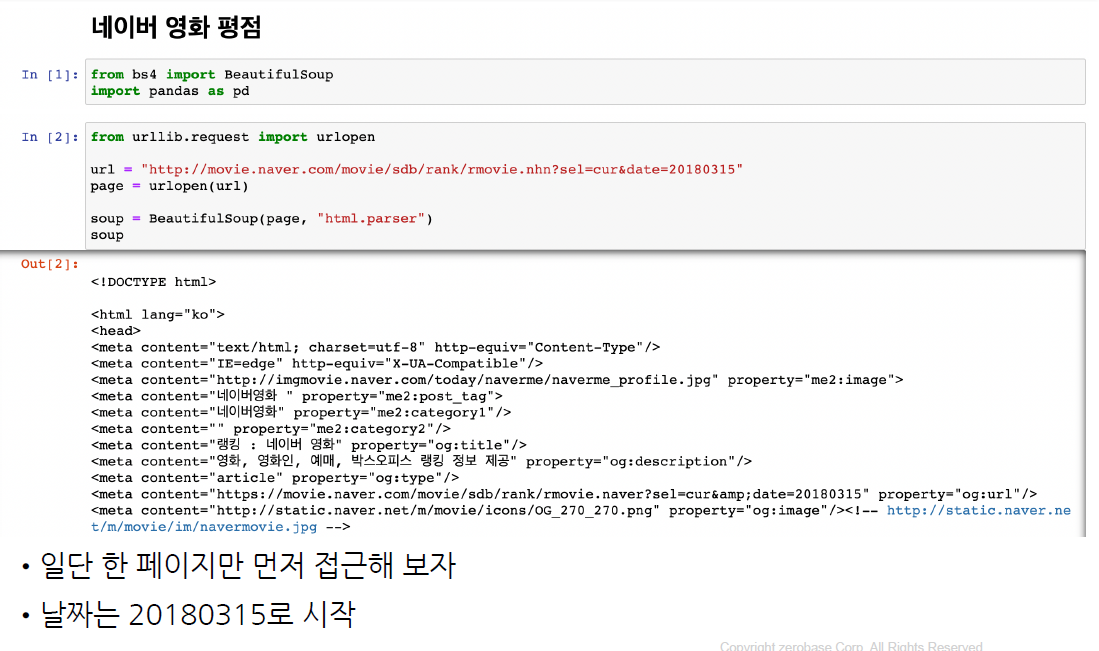
# 일단 한 페이지만 먼저 접근해보자
# 날짜는 20180315로 시작
from bs4 import BeautifulSoup
import pandas as pd
from urllib.request import urlopen
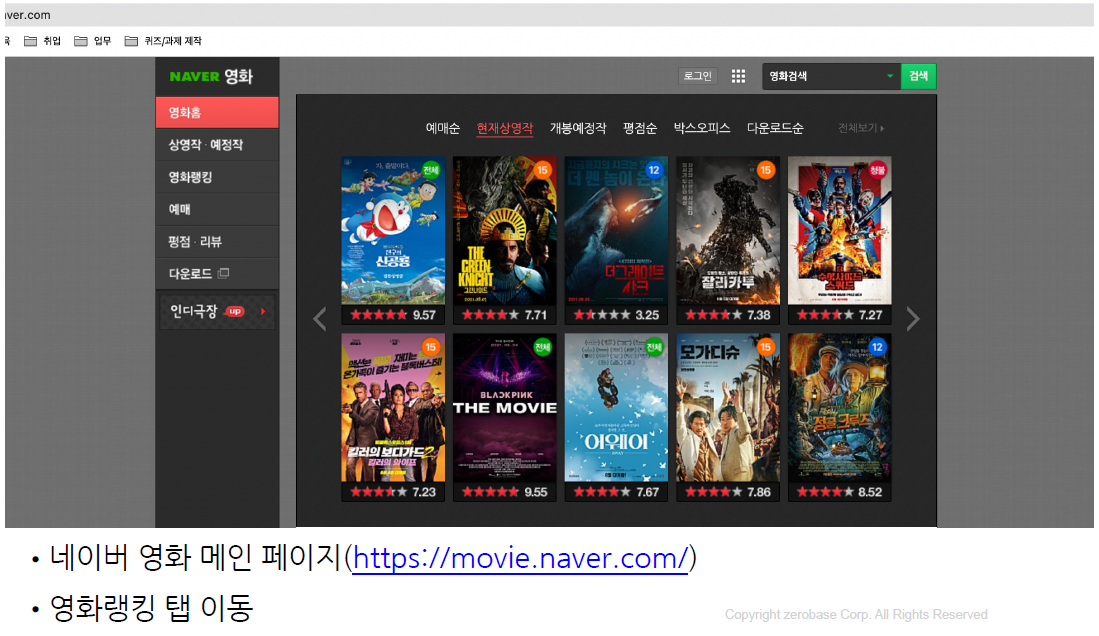
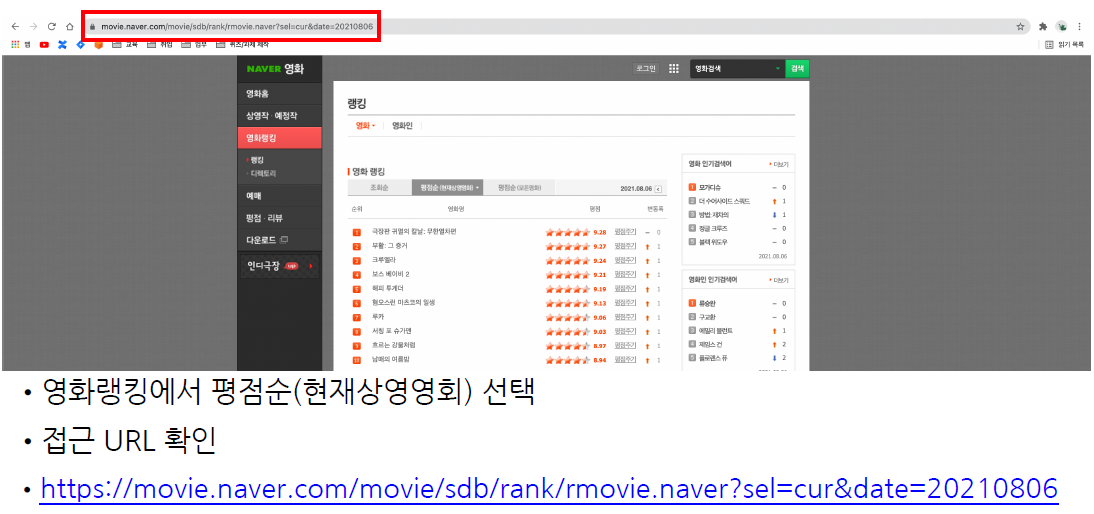
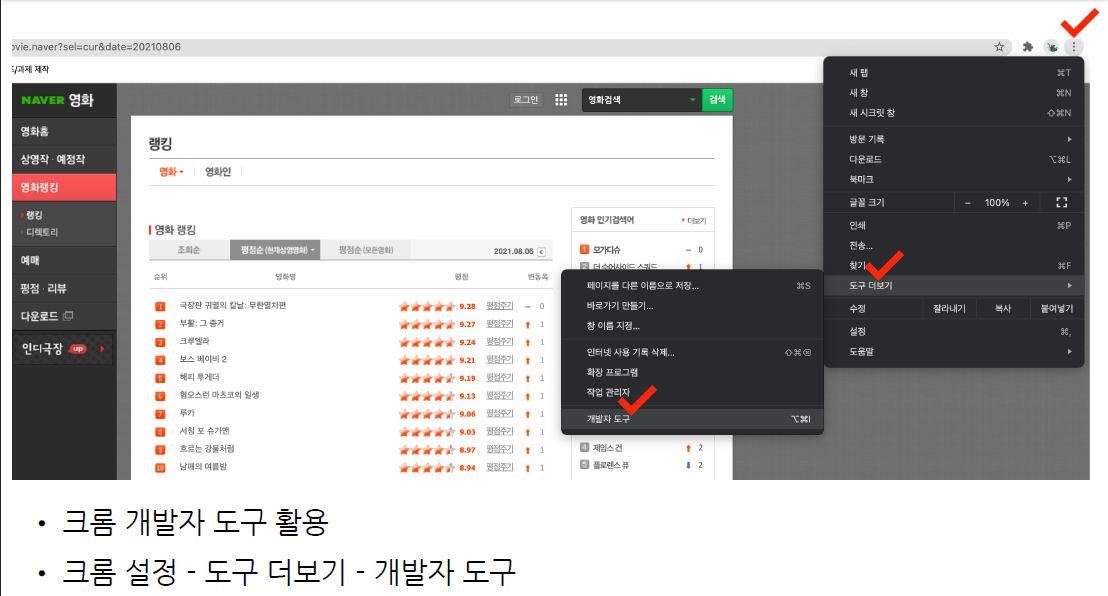
# 영화랭킹 탭 이동
# 영화랭킹에서 평점순(현재상영영화) 선택 > 그게 아래 url 주소이다
# 원하는 정보를 얻기 위해서 변화시켜줘야하는 주소의 규칙을 찾을 수 있습니다.
# 여기에서는 날짜 정보를 변경해주면 해당 페이지에 접근이 가능합니다
url = "https://movie.naver.com/movie/sdb/rank/rmovie.naver?sel=cur&date=20210806"
page = urlopen(url)
# page.status 했을 때 200이 나와야 정상이다
soup = BeautifulSoup(page, "html.parser")
soup
# print(soup.prettify())
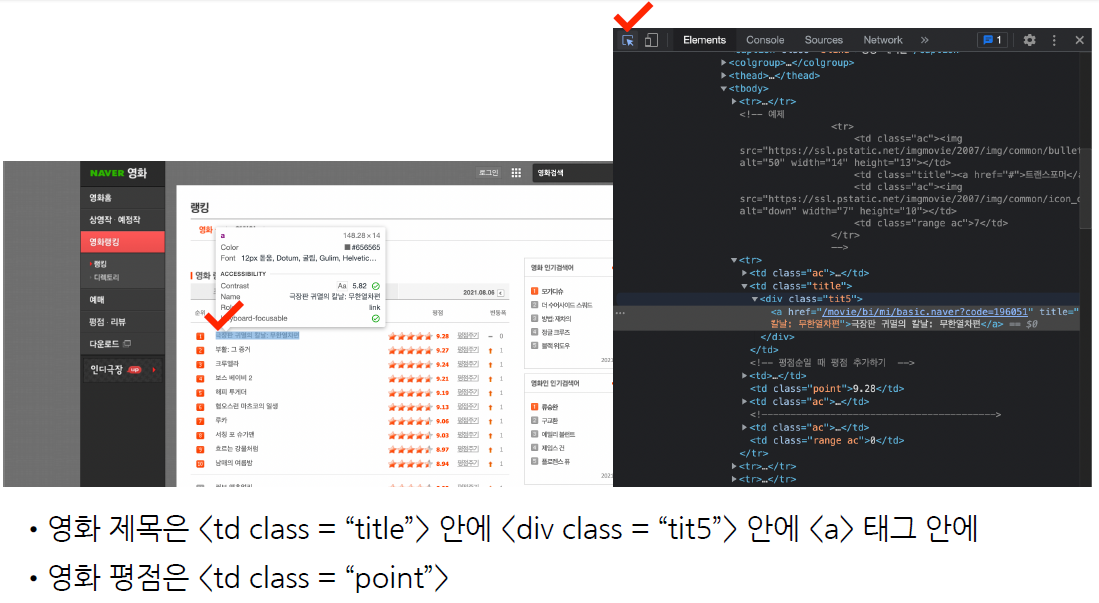
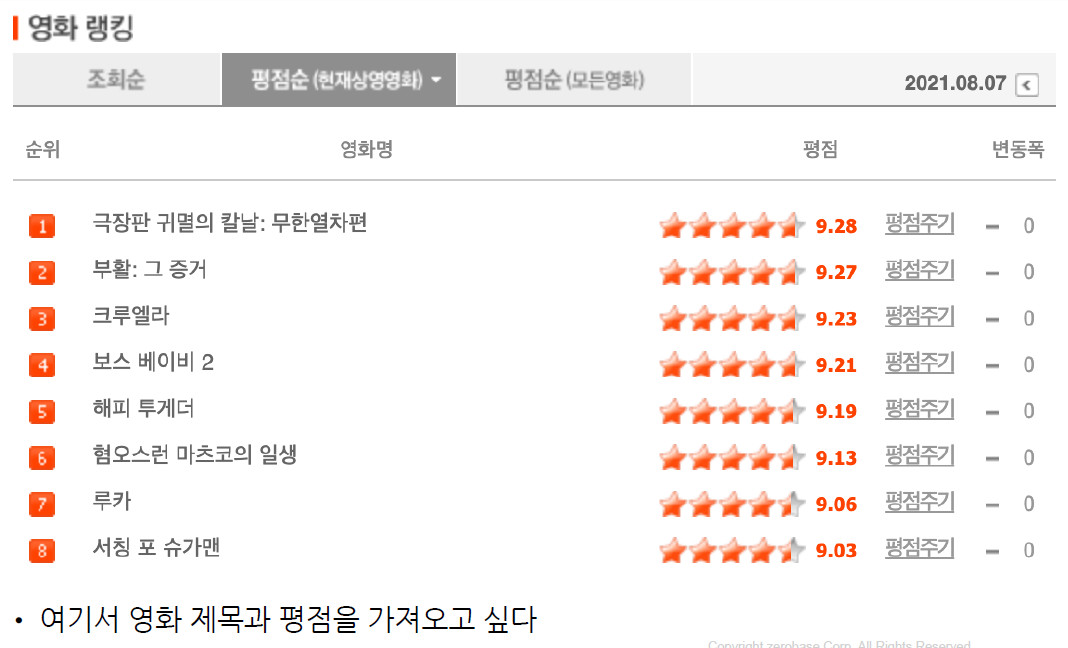
soup.find_all("div", "tit5")
#  soup.select("div.tit5") div 태그, 점(.)은 클래스를 의미함
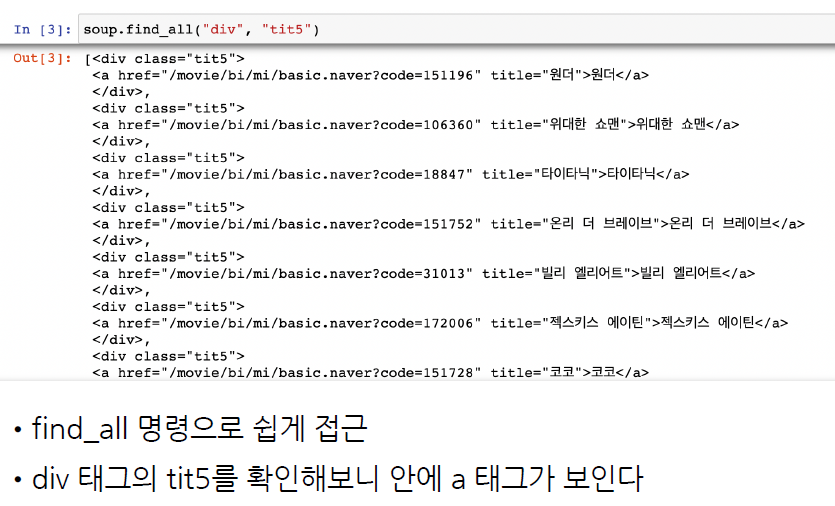
# 영화제목은 a 태그에서 string 으로 글자를 가져오면 알 수 있다.
soup.find_all("div", "tit5")[0].a
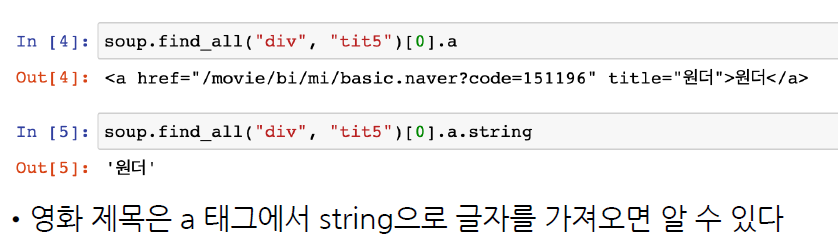
soup.find_all("div", "tit5")[0].a.string
# soup.select(".tit5")[0].find("a").text
# soup.select(".tit5")[0].select_one("a").get_text()
>> '원더'
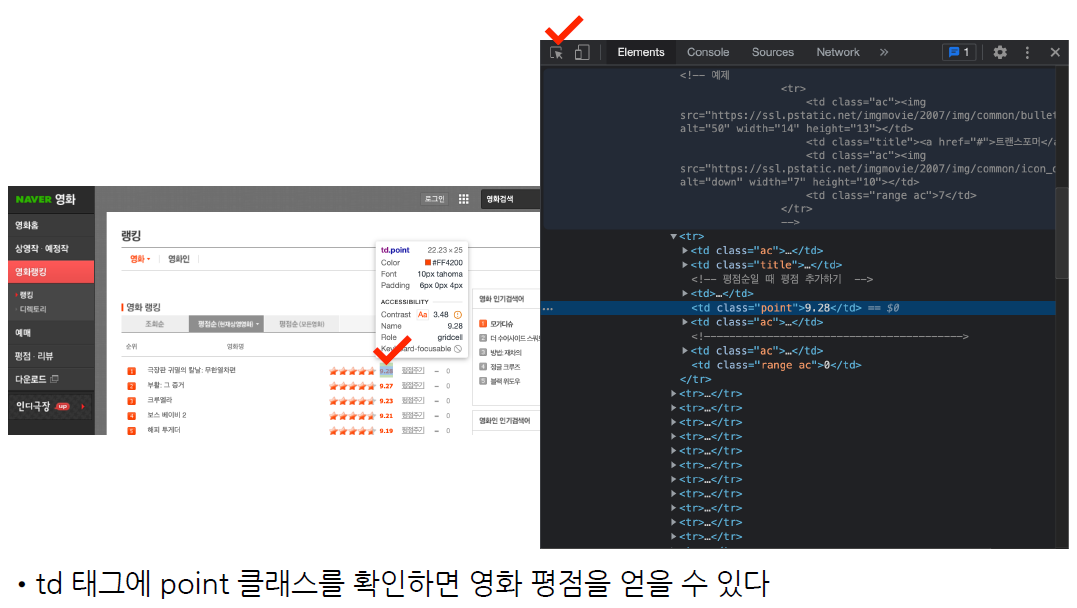
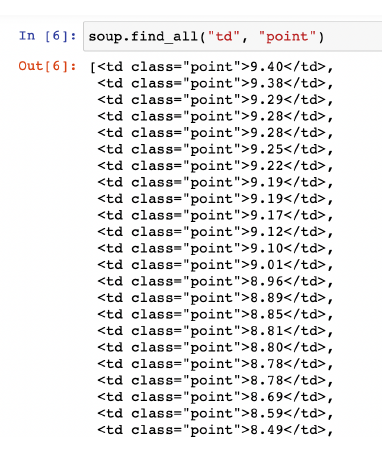
# 영화 평점 태그
soup.find_all("td", "point")
# soup.select(".point")
len(soup.find_all("td", "point"))
>> 46
-----------------------
soup.find_all("td", "point")[0].string
# soup.find_all("td", class_="point")[0].text
# soup.select("td.point")[0].string
>> '9.40'
-------------------------
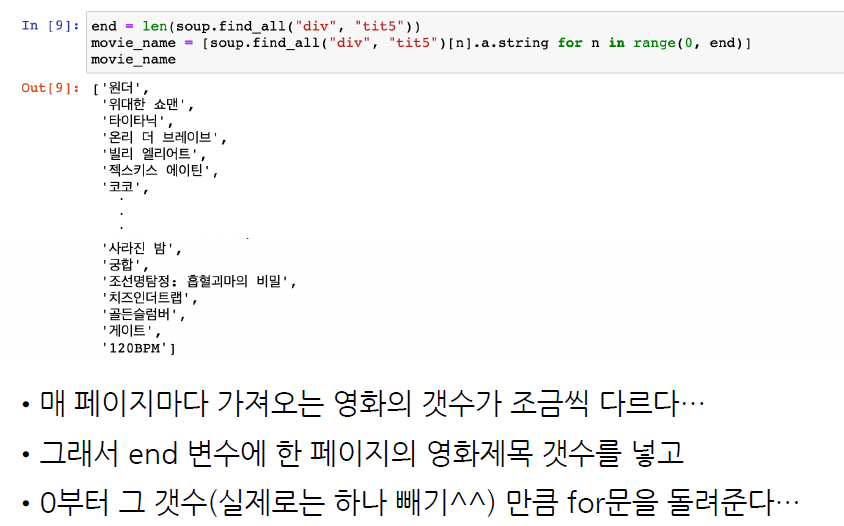
# 영화 제목 리스트 만들기
# 페이지마다 가져오는 영화의 개수가 다르다.
# 그래서 end 변수에 한 페이지 마다의 영화제목 개수를 넣고
# 0부터 그 갯수(실제로는 하나 빼기)만큼 for문을 돌려준다
end = len(soup.find_all("td", "tit5"))
movie_name = [soup.find_all("td", "tit5")[n].a.string for n in range(0, end)]
# 아래는 강의 코드
end = len(soup.find_all("td", "tit5"))
movie_name - []
for n in range(0, end):
movie_name.append(
soup.find_all("div", "tit5")[n].a.string
)
# 포인트도 위와 같은 방법으로 돌려준다
end = len(soup.find_all("td", "point"))
movie_point = [soup.find_all("td", "point")[n].a.string for n in range(0, end)]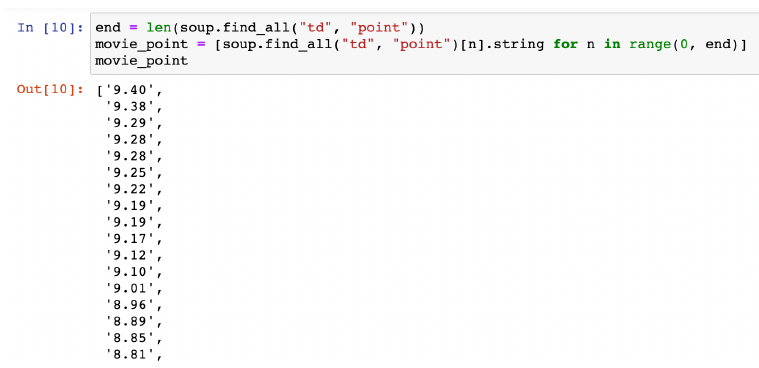
len(movie_name), len(movie_point)
>> (46, 46)
# pandas 를 이용하면 손쉽게 날짜 리스트를 만들 수 있다.
# 2017-12-01 부터 100일 생성
# freq="D" D:DAY, 즉 하루 기준으로 날짜들을 만든다

date = pd.date_range("2017.12.01", periods=100, freq="D")
date
>>
DatetimeIndex(['2017-12-01', '2017-12-02', '2017-12-03', '2017-12-04',
               '2017-12-05', '2017-12-06', '2017-12-07', '2017-12-08',
               '2017-12-09', '2017-12-10', '2017-12-11', '2017-12-12',
               '2017-12-13', '2017-12-14', '2017-12-15', '2017-12-16',
               '2017-12-17', '2017-12-18', '2017-12-19', '2017-12-20',
               '2017-12-21', '2017-12-22', '2017-12-23', '2017-12-24',
               '2017-12-25', '2017-12-26', '2017-12-27', '2017-12-28',
               '2017-12-29', '2017-12-30', '2017-12-31', '2018-01-01',
               '2018-01-02', '2018-01-03', '2018-01-04', '2018-01-05',
               '2018-01-06', '2018-01-07', '2018-01-08', '2018-01-09',
               '2018-01-10', '2018-01-11', '2018-01-12', '2018-01-13',
               '2018-01-14', '2018-01-15', '2018-01-16', '2018-01-17',
               '2018-01-18', '2018-01-19', '2018-01-20', '2018-01-21',
               '2018-01-22', '2018-01-23', '2018-01-24', '2018-01-25',
               '2018-01-26', '2018-01-27', '2018-01-28', '2018-01-29',
               '2018-01-30', '2018-01-31', '2018-02-01', '2018-02-02',
               '2018-02-03', '2018-02-04', '2018-02-05', '2018-02-06',
               '2018-02-07', '2018-02-08', '2018-02-09', '2018-02-10',
               '2018-02-11', '2018-02-12', '2018-02-13', '2018-02-14',
               '2018-02-15', '2018-02-16', '2018-02-17', '2018-02-18',
               '2018-02-19', '2018-02-20', '2018-02-21', '2018-02-22',
               '2018-02-23', '2018-02-24', '2018-02-25', '2018-02-26',
               '2018-02-27', '2018-02-28', '2018-03-01', '2018-03-02',
               '2018-03-03', '2018-03-04', '2018-03-05', '2018-03-06',
               '2018-03-07', '2018-03-08', '2018-03-09', '2018-03-10'],
              dtype='datetime64[ns]', freq='D')
 ------------------------------
date[0]

>> Timestamp('2017-12-01 00:00:00', freq='D')
 -----------------------------
date[0].strftime("%Y-%m-%d")
>> '2017-12-01'
-------------------------------
date[0].strftime("%y.%m.%d")
>> '17.12.01'
-------------------------------
# 문자열 포매팅

# 파이썬의 string(문자형) 데이터형은 format 이라는 재미난 기능이 있다.
# {}중괄호로 두고, format 옵션으로 손쉽게 내용을 만들 수 있다.
test_string = "Hi, I'm {name}"
print(test_string.format(name="MeRui"))
print(test_string.format(name="HeoJae"))

>>
Hi, I'm MeRui
Hi, I'm HeoJae
-------------------------------
from tqdm import tqdm_notebook
import time

# 얻고싶은 데이터를 저장할 빈 리스트 생성

movie_date = []
movie_name = []
movie_point = []

# 100일간의 데이터를 for문으로 받아온다
for today in tqdm_notebook(date):
    html = "https://movie.naver.com/movie/sdb/rank/rmovie.naver?sel=cur&date={date}"
    reponse = urlopen(html.format(date=today.strftime("%Y%m%d")))
    soup = BeautifulSoup(reponse, "html.parser")
    # 여기까지가 요청하고 응답받아서 html 에 받는것 까지 됨
    end = len(soup.find_all("td", "point"))

    movie_date.extend([today for n in range(0, end)])
    # 위 today for n in 에서 n 은 단순 문자이므로 for _ in 으로 해줘도 된다
    movie_name.extend([soup.find_all("td", "tit5")[n].a.string for n in range(0, end)])
    # movie_name.extend([soup.select("div.tit5")[n].find("a").get_text() for n in range(0, end)])
    movie_point.extend([soup.find_all("td", "point")[n].a.string for n in range(0, end)])

    time.sleep(5)
-------------------------------
len(movie_date), len(movie_name), len(movie_point)
>> (4655, 4655, 4655)
-------------------------------
# 판다스 데이터프레임으로 만들자
# 이 데이터는 raw data 가 된다
movie = pd.DataFrame({"date": movie_date, "name": movie_name, "point":movie_point})
movie.head()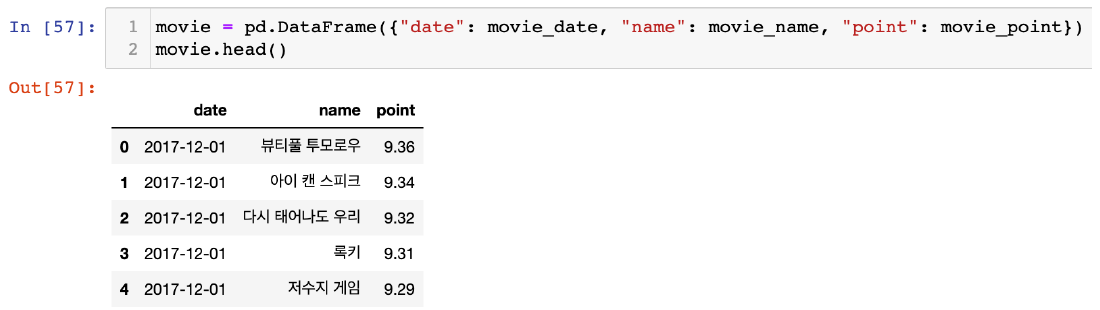
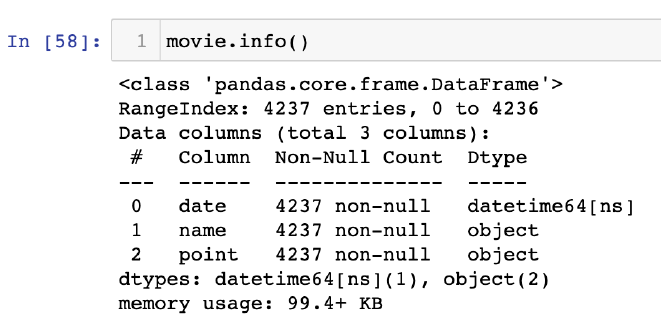
movie.info()
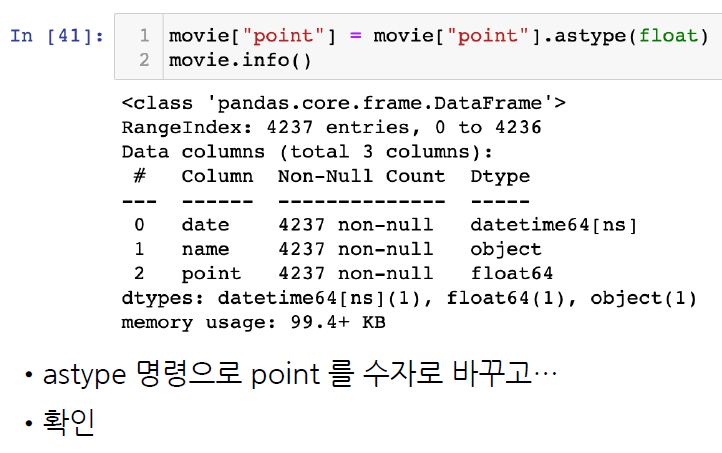
# astype 으로 point를 숫자로 바꾼다
movie["point"] = movie['point'].astype(float)
movie.info()
# 저장
movie.to_csv("../data/04_naver_movie_raw_data.csv", sep=",", encoding="utf-8")
-------------------------------
import numpy as np
import pandas as pd

movie = pd.read_csv("../data/04_naver_movie_raw_data.csv", index_col=0)
movie.tail()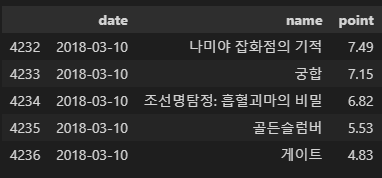
# 영화이름으로 인덱스를 잡고 점수의 합산을 구한다
# 100일 간 네이버 영화 평점 합산 기준 베스트 10을 뽑을 수 있다
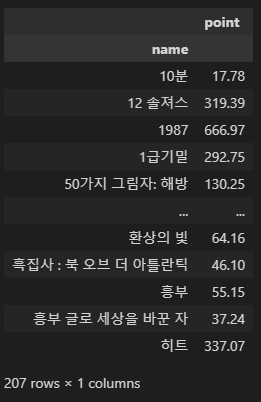
movie_unique = pd.pivot_table(movie, index=["name"], aggfunc=np.sum)
movie_unique
# 영화이름으로 인덱스를 잡고 점수의 합산을 구한다
# 100일 간 네이버 영화 평점 합산 기준 베스트 10을 뽑을 수 있다
# 정렬한다
movie_unique = pd.pivot_table(movie, index=["name"], aggfunc=np.sum)
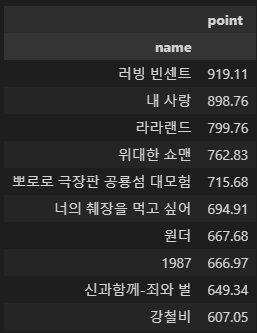
movie_best = movie_unique.sort_values(by="point", ascending=False) # 내림차순 정렬
movie_best.head(10)
# 데이터프레임의 검색 명령으로 qeury 명령도 있다
# 해당 영화의 날짜별 평점이 나온다
tmp = movie.query("name==['1987']")
tmp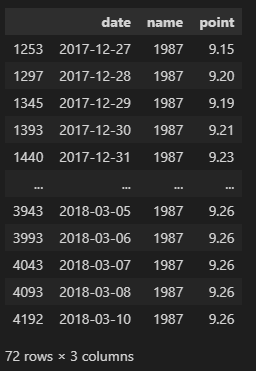
# 그래프를 그리기 위한 설정
import matplotlib.pyplot as plt
from matplotlib import rc

rc("font", family="Malgun Gothic")
#%matplotlib.inline
get_ipython().run_line_magic("matplotlib", "inline")


plt.figure(figsize=(20, 8))
plt.plot(tmp["date"], tmp["point"])
# plot 선 그래프
# x 축 날짜, y축 평점
# 날짜에 따른 평점 변화를 선그래프로 표현(시계열)
plt.title("날짜별 평점") # 그래프 제목
plt.xlabel("날짜") # x 라벨
plt.ylabel("평점") # y 라벨
plt.xticks(rotation="vertical") # x 축 날짜 이름들을 세로로 표현하기
plt.legend(labels=["평점 추이"], loc="best")
# 레전드 이름 : "평점 추이", loc="best" : 레전드 위치는 알아서 베스트로 잡아줘
plt.grid(True) # 배경 격자무늬 True
plt.show()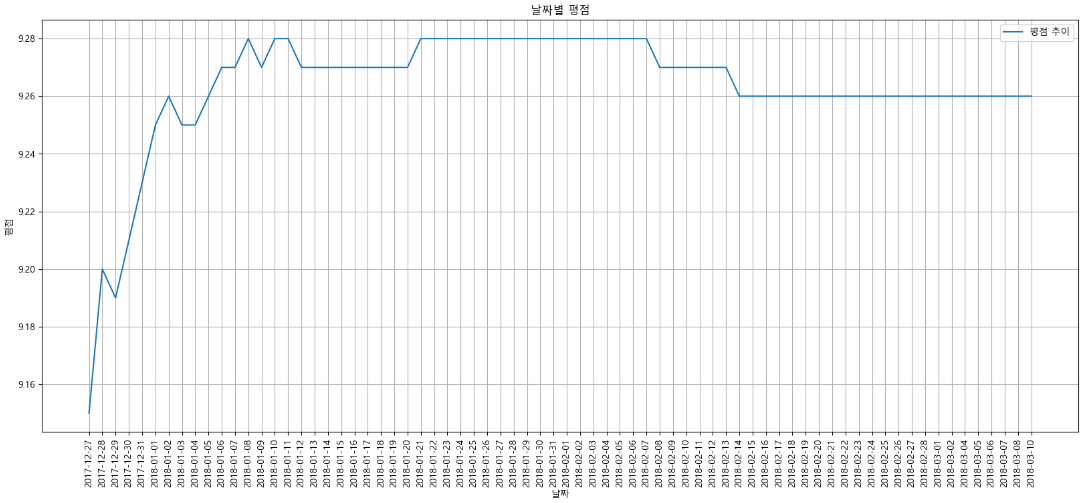
# 상위 10개 영화
movie_best.head(10)
# 하위 10개 영화
movie_best.tail(10)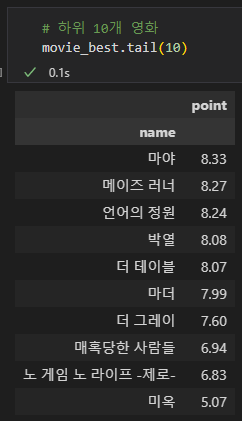
# 100일간 영화를 모두 정리하자
movie_pivot = pd.pivot_table(movie, index=["date"], columns=["name"], values=["point"])
# movie 데이터프레임을 가지고,
# index=["date"] 인덱스는 날짜별로 나올거고,
# 컬럼은 영화이름
# 값들은 평점(없으면 NaN)
movie_pivot.head()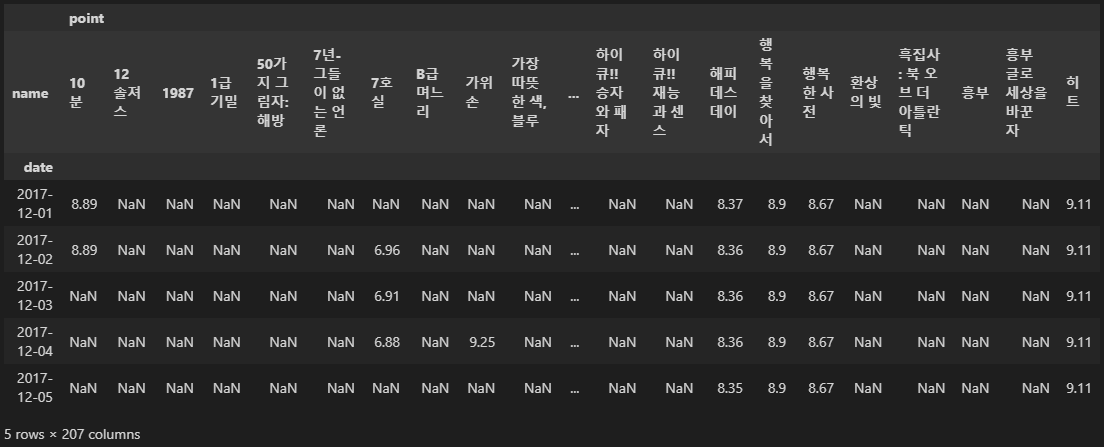
# 엑셀로도 저장
movie_pivot.to_excel("../data/04_movie_pivot.xlsx")
movie_pivot.columns = movie_pivot.columns.droplevel()
movie_pivot.head()

# 혹시나 위에 컬럼이 여러개 있다면, 아래처럼하고 숫자 넣으면 됨
# movie_pivot.columns = movie_pivot.columns.droplevel()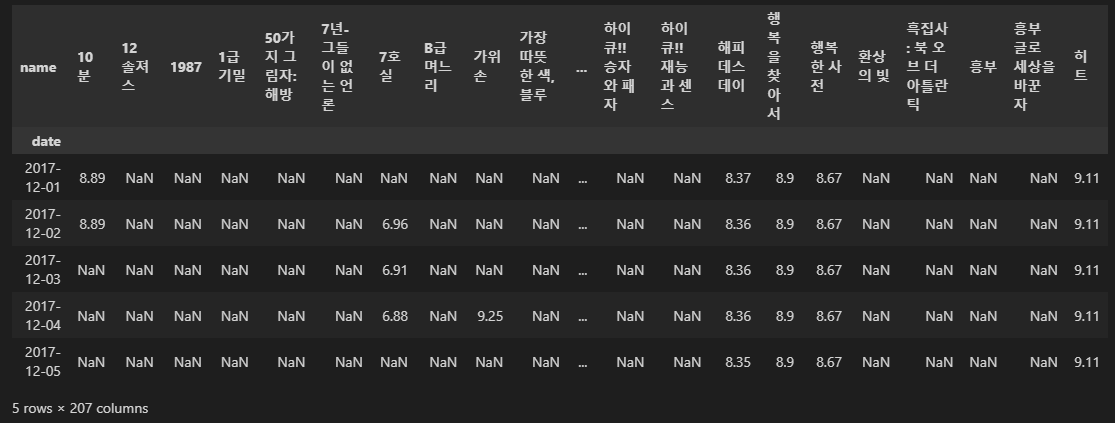
# matplotlib 한글 설정 대응
import platform
from matplotlib import font_manager, rc
import seaborn as sns

import matplotlib.pyplot as plt
import seaborn as sns
import platform
from matplotlib import font_manager, rc

# path = "c:/Windows/Fonts/malgun.ttf"
# if platform.system() == "Darwin":
#     rc("font", family="Arial Unicode MS")
# elif platform.system() == "windows":
#     font_name = font_manager.FontProperties(fname=path).get_name()
#     rc("font", family=font_name)
# else:
#     print("Unknown system... sorry ~~ ")
# 위 실행하면 Unknown system... sorry ~~  뜸...
---------------------------
# 보고싶은 영화 몇개만 추려서 그래프로 확인해보자
target_col = ["신과함께-죄와 벌", "1987", "너의 췌장을 먹고 싶어", "공범자들", "범죄도시"]
plt.figure(figsize=(20, 6))
plt.title("날짜별 영화 평점")
plt.xlabel("날짜")
plt.ylabel("평점")
plt.plot(movie_pivot[target_col])
plt.legend(target_col, loc="best") # target_col 안의 데이터별를 색깔별로 나눠서 표현한다
plt.xticks(rotation="vertical")
plt.grid(True)
plt.tick_params(bottom="off", labelbottom="off") # 표에서 x의 날짜마다 선을 배경으로 그어줌
plt.show()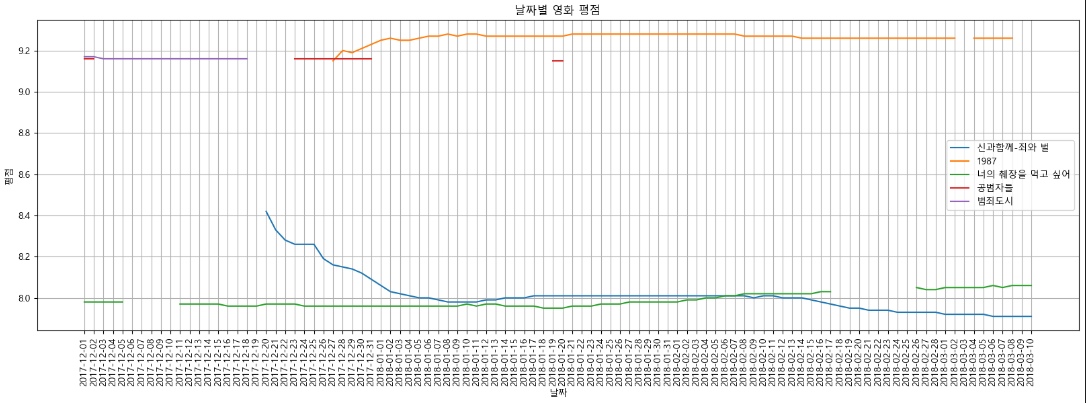
위 글은 제로베이스 데이터 취업 스쿨의 강의자료를 참고하여 작성되었습니다.

허재