[Coursera] C2W1 Convolutional Neural Networks in TensorFlow - Exploring a Larger Dataset
DeepLearning.AI TensorFlow Developer
목록 보기
5/12

GOAL
- ImageDataGenerator class 를 이용하여 image data 전처리를 하는 keras util 이해
- ImageDataGenerator 의 입력으로 전달하기 위해 file 을 옮기는 helper 함수 작성
- plot training 과 model performance 측정을 위한 validation accuracies 방법 배우기
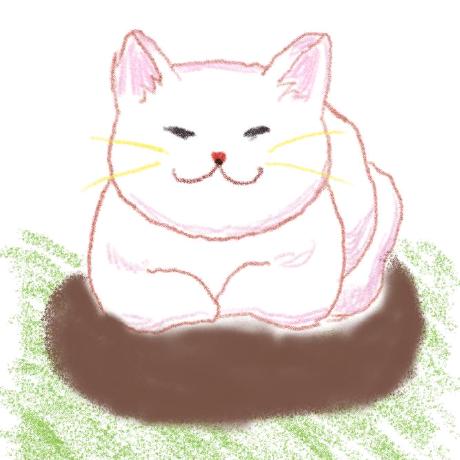
- convolutional neural network 를 이용하여 cat / dog classification 을 위한 분류기 만들기
L3 Training with the cats vs. dogs dataset
ImageDataGenerator 를 이용하여 데이터 preprocessing
ImageDataGenerator 를 이용하여 image 불러오기
- validatoni set 도 동일하게 설정해준다.
train_datagen = ImageDataGenerator(rescale=1./255)
train_generator = train_datagen.flow_from_directory(
	train_dir,
    target_size = ( 150, 150),
    batch_size = 20 ,
    class_mode == 'binary' )
모델 구축하기
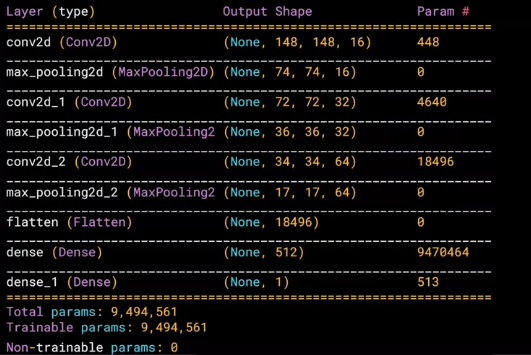
model = tf.keras.models.Sequential([
	tf.keras.layers.Conv2D(16,(3,3),activation = 'relu', input_shape = (150,150,3)),
    tf.keras.layers.MaxPooling2D(2,2),
    tf.keras.layers.Conv2D(32,(3,3),activation='relu'),
    tf.keras.layers.MaxPooling2D(2,2),
    tf.keras.layers.Conv2D(64,(3,3),activation='relu'),
    tf.keras.layers.MaxPooling2D(2,2),
    tf.keras.layers.Flatten(),
    tf.keras.layers.Dense(512,activation='relu'),
    tf.keras.layers.Dense(1,activation='sigmoid')
])
model compile 하기
from tensorflow.keras.optimizers import RMSprop

model.compile(loss='binary_crossentropy',
			  optimizer=RMSprop(lr=0.001),
              metrics=['acc'])
train 하기
history = model.fit_generator(
	train_generator,
    steps_per_epoch=100,
    epochs=15,
    validation_data=validation_generator,
    validation_steps=50,
    verbose=2)
L4 Working through the notebook
- 아래 노트북에 대한 설명
- 노트북을 실행해보면서 prediction 에 실패하는 이미지를 분석해보자.
- (C2_W1_Lab_1_cats_vs_dogs.ipynb)[https://github.com/hobbang2/TensorFlowCertification/blob/main/C2/W1/ungraded_lab/C2_W1_Lab_1_cats_vs_dogs.ipynb]
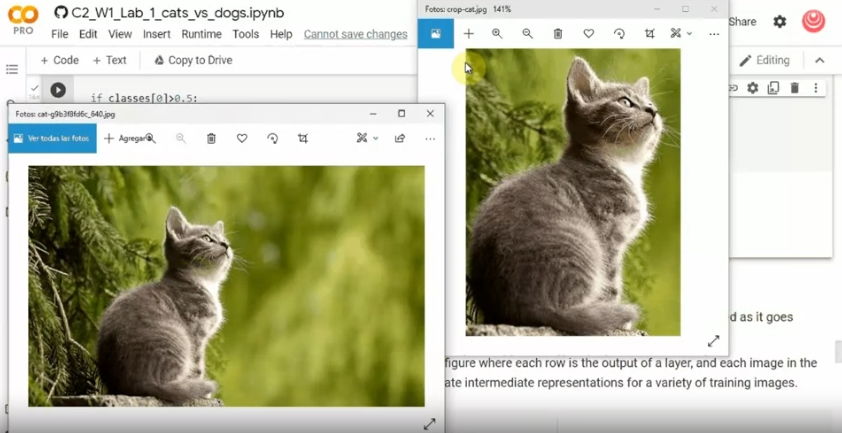
L5 Fixing through cropping
crop 한 이미지를 전달하면 고양이로 인식한다.
- 대상 이외의 요소들이 강아지로 분류되도록 잘못된 정보를 주게 됨
L6 Visualizing the effct of the convolutions
각 layer 에서 input image 가 어떻게 변화하는지 시각화
# import library
import numpy as np
import random
from tensorflow.keras.preprocessing.iamge import img_to_array , load_img

# 이전 모델의 모든 layer 에 대한 표현 받아오기
successive_outputs = [layer.output for layer in model.layers]
visualization_model = tf.keras.models.Model(inputs=model.input , outputs = successive_outputs)

# Prepare a random input image from the training set.
cat_img_files = [os.path.join(train_cats_dir,f) for f in train_cat_fnames]
dog_img_files = [os.path.join(train_dogs_dir,f) for f in train_dog_fnames]
img_path = random.choice( cat_img_files + dog_img_files )
img = load_img(img_path , target_size = (150,150))
x   = img_to_array(img)
x   = x.reshape((1,) + x.shape)

# Scale by 1/255
x /= 255.0

# Run the image through the network , thus obtaining all
# intermediate representations for this image.
successive_feature_maps = visualization_model.predict(x)

# These are the names of the layers, so you can have them as part of our plot
layer_names = [layer.name for layer in model.layers]

# Display the representations
for layer_name , feature_map in zip( layer_names, successive_feature_maps):
	if len(feature_map.shape) == 4 :
    	#-------------------------------------------
  		# Just do this for the conv / maxpool layers, not the fully-connected 			layers
    	#-------------------------------------------
		n_featurs = feature_map.shape[-1 ] # feature map 의 feature 개수
        size      = feature_map.shape[ 1 ] # feature map shape ( 1, size , size , n_features )

        # Tile the images in this matrix
        display_grid = np.zeros((size, size * n_features))

        #-------------------------------------------------
    	# Postprocess the feature to be visually palatable
    	#-------------------------------------------------

        for i in range( n_features ):
        	x = feature_map[0,:,:,i]
        	x -= mean()
        	x /= x.std()
        	x *= 64
        	x += 128
        	x = np.calip(x,0,255).astype('uint8')
        	display_grid[:,i*size : (i+1) * size ] = x # Tile each filter into a horizontal grid

         #-----------------
    	 # Display the grid
    	 #-----------------
    	 scale = 20. / n_features
    	 plt.figure( figsize=(scale * n_features, scale) )
    	 plt.title ( layer_name )
    	 plt.grid  ( False )
plt.imshow( display_grid, aspect='auto', cmap='viridis' ) 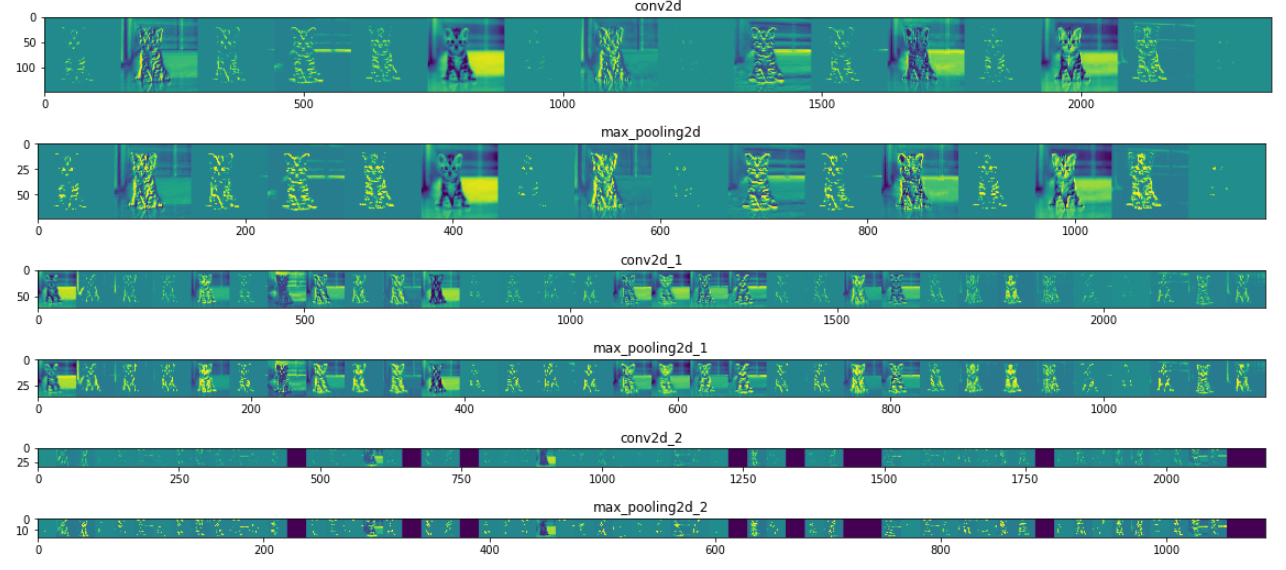
L7 Looking at accuracy and loss
history = model.fit(..) 을 통해 training / validation 의 accuracy 와 loss 그래프를 그릴 수 있다.
- 현재 모델에서는 2 epoch 이후에 validation data set 의 loss 가 높아진 것을 볼 수 있다.
- training set 에 대한 overfitting 을 예상해볼 수 있다.
- overfitting 문제는 적은 데이터를 사용할 때 발생 확률이 높아지지만 , 적은 데이터 셋에서도 오버피팅을 방지할 수 있는 방법이 있다. ( Week2 에서 확인 )
# Retrieve a list of list results on training and test data
# sets for each training epoch

acc      = history.history['accuracy']
val_acc  = history.history['val_accuracy']
loss     = history.history['loss']
val_loss = history.history['val_loss']

epochs = range(len(acc)) # Get number of epochs

# Plot training and validation accuracy per epoch

plt.plot( epochs , acc     )
plt.plot( epochs , val_acc )
plt.title( 'Training and validation accuracy')
plt.figure()

# Plot training and validation loss per epoch

plt.plot( epochs , loss     )
plt.plot( epochs , val_loss )
plt.title( 'Training and validation loss' )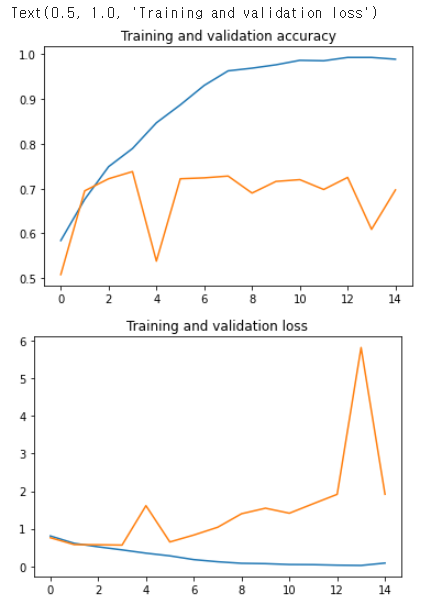
Quiz
-
What’s the name of the API that allows you to inspect the impact of convolutions on the images?
The model.layers API
-
When exploring the graphs, the loss levelled out at about .75 after 2 epochs, but the accuracy climbed close to 1.0 after 15 epochs. What's the significance of this?
There was
no pointtraining after 2 epochs, as we overfit to the training datano point in: ex.There is no point in ~ = It's no use doing something
C2W1_Assignment.ipynb Week 1: Using CNN's with the Cats vs Dogs Dataset
split_data function 완성하기
parameters
SOURCE_DIR: file 들이 담긴 directoryTRAINING_DIR: training 에 쓰일 이미지들이 카피될 폴더VALIDATION_DIR: validation 에 쓰일 이미지들이 카피될 폴더SPLIT_SIZE: training 에 사용될 이미지 사이즈를 결정
conditions
- file 들은 random 으로 sampling 되어야 한다.
예를 들어SPLIT_SIZE가 9 라면SOURCE_DIR의 90% 는TRAINING_DIR로 , 10% 는VALIDATION_DIR로 카피 되어야 한다.- 모든 이미지는 copy 되기 전에 zero file length 인지 체크 하고 , zero length 라면 다음 문구와 함께 copy 하지 않아야 한다.
filename is zero length, so ignoring.
hints
os.listdir(DIRECTORY)returns a list with the contents of that directory.os.path.getsize(PATH)returns the size of the filecopyfile(source, destination)copies a file from source to destinationrandom.sample(list, len(list))shuffles a list
준비된 데이터를 ImageDataGenerator 로 preprocessing 하기
(참고)별도 parameter 추가로 data augumentation 을 할 수 있지만 , 여기서는 하지 않고 넘어갑니다.
- target size 는
(150,150)
model 구성하기
keras's Sequential model을 반환하는creat_model함수 만들기