[Coursera] C2W2 Convolutional Neural Networks in TensorFlow - Augmentation: A technique to avoid overfitting
DeepLearning.AI TensorFlow Developer
목록 보기
6/12

GOAL
- training 과정에 image augmentation 을 추가했을 때 효과 확인
- training 과 validation accuracies 를 그래프화하여 overfitting / lack 에 대해 확인하기
- image augmentation 을 위한 ImageDataGenerator parameter 알아보기
- image augmentation 으로 overfitting 완화시키는 방법 배우기
Augmentation
L2 Introducting augmentation
데이터의 수가 적을수록 training data 가 상대적으로 적게 제공되어
overfitting에 빠질 확률이 높아진다.
- cat image 를 분류할 때 , data set 에 똑바른 고양이 이미지만 있다면 뒤집힌 고양이 이미지가 test image 로 제공되었을 때 분류하지 못할 확률이 높다. data augmentation을 사용하면 다양한 변환(
rotation,shearing,local warping,flib : vertical,random crop, .. ) 을 거친 이미지를 제공할 수 있어 이런 류의 오분류 문제를 방지할 수 있다. - ImageDataGenerator 를 이용하면 메모리 상에서 가공되기 때문에 원본 데이터 훼손 등의 문제를 걱정하지 않아도 된다.
- keras preprocessing layer 자세히 보기
L3 Coding augmentation with ImageDataGenerator
train_datagen = ImageDataGenerator(rescale = 1./255 )

# Updated to do image augmentation
train_datagen = ImageDataGenerator(
	rescale = 1./255,
    rotation_range = 40 ,
    width_shift_range = 0.2,
    height_shift_range = 0.2,
    shear_range = 0.2 ,
    zoom_range = 0.2 ,
    horizontal_flip = True ,
fill_mode = 'nearest')roation_range: 0 ~ 180 사이의 회전 각width_shift_range,height_shift_range: % 만큼 이미지 내부로 이동shear_range: 축을 따라 기울이는 정도
zoom_range: % 만큼 이미지를 확대
horizontal flip: 좌우 반전
fill_mode: 손실된 pixel 을 채우는 것 ,ex.nearest 모드- 이웃 픽셀을 이용하여 균일성 유지
L4 Demonstrating overfitting in cats vs. dogs
rotate, flip, shear, or zoom 등을 이미지에 적용시켜 data augmentation 을 해보자. Data augmentation 은 data 의 다양성을 넓혀 overfitting 을 방지하는 효과를 가져온다.
- C2W1 의 assignment 에서 accuracy 와 loss 를 그래프로 그려보면 overfitting 되었음을 알 수 있다.
import matplotlib.pyplot as plt

def plot_loss_acc(history):
	'''Plots the training and validation loass and accuracy from a history      	object'''
	acc = history.history['accuracy']
	val_acc = history.history['val_accuracy']
	loss = history.history['loss']
	val_loss = history.history['val_loss']

	epochs = range(len(acc))

	plt.plot( epochs , acc , 'bo' , label = 'Training accuracy')
	plt.plot( epochs , val_acc , 'b' , label = 'Validation accuracy')
	plt.title( 'Training and validation accuracy')

	plt.figure()

	plt.plot( epochs , loss , 'bo', label = 'Training Loss')
	plt.plot( epochs , val_loss , 'b', label = 'Validation Loss')
	plt.title( 'Training and validation loss' )
	plt.legend()

	plt.show()
L5 Adding augmentation to cats vs. dogs
Data augmentation
# Updated to do image augmentation
train_datagen = ImageDataGenerator(
      rotation_range=40,
      width_shift_range=0.2,
      height_shift_range=0.2,
      shear_range=0.2,
      zoom_range=0.2,
      horizontal_flip=True,
      fill_mode='nearest')
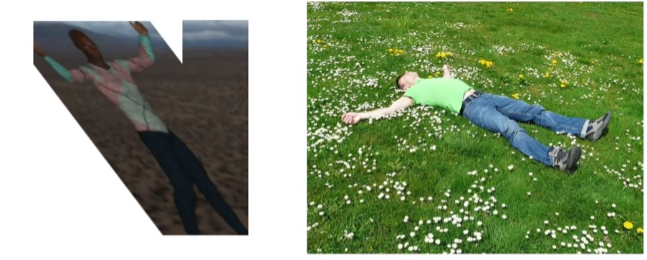
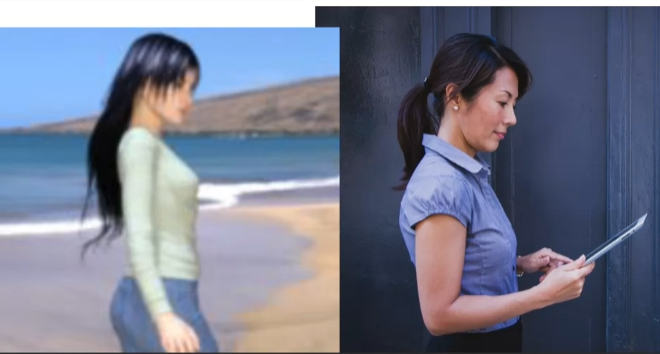
L6 Exploring augmentation with horses vs. humans
ImageDataGenerator 가 제공하는 data augmentation 기법들이 어떤 dataset 에는 적용되지 않을 수도 있다.
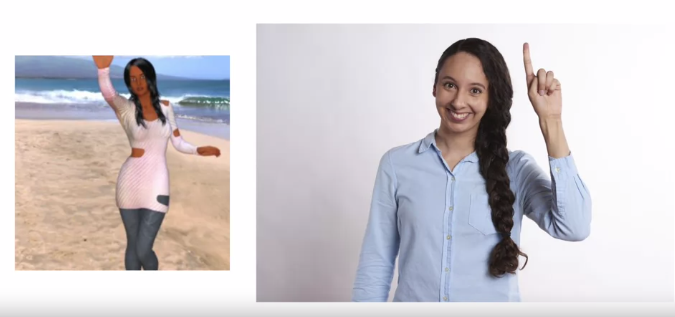
예를 들어,training set 의 배경까지 학습되어 흰색 배경을 가진 validation set 에서는 적절한 성능을 내지 못하는 경우
C2W2Lab2 Ungraded Lab: Data Augmentation on the Horses or Humans Dataset
validation set 에서 accuracy 가 diversing 하는 것을 볼 수 있다.

Quiz
- When training with augmentation, you noticed that the training is a little slower. Why?
Because the image processing takes cycles