📌 DataFrame 데이터 파악
shape속성 (row, column)describe(): 숫자형 데이터의 통계치 계산info(): 데이터 타입, 각 아이템의 개수 등 출력
예시 데이터
- Kaggle Titanic Data
1️⃣ df.shape
- 데이터프레임의 행,렬 개수 출력
df_tit.shape()- 출력
(891, 12)2️⃣ df.info()
- 데이터프레임 개요
- 컬럼별 요약 : 데이터 개수(결측치제외한 데이터), 데이터유형(dtype)
df_tit.info()- 출력
<class 'pandas.DataFrame'>
RangeIndex: 891 entries, 0 to 890
Data columns (total 12 columns):
 #   Column       Non-Null Count  Dtype
---  ------       --------------  -----
 0   PassengerId  891 non-null    int64
 1   Survived     891 non-null    int64
 2   Pclass       891 non-null    int64
 3   Name         891 non-null    str
 4   Sex          891 non-null    str
 5   Age          714 non-null    float64
 6   SibSp        891 non-null    int64
 7   Parch        891 non-null    int64
 8   Ticket       891 non-null    str
 9   Fare         891 non-null    float64
 10  Cabin        204 non-null    str
 11  Embarked     889 non-null    str
dtypes: float64(2), int64(5), str(5)
memory usage: 83.7 KB
3️⃣ df.describe()
- 수치형 데이터의 기술통계 출력
include=,exclude=옵션을 통해 포함할dtype의 컬럼을 설정할 수 있다.
- 수치형 데이터 : 평균, 분산, 최소값, 최대값, 중위수, 사분위수
- 범주형 데이터 : 빈도, 비율
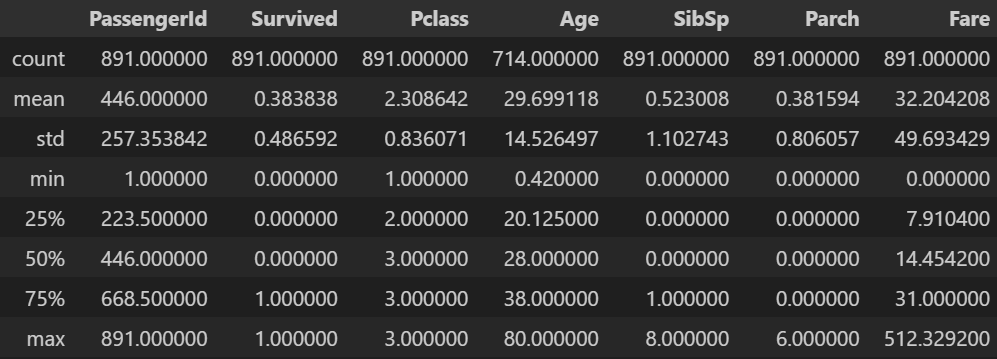
df_tit.describe()- 출력
전체 데이터의 전체 기술 통계
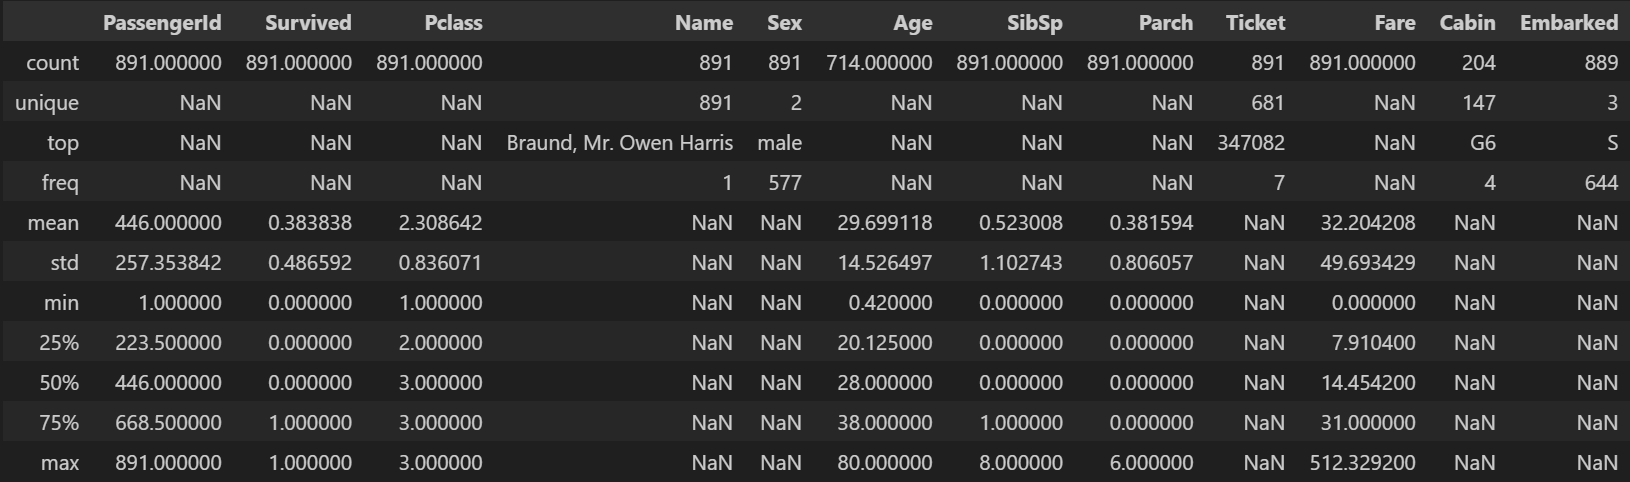
- 기본적으로
describe()는 수치형 데이터의 기술통계를 출력하지만,include='all'을 하면 수치형이 아닌 데이터도 포함시킨다.
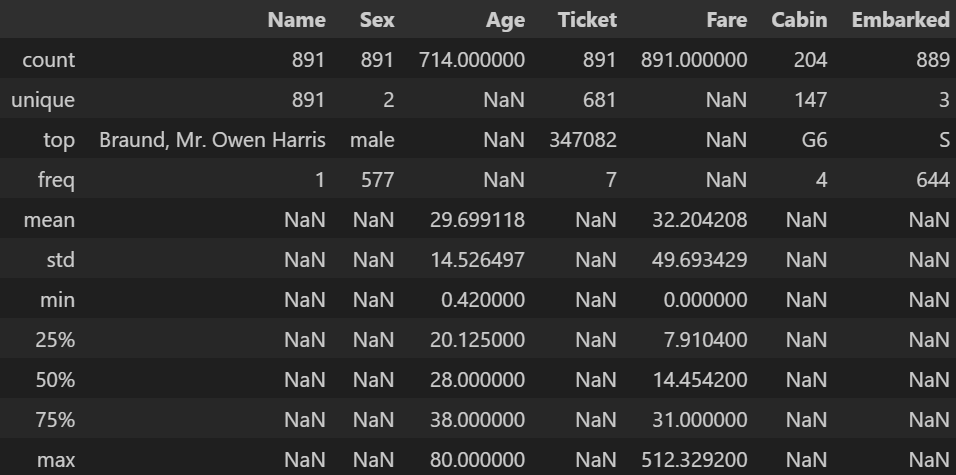
df_tit.describe(include='all')- 출력
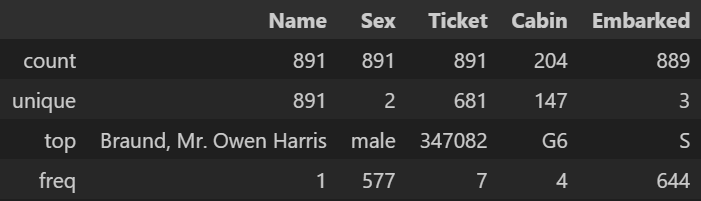
문자열 데이터의 기술 통계
df_tit.describe(include='str')- 출력
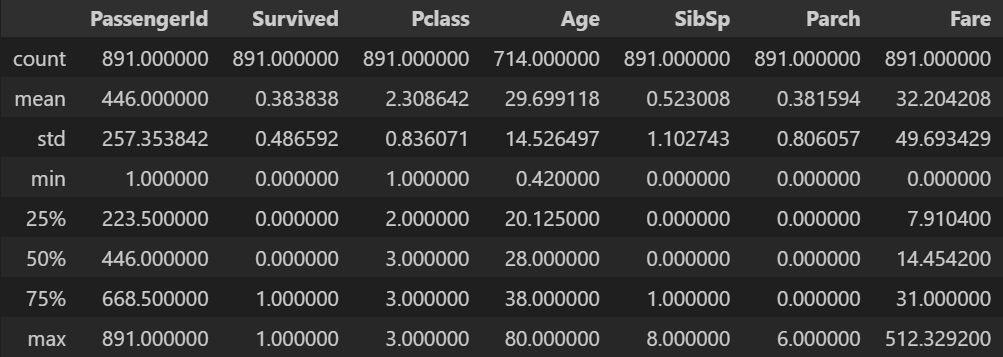
문자열 데이터 제외 기술 통계
df_tit.describe(exclude='str')- 출력
- 리스트를 통해 여러 데이터 타입의 컬럼을 설정할 수 있다.
df_tit.describe(include=['float64', 'str'])- 출력
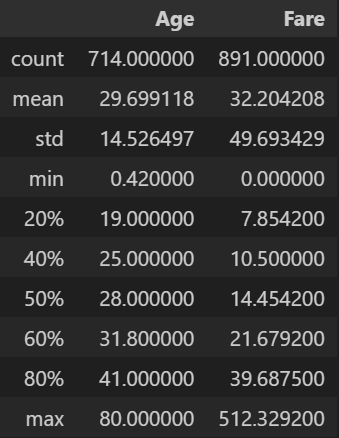
상위 n% 데이터 기술통계
percentiles=를 통해 상위 퍼센트 기술통계를 확인할 수 있다.
df_tit.describe(percentiles=[0.2, 0.4, 0.5, 0.6, 0.8], include=['float64'])- 출력
📌 DataFrame 변경
1️⃣ DataFrame 전치
- 전치 (transpose) : 행과 열 바꿔치기
예시 데이터
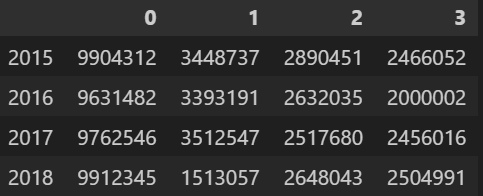
data = {
'2015': [9904312, 3448737, 2890451, 2466052],
'2016': [9631482, 3393191, 2632035, 2000002],
'2017': [9762546, 3512547, 2517680, 2456016],
'2018': [9912345, 1513057, 2648043, 2504991]
}
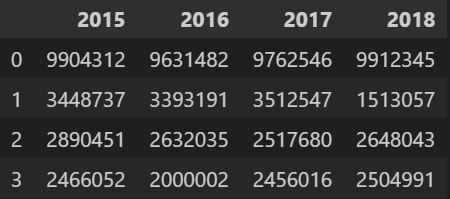
df = pd.DataFrame(data=data)
df- 출력
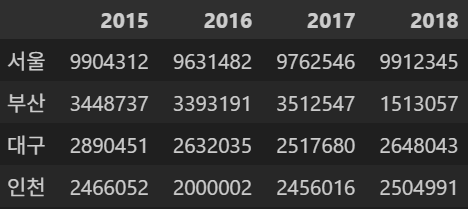
df.transpose()/df.T- 행과 열의 위치가 바뀐 것을 확인할 수 있다.
# 1
df2 = df.transpose()
# 2
df2 = df.T
df2
- 출력
2️⃣ 열(column) 추가
- 해당열이 있으면 내용 갱신, 열이 없으면 추가
- 열 추가 :
df[열이름(key)] = values - 열 내용 갱신 :
df[열이름(key)] = values
예시 데이터
df.index = ['서울', '부산', '대구', '인천']
df
- 출력
- 데이터프레임을 컬럼 기준으로 인덱싱하면
Series형태의 데이터가 출력된다.
df['2016']- 출력
0 9631482
1 3393191
2 2632035
3 2000002
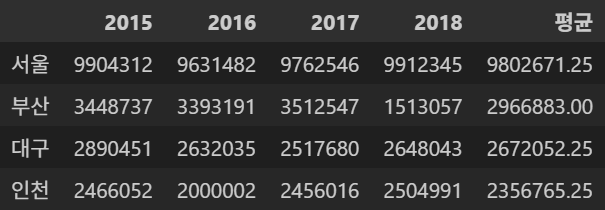
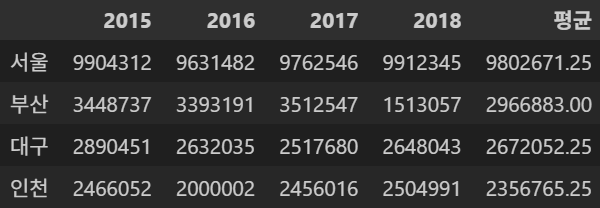
Name: 2016, dtype: int64새로운 평균 컬럼 추가
- 오른편에 새로운
평균컬럼이 생성된 것을 확인할 수 있다.
df['평균'] = (df['2015'] + df['2016'] + df['2017'] + df['2018']) / 4
df
- 출력
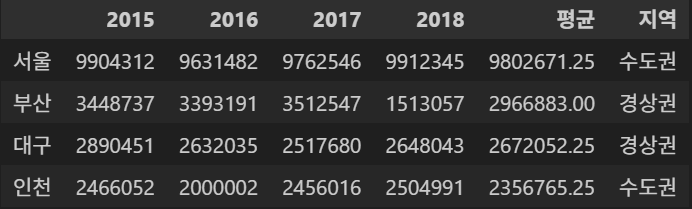
새로운 지역 컬럼 추가
df['지역'] = ['수도권', '경상권', '경상권', '수도권']
df
- 출력
3️⃣ 열(column) 삭제
del df[삭제열]지역컬럼이 삭제된 것을 확인할 수 있다.
del df['지역']
df
- 출력