이상치 Outlier
관측된 데이터 범위에서 크게 멋어난 아주 작은 값 혹은 아주 큰 값
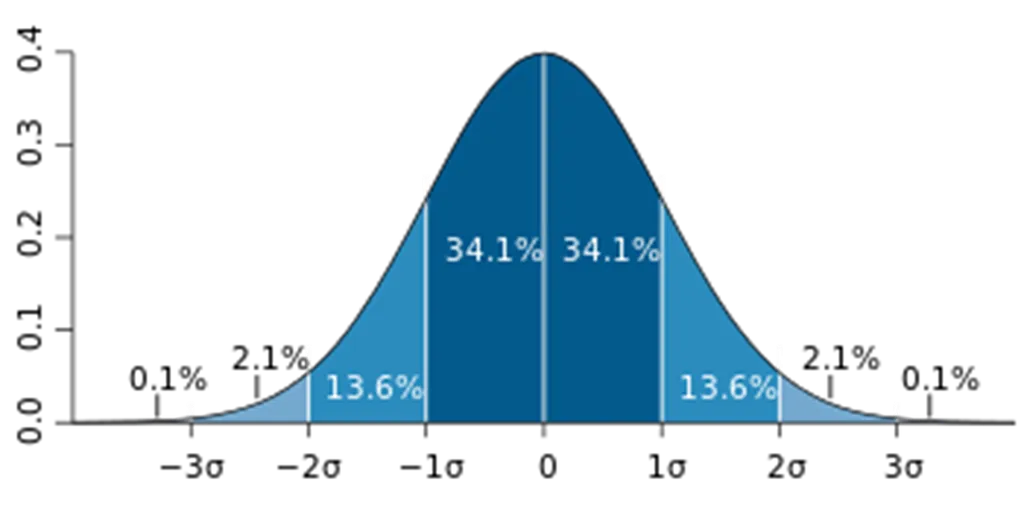
Extreme Studentized Deviation (ESD)
- 데이터가 정규분포를 따른다고 가정할 때, 평균에서 표준편차의 3배 이상 떨어져 있는 값을 이상치로 봄.
- 모든 데이터가 정규 분포를 따르는 것은 아니기 때문에 아래 두 경우에는 적용 어려움
- 데이터가 크게 비대칭인 경우 (log 변환 등을 시도)
- 샘플의 크기가 작은 경우
실습
정상 범위 확인
import numpy as np
import seaborn as sns

tips_df = sns.load_dataset('tips')

mean = np.mean(tips_df['total_bill'])
std = np.std(tips_df['total_bill'])
upper_limit = mean + 3*std
lower_limit = mean - 3*std

print(upper_limit, lower_limit)
# 46.43839435626422 -6.866509110362578
이상치에 해당하는 데이터 확인
# 정상 범위의 하한은 음수이므로 논외
cond = (tips_df['total_bill'] > 46.4)
tips_df[cond]
Inter Quantile Range (IQR)
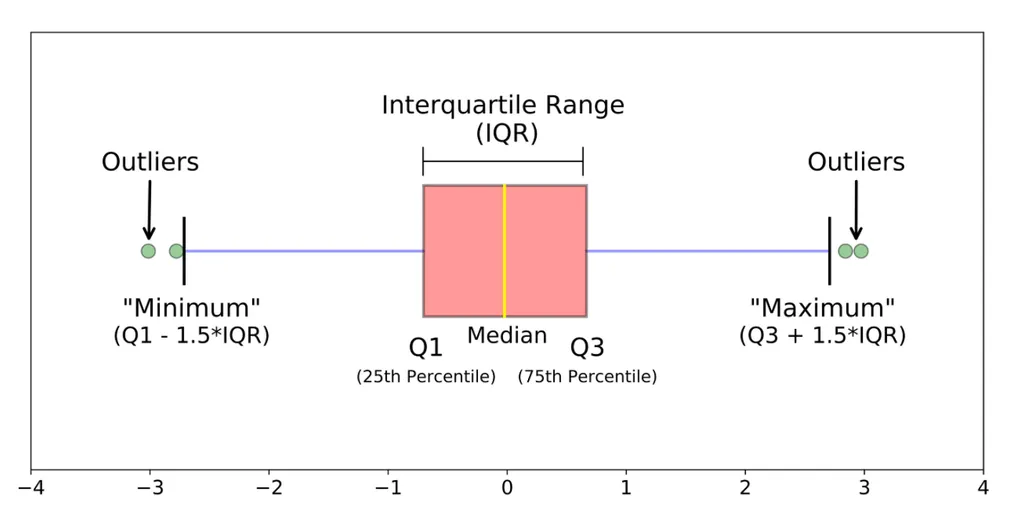
- 사분위 수를 이용하여 이상치 처리
- 마찬가지로 데이터가 비대칭적이거나 샘플 사이즈가 작은 경우 제한됨
- Box plot: 데이터의 사분위 수를 포함한 분포를 보여주는 그래프. 상자-수염 그림이라고도 함
실습
boxplot 확인
import seaborn as sns
sns.boxplot(tips_df['total_bill'])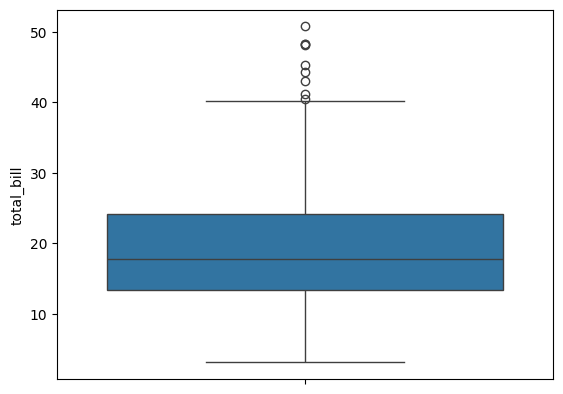
IQR 구하기
q1 = tips_df['total_bill'].quantile(0.25)
q3 = tips_df['total_bill'].quantile(0.75)
iqr = q3 - q1
upper_limit2 = q3 + 1.5*iqr
lower_limit2 = q1 - 1.5*iqr
print(q1,q3,iqr, upper_limit2, lower_limit2)

# 결과:
13.3475 24.127499999999998 10.779999999999998 40.29749999999999 -2.8224999999999945
이상치에 해당하는 데이터 확인
cond2 = (tips_df['total_bill'] > upper_limit2)
tips_df[cond2]
이상치는 사실 주관적인 값. 그 데이터를 삭제할지 말지는 분석가가 결정할 몫.
다만, 이상치는 도메인과 비즈니스 맥락에 따라 그 기준이 달라지며, 데이터 삭제 시 품질은 좋아질 수 있지만 정보 손실을 동반하기 때문에 이상치 처리에 주의해야 함.
단지, 통계적 기준에 따라서 결정 할 수도 있다는 점 유의.
또한, 이상 탐지(Anomaly Detection)이라는 이름으로 데이터에서 패턴을 다르게 보이는 개체 또는 자료를 찾는 방법으로도 발전 할 수 있음. (사기탐지, 사이버 보안)
결측치 Missing Value
데이터가 존재하지 않는 것
처리 방법
수치형 데이터
- 평균값 대치
- 중앙값 대치 (데이터에 이상치가 많아 평균이 대표성이 없는 경우)
범주형 데이터
- 최빈값 대치
사용 함수
간단한 삭제 & 대치
- df.dropna(axis = 0) : 행 삭제
- df.dropna(axis = 1) : 열 삭제
- df.fillna(value): value 값으로 결측치 채우기 (평균, 중앙값, 최빈값 등)
- Boolean Indexing
알고리즘 이용
- sklearn.impute.SimpleImputer : 평균, 중앙값, 최빈값으로 대치
- SimpleImputer.statistics: 대치한 값 확인
- sklearn.impute.IterativeImputer: 다변량 대치(회귀 대치)
- sklearn.impute.KNNImputer: knn 알고리즘을 이용한 대치
실습
데이터 확인하기
titaninc_df.head(3)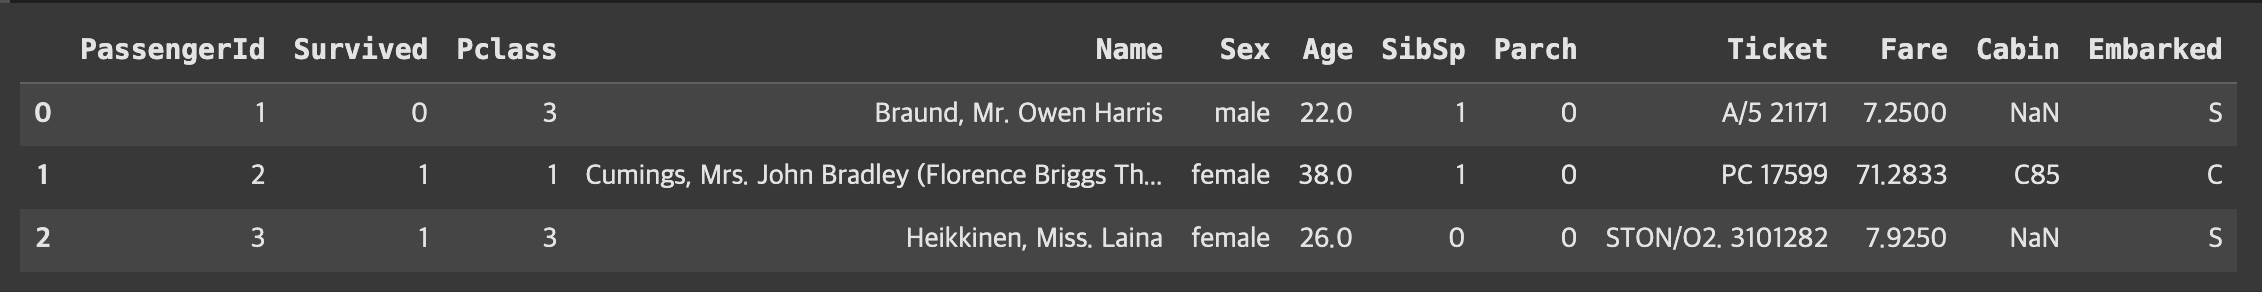
원본
titaninc_df.info()

<class 'pandas.core.frame.DataFrame'>
RangeIndex: 891 entries, 0 to 890
Data columns (total 12 columns):
 #   Column       Non-Null Count  Dtype
---  ------       --------------  -----
 0   PassengerId  891 non-null    int64
 1   Survived     891 non-null    int64
 2   Pclass       891 non-null    int64
 3   Name         891 non-null    object
 4   Sex          891 non-null    object
 5   Age          714 non-null    float64
 6   SibSp        891 non-null    int64
 7   Parch        891 non-null    int64
 8   Ticket       891 non-null    object
 9   Fare         891 non-null    float64
 10  Cabin        204 non-null    object
 11  Embarked     889 non-null    object
dtypes: float64(2), int64(5), object(5)
memory usage: 83.7+ KB
결측치가 있는 행 drop
titaninc_df.dropna(axis = 0).info()

<class 'pandas.core.frame.DataFrame'>
Index: 183 entries, 1 to 889
Data columns (total 12 columns):
 #   Column       Non-Null Count  Dtype
---  ------       --------------  -----
 0   PassengerId  183 non-null    int64
 1   Survived     183 non-null    int64
 2   Pclass       183 non-null    int64
 3   Name         183 non-null    object
 4   Sex          183 non-null    object
 5   Age          183 non-null    float64
 6   SibSp        183 non-null    int64
 7   Parch        183 non-null    int64
 8   Ticket       183 non-null    object
 9   Fare         183 non-null    float64
 10  Cabin        183 non-null    object
 11  Embarked     183 non-null    object
dtypes: float64(2), int64(5), object(5)
memory usage: 18.6+ KB
'Age' 열에 결측치가 없는 데이터
cond3 = (titaninc_df['Age'].notna())
titaninc_df[cond3].info()

<class 'pandas.core.frame.DataFrame'>
Index: 714 entries, 0 to 890
Data columns (total 12 columns):
 #   Column       Non-Null Count  Dtype
---  ------       --------------  -----
 0   PassengerId  714 non-null    int64
 1   Survived     714 non-null    int64
 2   Pclass       714 non-null    int64
 3   Name         714 non-null    object
 4   Sex          714 non-null    object
 5   Age          714 non-null    float64
 6   SibSp        714 non-null    int64
 7   Parch        714 non-null    int64
 8   Ticket       714 non-null    object
 9   Fare         714 non-null    float64
 10  Cabin        185 non-null    object
 11  Embarked     712 non-null    object
dtypes: float64(2), int64(5), object(5)
memory usage: 72.5+ KB
fillna를 이용하여 평균 값으로 결측치 채우기
age_mean = titaninc_df['Age'].mean().round(2)
# 새로운 컬럼 만들기
titaninc_df['Age_mean'] = titaninc_df['Age'].fillna(age_mean)

titaninc_df.info()

<class 'pandas.core.frame.DataFrame'>
RangeIndex: 891 entries, 0 to 890
Data columns (total 13 columns):
 #   Column       Non-Null Count  Dtype
---  ------       --------------  -----
 0   PassengerId  891 non-null    int64
 1   Survived     891 non-null    int64
 2   Pclass       891 non-null    int64
 3   Name         891 non-null    object
 4   Sex          891 non-null    object
 5   Age          714 non-null    float64
 6   SibSp        891 non-null    int64
 7   Parch        891 non-null    int64
 8   Ticket       891 non-null    object
 9   Fare         891 non-null    float64
 10  Cabin        204 non-null    object
 11  Embarked     889 non-null    object
 12  Age_mean     891 non-null    float64
dtypes: float64(3), int64(5), object(5)
memory usage: 90.6+ KB
SimpleImputer를 이용하여 결측치 대치하기
sklearn.impute.SimpleImputer 공식 문서
Univariate imputer for completing missing values with simple strategies.
Replace missing values using a descriptive statistic (e.g. mean, median, or most frequent) along each column, or using a constant value.
from sklearn.impute import SimpleImputer
si = SimpleImputer()

# 결측치를 채우고자 하는 컬럼 데이터 학습시키기
si.fit(titaninc_df[['Age']])

# 계산된 값 확인
si.statistics_
# array([29.69911765])

# 대치하기 (새로운 컬럼에 입력)
titaninc_df['Age_si_mean'] = si.transform(titaninc_df[['Age']])

titaninc_df.info()

<class 'pandas.core.frame.DataFrame'>
RangeIndex: 891 entries, 0 to 890
Data columns (total 14 columns):
 #   Column       Non-Null Count  Dtype
---  ------       --------------  -----
 0   PassengerId  891 non-null    int64
 1   Survived     891 non-null    int64
 2   Pclass       891 non-null    int64
 3   Name         891 non-null    object
 4   Sex          891 non-null    object
 5   Age          714 non-null    float64
 6   SibSp        891 non-null    int64
 7   Parch        891 non-null    int64
 8   Ticket       891 non-null    object
 9   Fare         891 non-null    float64
 10  Cabin        204 non-null    object
 11  Embarked     889 non-null    object
 12  Age_mean     891 non-null    float64
 13  Age_si_mean  891 non-null    float64
dtypes: float64(4), int64(5), object(5)
memory usage: 97.6+ KB
To Dare is To Do