데이터 시각화(문제풀기)

1.문제 풀기
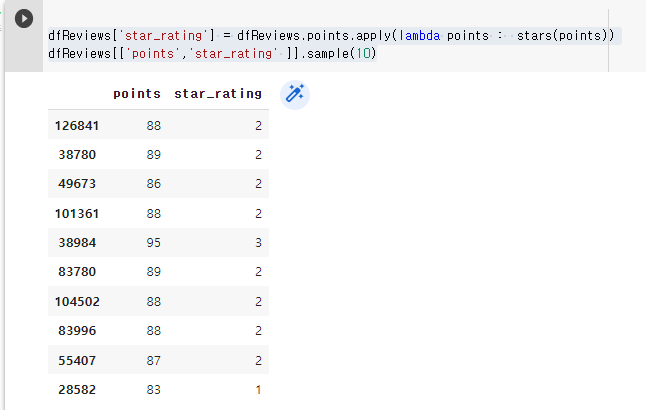
point 점수 95점 이상은 별 3개
85점 이상 95점 미만은 별2개 나머지는
별1개가 되도록 별점을 매기고
str_rating칼럼에 해당 값 할당
def stars(points):
    if points >= 95:
        return 3
    elif points >= 85:
        return 2
    else:
        return 1
데이터 프레임 적용
dfReviews['star_rating'] = dfReviews.points.apply(lambda points :  stars(points))
dfReviews[['points','star_rating' ]].sample(10)
그래프 생성
import matplotlib as plt
dfReviews['star_rating'] = dfReviews.points.apply(lambda points :  stars(points))
dfReviews[['points','star_rating' ]].sample(10).plot.bar()
--정의 요약
데이터 프레임 생성 df
star_rating 변수 설정
points : 0~100 사이로 매겨진 와인의 점수
람다 - 익명함수를 지칭
나라별 몇개의 리뷰가 존재하는지 계산해서 출력하기
aggregation 집계 함수의 value_counts()사용

