1. Import 먼저 하기
import numpy as np
import pandas as pd
import warnings
warnings.filterwarnings('ignore')
import matplotlib.pyplot as plt
import seaborn as sns
2.lineplot
plt
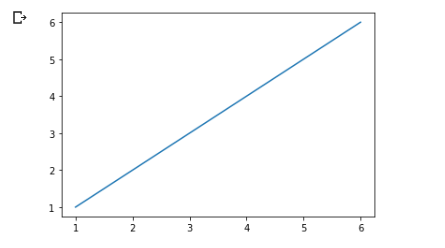
x = np.array([1, 2, 3, 4, 5, 6]) #x값 #리스트와 유사 (다차원 축 연결 가능)
y = np.array([1, 2, 3, 4, 5, 6]) #y값

plt.plot(x,y)   #plt 그리기 x축 y축 라인 연결
plt.show() #그래프만 보이게 하기
plt
x = np.array([1, 2, 3, 4, 5, 6]) #x값
y = np.array([1, 2, 3, 4, 5, 6]) #y값
title , x label , y label ,범례 필요!
plt.plot(x,y)   #plt 그리기 x축 y축 라인 연결
plt.plot(x,y*2) #y를 2배로 키우기
plt.show() #그래프만 보이게 하기
plt
x = np.array([1, 2, 3, 4, 5, 6]) #x값
y = np.array([1, 2, 3, 4, 5, 6]) #y값
title , x label , y label ,범례 필요!
plt.plot(x,y,'--') #plt 그리기 x축 y축 라인 연결 '--'로 그래프 모양 변경 가능
plt.plot(x,y*2) #y를 2배로 키우기
plt.show() #그래프만 보이게 하기


