1.histogram
연속형 변수의 값 또는 분포 형태를 보여줌
데이터 집합의 중심, 산포 및 형태를 볼 수 있음.
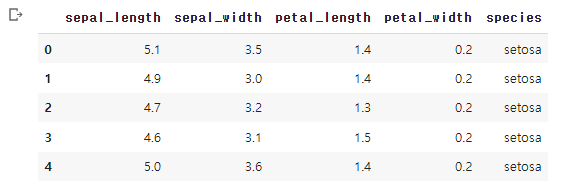
iris data load
--seaborn
iris = sns.load_dataset('iris')
iris.head( ) #아이리스 데이터 셋
      #이 함수에서 iris 데이터 출력후 iris에 삽입(데이터 프레임)
plt 이용
plt.hist(iris['sepal_width'])   #default bins =10
plt.show() #10개로 나눠서 그 구간에 있는 것 분석
#정규 분포 평균 3 #변동성 크지 않고 중앙 유지
seaborn distplot
sns.distplot(iris['sepal_width'], bins=20)
#대표하는 선을 그려줌
plt.show()#bins 20 개 지정
#그래프만 보이게
#y축(density)의 밀도가 1이 아님
seaborn distplot
sns.histplot(iris['sepal_width'], bins=20)  #histplot
plt.show() #bins 20 개 지정
#그래프만 보이게
#y축 확실한 데이터 보기


