kaggle 데이터셋 분석
출처 : https://www.kaggle.com/datasets/shivamb/netflix-shows
- 데이터 확인을 위한 작업
import pandas as pd
import numpy as np
import matplotlib.pyplot as plt
import seaborn as sns
import warnings
warnings.filterwarnings('ignore')

import missingno as msno
import koreanize_matplotlib
# csv file reading
data = pd.read_csv("https://raw.githubusercontent.com/prasertcbs/basic-dataset/master/netflix_titles.csv",sep=",")
data.head()데이터셋 확인
컬럼 설명
- show_id : id
- type : 분류 (TV쇼 or 영화)
- title : 제목
- director : 제작자
- cast : 출연진
- country : 출연국가
- data_added : 개봉날짜
- release_year : 출시연도
- rating : 관람 등급
- duration : 작품 길이
- listed_in : 해당 작품이 속한 분류
- description : 작품개요
data.info()
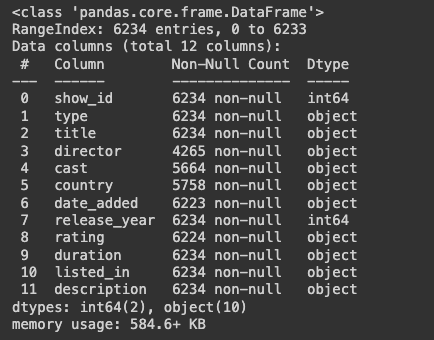
- 결측치 확인
# 결측치 확인
data.isnull().sum()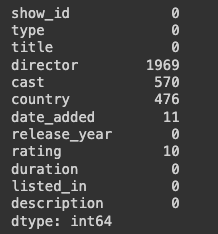
결측치 시각화
msno.bar 를 사용예정
msno.bar(data)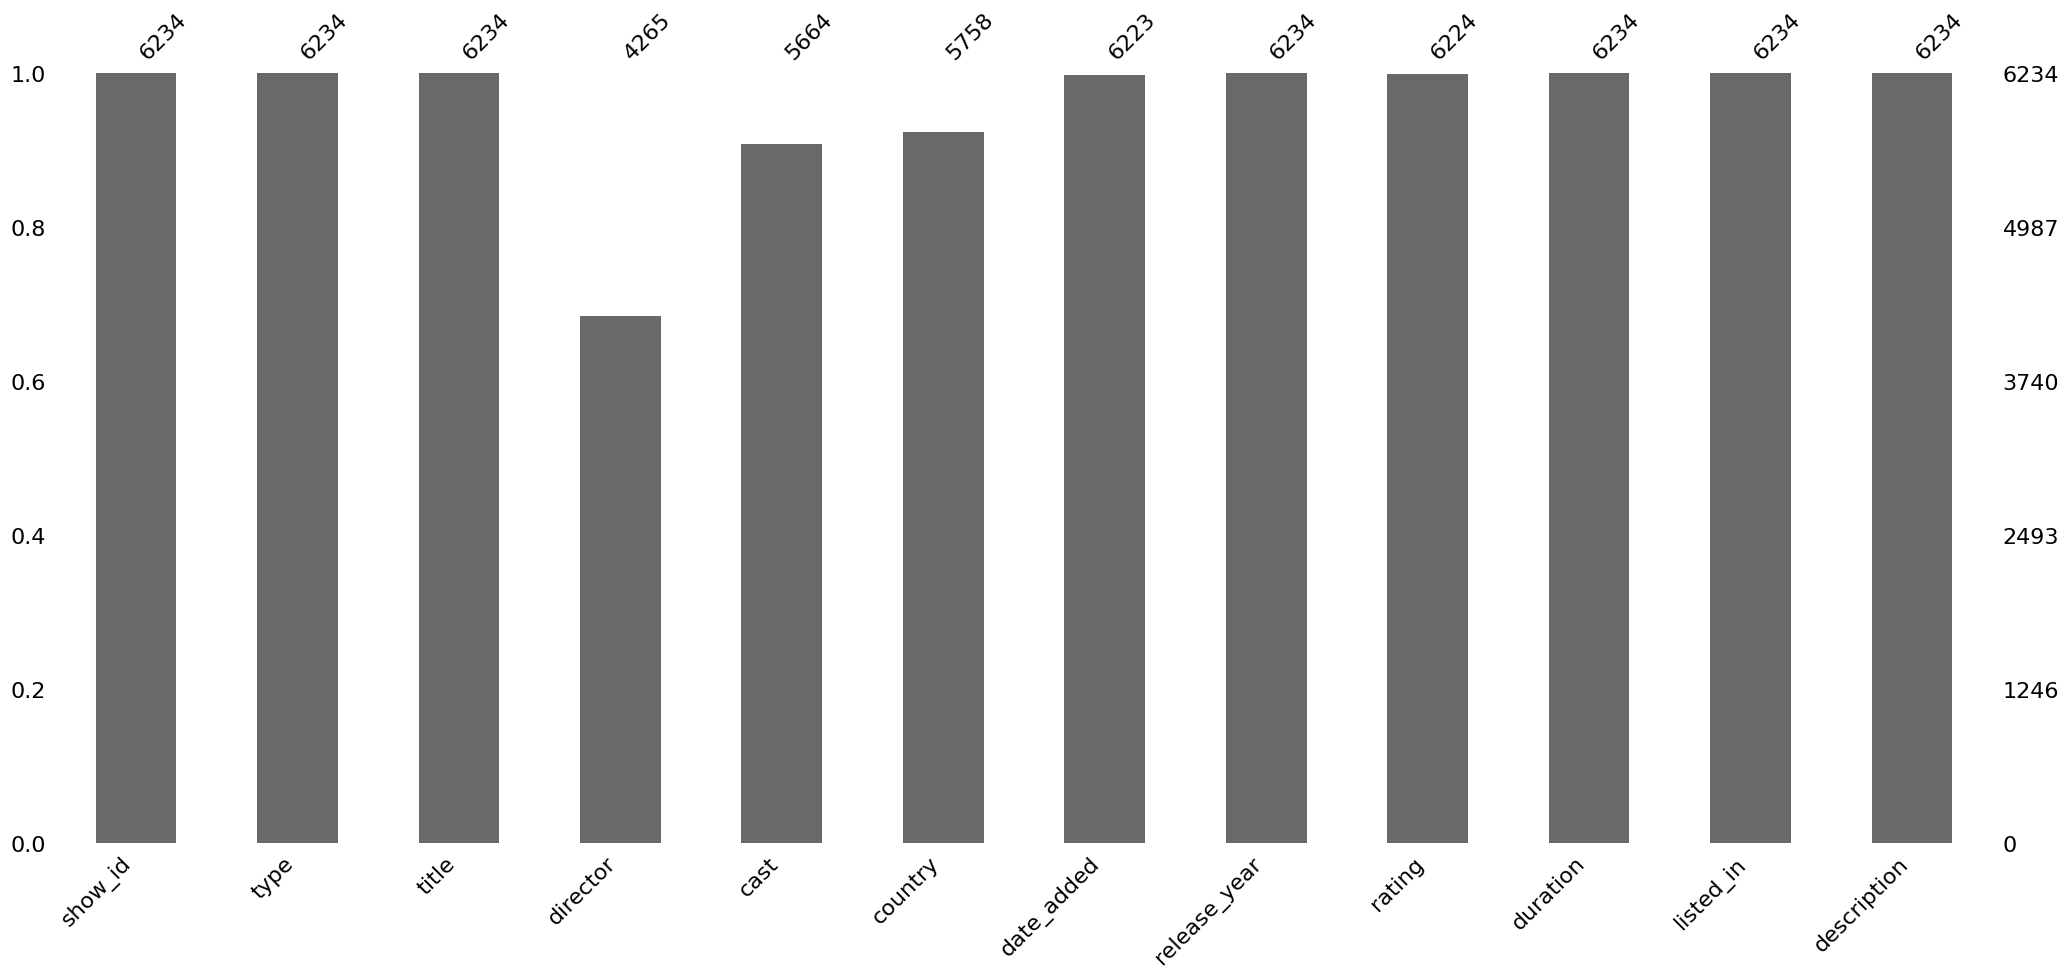
결측치를 시각화 할 수 있다
범주형 데이터 확인
data.describe(include="object") 
수치형 데이터 확인
data.describe(include="int")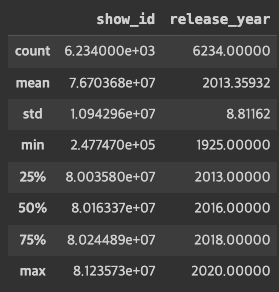
describe그냥 써도 되는데 기호에따라 include 옵션을 쓰는게 중요하다
탐색 마무리
- 위 출력한 내용들을 한번에
print문으로 마무리
total_elements = data.shape[0] * data.shape[1]
missing_count = data.isnull().sum().sum()
missing_ratio = (missing_count / total_elements) * 100

print(f"전체 데이터 수 : {total_elements}")
print(f"결측치 수 : {missing_count}")
print(f"전체 데이터 내 결측치 비율 : {missing_ratio:.2f}%")
print(f"범주형 데이터 수 : {data.select_dtypes(include='object').shape[1]}")
print(f"수치형 데이터 수 : {data.select_dtypes(include='number').shape[1]}")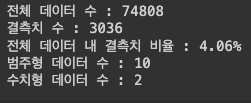
- 무엇을 분석하는게 좋을까?
- 어느 나라 작품이 많을까
- 작품 중 어느 타입이 가장 많을지
- 년/월 별 등록 작품 수 확인
- 관람등급 빈도
- 작품의 러닝타임(상영시간) 평균 시간
- 장르 분포도
- 장르 비율
- 관람등급의 비율

개발 취미로 하는 세일즈맨