K-means 알고리즘
- 군집의 개수(K) 설정하기
- 초기 중심점 설정하기
- 데이터를 군집에 할당(배정)하기
- 중심점 재설정(갱신)하기
- 데이터를 군집에 재할당(배정)하기
중심점의 위치가 더 이상 변하지 않을 때까지 4,5단계 반복K-means 예제코드
%matplotlib inline
from sklearn.datasets import make_blobs
import pandas as pd
import numpy as np
import matplotlib.pyplot as plt
import random

# 중심점이 5개인 100개의 점 데이터를 무작위로 생성합니다.
points, labels = make_blobs(n_samples=100, centers=5, n_features=2, random_state=135)

print(points.shape, points[:10])  # 무작위로  생성된 점의 좌표 10개 출력
print(labels.shape, labels[:10])    # 10개의 점들이 각각 대응하는 중심점(label) 값 출력

# 축 그리기
fig = plt.figure()
ax = fig.add_subplot(1, 1, 1)

# 위에서 생성한 점 데이터들을 pandas DataFrame 형태로 변환하기
points_df = pd.DataFrame(points, columns=['X', 'Y'])
display(points_df.head())

# 점 데이터를 X-Y grid에 시각화하기
ax.scatter(points[:, 0], points[:, 1], c='black', label='random generated data')

# 축 이름을 라벨에 달고, 점 데이터 그리기
ax.set_xlabel('X')
ax.set_ylabel('Y')
ax.legend()
ax.grid()중심점 재설정(갱신)하기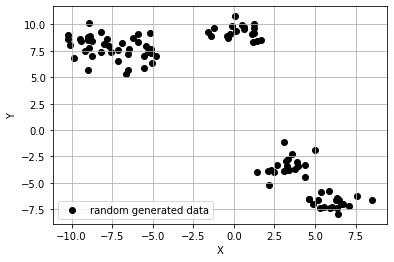
- 유클리드 거리(Eucledian distance) (or L2 Distance)
피타고라스 정리를 응용하여 좌표축 사이의 두 점 사이의 직선거리
from sklearn.cluster import KMeans

# 1), 2) 위에서 생성한 무작위 점 데이터(points)에 클러스터의 수(K)가 5인 K-means 알고리즘을 적용
kmeans_cluster = KMeans(n_clusters=5)

# 3) ~ 6) 과정이 전부 함축되어 있는 코드. points에 대하여 K가 5일 때의 K-means iteration을 수행
kmeans_cluster.fit(points)

print(type(kmeans_cluster.labels_))
print(np.shape(kmeans_cluster.labels_))
print(np.unique(kmeans_cluster.labels_))
<class 'numpy.ndarray'>
shape: (100,)
labels: [0 1 2 3 4]
- DBSCAN 알고리즘
# n 번째 클러스터 데이터를 어떤 색으로 도식할 지 결정하는 color dictionary
color_dict = {0: 'red', 1: 'blue', 2:'green', 3:'brown', 4:'indigo'}

# 점 데이터를 X-Y grid에 시각화합니다.
fig = plt.figure()
ax = fig.add_subplot(1, 1, 1)

# K-means clustering의 결과대로 색깔별로 구분하여 점에 색칠한 후 도식
for cluster in range(5):
    cluster_sub_points = points[kmeans_cluster.labels_ == cluster] # 전체 무작위 점 데이터에서 K-means 알고리즘에 의해 군집화된 sub data를 분리합니다.
    ax.scatter(cluster_sub_points[:, 0], cluster_sub_points[:, 1], c=color_dict[cluster], label='cluster_{}'.format(cluster)) # 해당 sub data를 plot합니다.

# 축 이름을 라벨에 달고, 점 데이터 그리기
ax.set_xlabel('X')
ax.set_ylabel('Y')
ax.legend()
ax.grid()
머신러닝,딥러닝,ai 공부