
Pandas 활용 1
데이터 프레임 마스킹
# numpy 불러오기 및 pd로 사용
# pandas 불러오기 및 pd로 사용
import numpy as np
import pandas as pd
df = pd.DataFrame(np.random.randint(1, 10, (2, 2)), index=[0, 1], columns=["A", "B"])
print(df)
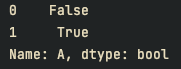
# 컬럼 A의 각 원소가 5보다 작거나 같은지 출력
print(df["A"] <= 5)
# 컬럼 A의 원소가 5보다 작고, 컬럼 B의 원소가 8보다 작은 행 추출
print(df.query("A <= 5 and B <= 8"))결과


데이터 프레임의 개별 연산 1 : 값 연산
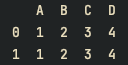
df = pd.DataFrame([[1, 2, 3, 4], [1, 2, 3, 4]], index=[0, 1], columns=["A", "B", "C", "D"])
print(df)
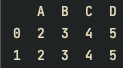
# lambda를 이용해서 각 원소에 + 1
df = df.apply(lambda x: x + 1)
print(df)
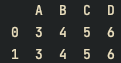
# add 함수
def add(x):
return x + 1
# 함수를 이용해서 각 원소에 + 1
df = df.apply(add)
print(df)결과
데이터 프레임의 개별 연산 2 : 값 바꾸기
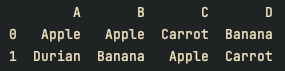
df = pd.DataFrame([
['Apple', 'Apple', 'Carrot', 'Banana'],
['Durian', 'Banana', 'Apple', 'Carrot']],
index=[0, 1], columns=["A", "B", "C", "D"]
)
print(df)
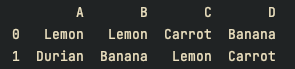
# replace를 이용해서 Apple을 Lemon으로 대체
df = df.replace({"Apple" : "Lemon"})
print(df)결과
데이터 프레임의 그룹화 1 : groupby
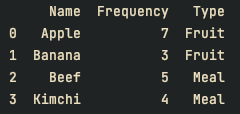
df = pd.DataFrame([
['Apple', 7, 'Fruit'],
['Banana', 3, 'Fruit'],
['Beef', 5, 'Meal'],
['Kimchi', 4, 'Meal']], columns=["Name", "Frequency", "Type"])
print(df)
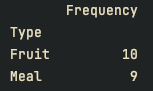
# 컬럼 Type을 기준으로 sum()
print(df.groupby(['Type']).sum())결과
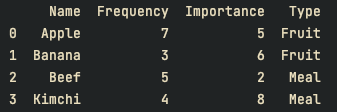
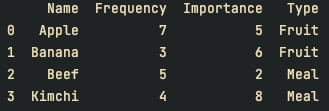
데이터 프레임의 그룹화 2 : aggregate
df = pd.DataFrame([
['Apple', 7, 5, 'Fruit'],
['Banana', 3, 6, 'Fruit'],
['Beef', 5, 2, 'Meal'],
['Kimchi', 4, 8, 'Meal']], columns=["Name", "Frequency", "Importance", "Type"])
print(df)
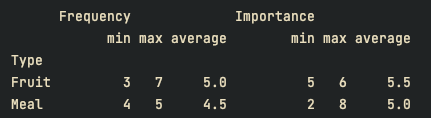
# 컬럼 Type을 기준으로 min, max, average
print(df.groupby(["Type"]).aggregate([min, max, np.average]))결과
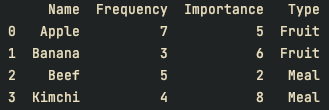
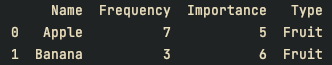
데이터 프레임의 그룹화 3 : filter
df = pd.DataFrame([
    ['Apple', 7, 5, 'Fruit'],
    ['Banana', 3, 6, 'Fruit'],
    ['Beef', 5, 2, 'Meal'],
    ['Kimchi', 4, 8, 'Meal']], columns=["Name", "Frequency", "Importance", "Type"])
print(df)

# 컬럼 Frequency의 평균이 5보다 크거나 같은 것 반환
def my_filter(data):
    return data["Frequency"].mean() >= 5

# 컬럼 Type을 기준으로 my_filter에 맞는 그룹
df = df.groupby(["Type"]).filter(my_filter)
print(df)
결과
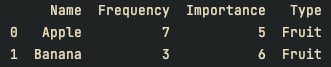
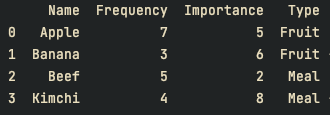
데이터 프레임의 그룹화 4 : get_group
df = pd.DataFrame([
    ['Apple', 7, 5, 'Fruit'],
    ['Banana', 3, 6, 'Fruit'],
    ['Beef', 5, 2, 'Meal'],
    ['Kimchi', 4, 8, 'Meal']], columns=["Name", "Frequency", "Importance", "Type"])
print(df)

# 컬럼 Type 값중 Fruit으로 그룹화
df = df.groupby("Type").get_group("Fruit")
print(df)
결과
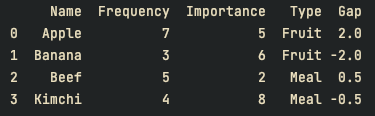
데이터 프레임의 그룹화 5 : 연산 후 추가
df = pd.DataFrame([
    ['Apple', 7, 5, 'Fruit'],
    ['Banana', 3, 6, 'Fruit'],
    ['Beef', 5, 2, 'Meal'],
    ['Kimchi', 4, 8, 'Meal']], columns=["Name", "Frequency", "Importance", "Type"])
    print(df)

# 컬럼 Gap 추가
df["Gap"] = df.groupby("Type")["Frequency"].apply(lambda x: x - x.mean())
print(df)
결과

안녕하세요!! 세상에 관심이 많은 공학자입니다!😆