스케일링
1. Scikit-Learn
📌 1. Scikit-Learn
-
python을 대표하는 머신러닝 라이브러리
-
매우 다양한 전처리 도구와 알고리즘을 제공하고 있어 머신러닝 기법을 배우는 데 적합
- 분류, 회귀, 클러스터링, 차원 축소 등을 포함한 광범위한 머신러닝 알고리즘을 제공
- 예제와 사용 설명서가 잘 되어있어 참고하여 코드를 작성하기 용이
-
데이터 분석을 위한 간단하고 효율적인 도구를 제공
- 간단하고 직관적인 API를 제공하므로 다양한 수준의 전문 지식을 가진 사용자가 접근 가능
- fit(), transform(), predict() 등 체계적이고 일관된 분석 및 학습모형 운용 체계를 갖추고 있음
- 다른 많은 패키지도 scikit-learn과 동일한 체계를 제공하여 유사한 프레임에서 사용이 가능
-
NumPy, Pandas, SciPy 및 matplotlib를 기반으로 구축되어 있어 다른 파이썬 패키지와 함께 사용하기 용이
- NumPy: 다차원 배열을 위한 기본 패키지
- Pandas: 데이터프레임을 위한 기본 패키지
- SciPy: 과학 계산용 함수를 모아놓은 패키지
- matplotlib: 데이터 시각화를 위한 패키지
-
단점은
딥러닝, 강화학습, 시계열 모형은 매우 약함
최근 개발된 대용량을 위한 데이터프레임인 Polars와 같은 라이브러리와는 연동이 잘 안됨 -
주요 기능
- 분류 : 로지스틱 회귀, 결졍 트리, 서포트 벡터 머신(SVM)
- 회귀 : 선형 회귀, 릿지 회귀 등
- 군집화 : k-means 군집화, 계층적 군집화 등
- 차원 축소 : 주성분 분석(PCA), t-분산 확률적 이웃 내재화(t-SNE) 등
- 전처리 : 데이터 정규화, 스케일링, 인코딩 등
📌 2. Scikit-Learn preprocessing
- Scikit-Learn의 전처리 기능
- 스케일링(scaling) : 서로 다른 변수의 값 범위를 일정한 수준으로 맞추는 것
- 이진화(binarization) : 연속적인 값을 0 또는 1로 나누는 것. 연속형 변수 -> 이진형 변수
- 인코딩(encoding) : 범주형 값을 적절한 숫자형으로 변환하는 작업. 범주형 변수 -> 수치형 변수
- 변환(transformation) : 데이터의 분포를 변환하여 정규성을 확보하는 것
- 스케일링(scaling)
- 서로 다른 변수(feature)의 값 범위를 선형변환을 통해 일정한 수준으로 맞추는 작업
: 독립변수(feature)별로 값의 변위가 상이하면
종속변수(target)에 대한 영향이 독립변수의 변위에 따라 크게 달라짐 -> 머신러닝 시 학습 효과가 떨어짐
: 컴퓨터의 비트수로 인해 다른 값으로 인식되는 오버플로우(overflow)나 언더플로우(underflow) 방지
: k-means 등 거리 기반의 모델에서는 스케일링 매우 중요 - 표준화(Standardization) : 표준분포화
- StandardScaler() : 기본 스케일러, 평균, 표준편차 사용
- RobustScaler() : 중앙값과 IQR(Q3-Q1)을 사용. 이상치의 영향을 최소화
- 정규화(Normalization) : 규격화(주로[0,1]로 스캐일링)
- MinMaxScaler() : 범위가 [0,1]이 되도록 스케일링
- MaxAbsXcaler() : 양수는 [0,1], 음수는 [-1,0], 양음수는 [-1,1]이 되도록 스케일링
- 변환(Transformation) : 특정한 분포나 모양을 따르도록 스케일링
- PowerTransformer() : 정규분포화(Box-Cox변환, Yeo-Johnson 변환)
- QuantileTransformer() : 균일(Uniform) 또는 정규(Gaussian)분포로 변환
- Normalizer() : 한 행의 모든 피처들 사이의 유클리드 거리가 1이 되도록 변환
- 스케일링 절차
- scaler 객체를 이용
- fit() : 주어진 데이터에 맞추어 학습
- 데이터 변환을 위한 기준 정보 설정을 적용
- transform() : scaler 적용, fit()된 정보를 이용해 데이터 변환
- fit_transform() : fit과 transform 한번에 실행
- 훈련 데이터는 fit()과 transform() 모두 적용
- 평가 데이터는 transform()만 적용
- 표준화(Standardization)
- RBF(Radial Basis Function) 커널을 이용하는 서포트 벡터 머신(SVM, Support Vector Machine), 선형회귀(Linear Regression)는 데이터가 정규분포를 가지고 있다고 가정
- 이상치에 민감하고 분류보다는 회귀에 유용
📋 기저함수와 커널
1) 기저함수
: 데이터가 비선형이면 선형회귀모형에 적합하지 않다. 데이터에 맞는 비선형 모형을 만들기 위해 데이터에 적합한 비선형 함수를 생각해 낼 수 있어야 한다. 이를 위해 만들어진 것이 기저함수(basis function)모형이다.
1. 다항 기저함수(polynomial basis function)
: global function으로, 하나의 region이라서 데이터 하나의 변경이 전체 region에 영향을 미친다.
테스트를 위한 예시함수
import numpy as np
import pandas as pd
import matplotlib.pyplot as plt

num = 100
X = np.linspace(-1, 1, num).reshape(100, 1)
Y = np.sin(2*np.pi*X)
plt.plot(X, Y, 'g-')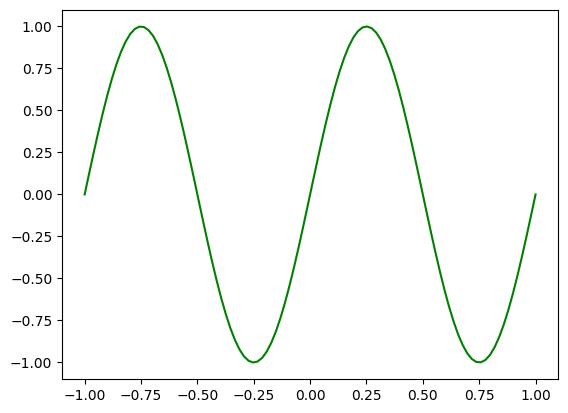
num = 100
i = 9

x = np.linspace(-1, 1, num).reshape(100, 1)

M = 9
for i in range(M+1):
  y = X**i
  plt.plot(X, y)
plt.title('polynomial curve fitting') 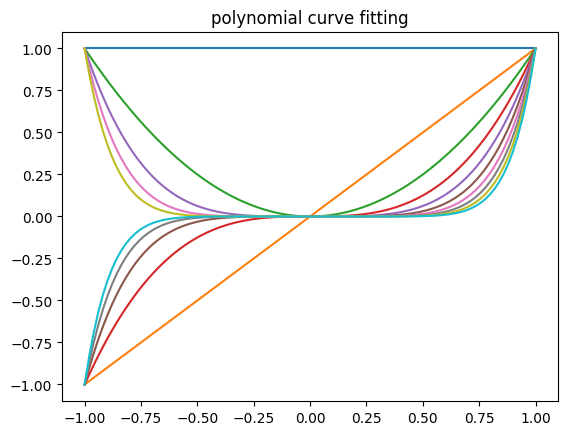
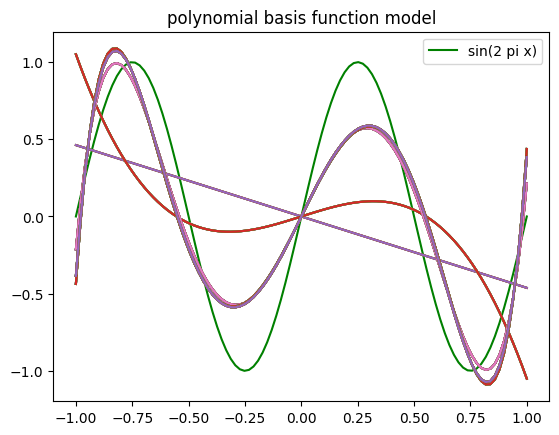
- #loss : 24.098
- 가우시안 방사 기저함수((Gaussian) Radial basis function)
: ui ; governing the locations of the basis functions in input space
: spline과 같이 ui값을 조정해서 각 구간별 기저함수를 사용할 수 있다.
num = 100
i = 9
X = np.linspace(0,1,num).reshape(100,1)

M = 9
for interval in range(2, M+1):
  for j in range(interval):
    y = np.exp(-(X - j / (interval - 1)) ** 2 / (2 * 0.1 ** 2))
    plt.plot(X, y)
    plt.title("Radial basis function")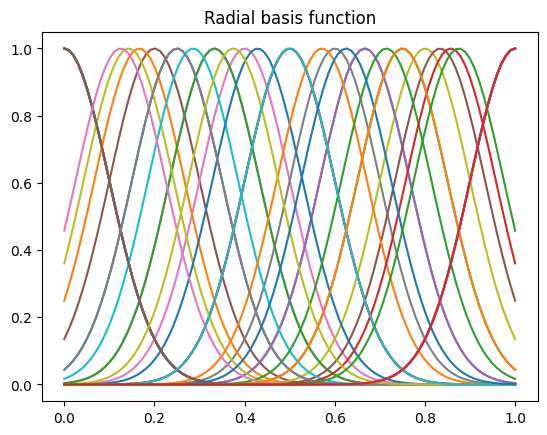

- #loss : 10.192
- y basis function이 기존함수와 유사하며 모형복잡도를 증가시키면 loss가 감소함
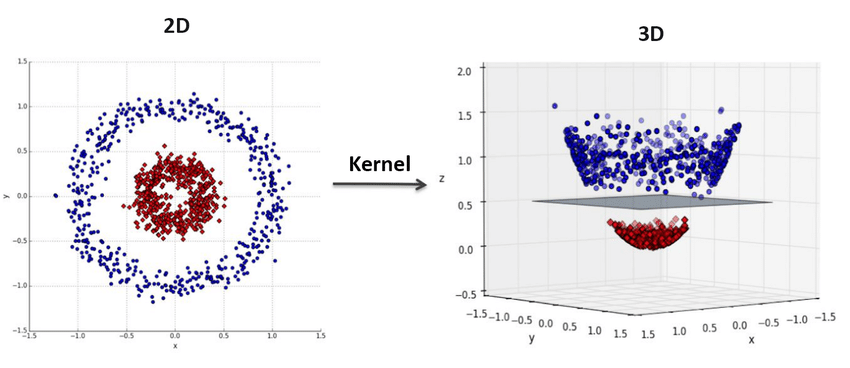
2) 커널(Kernel)
: 데이터를 고차원으로 보내 서포트 벡터를 구하고 저차원으로 축소하는 과정은 복잡하고 많은 연산량을 필요로 하기 때문에 Kernel Trick을 사용한다.
- Kernel trick : 선형분리가 불가능한 저차원 데이터를 고차원으로 보내 선형 분리를 하는 방법
- 고차원 Mapping과 고차원에서의 내적 연산을 한 번에 할 수 있다.
- 표준화 파이썬 예시
import pandas as pd
import seaborn as sns

#소수점 4째자리 이하에 반올림
pd.set_option("display.float_format", lambda x: f'{x:.4f}')

#iris 데이터 로드
iris = sns.load_dataset('iris')

#iris의 수차형 변수만 추출
iris = iris.select_dtypes(exclude = 'object')

#iris의 기술통계량 확인
iris.describe()

#sepal_length와 petal_length의 joinplot그림
sns.jointplot(data = iris, x = 'petal_length', y= 'petal_width', kind = 'reg')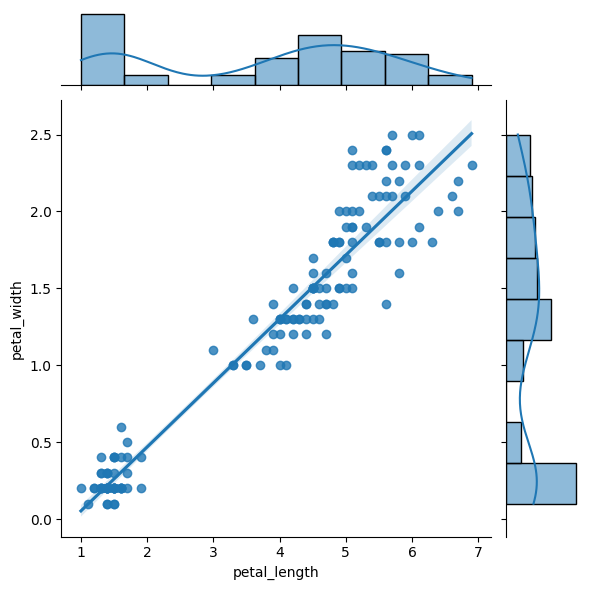
- 표준화하기
from sklearn.preprocessing import StandardScaler, RobustScaler

#scaler객체 생성
standard_scaler = StandardScaler()
robust_scaler   = RobustScaler()

#데이터 변환
iris_standard = pd.DataFrame(standard_scaler.fit_transform(iris), columns = iris.columns)
iris_robust   = pd.DataFrame(robust_scaler.fit_transform(iris), columns = iris.columns)

#결과 출력
print("Standard Scaled : \n", iris_standard.describe())
print()
print("Robust Scaled : \n", iris_robust.describe())
Standard Scaled :
sepal_length sepal_width petal_length petal_width
count 150.0000 150.0000 150.0000 150.0000
mean -0.0000 -0.0000 -0.0000 -0.0000
std 1.0034 1.0034 1.0034 1.0034
min -1.8700 -2.4339 -1.5676 -1.4471
25% -0.9007 -0.5924 -1.2266 -1.1838
50% -0.0525 -0.1320 0.3365 0.1325
75% 0.6745 0.5586 0.7628 0.7907
max 2.4920 3.0908 1.7858 1.7121
Robust Scaled :
sepal_length sepal_width petal_length petal_width
count 150.0000 150.0000 150.0000 150.0000
mean 0.0333 0.1147 -0.1691 -0.0671
std 0.6370 0.8717 0.5044 0.5082
min -1.1538 -2.0000 -0.9571 -0.8000
25% -0.5385 -0.4000 -0.7857 -0.6667
50% 0.0000 0.0000 0.0000 0.0000
75% 0.4615 0.6000 0.2143 0.3333
max 1.6154 2.8000 0.7286 0.8000- seaborn의 jointplot은 subplot 그리기 어려움
- patchwork 라이브러리를 이용해 subplot 그림
#pip install patchworklib
import seaborn as sns
import patchworklib as pw
pw.overwrite_axisgrid()
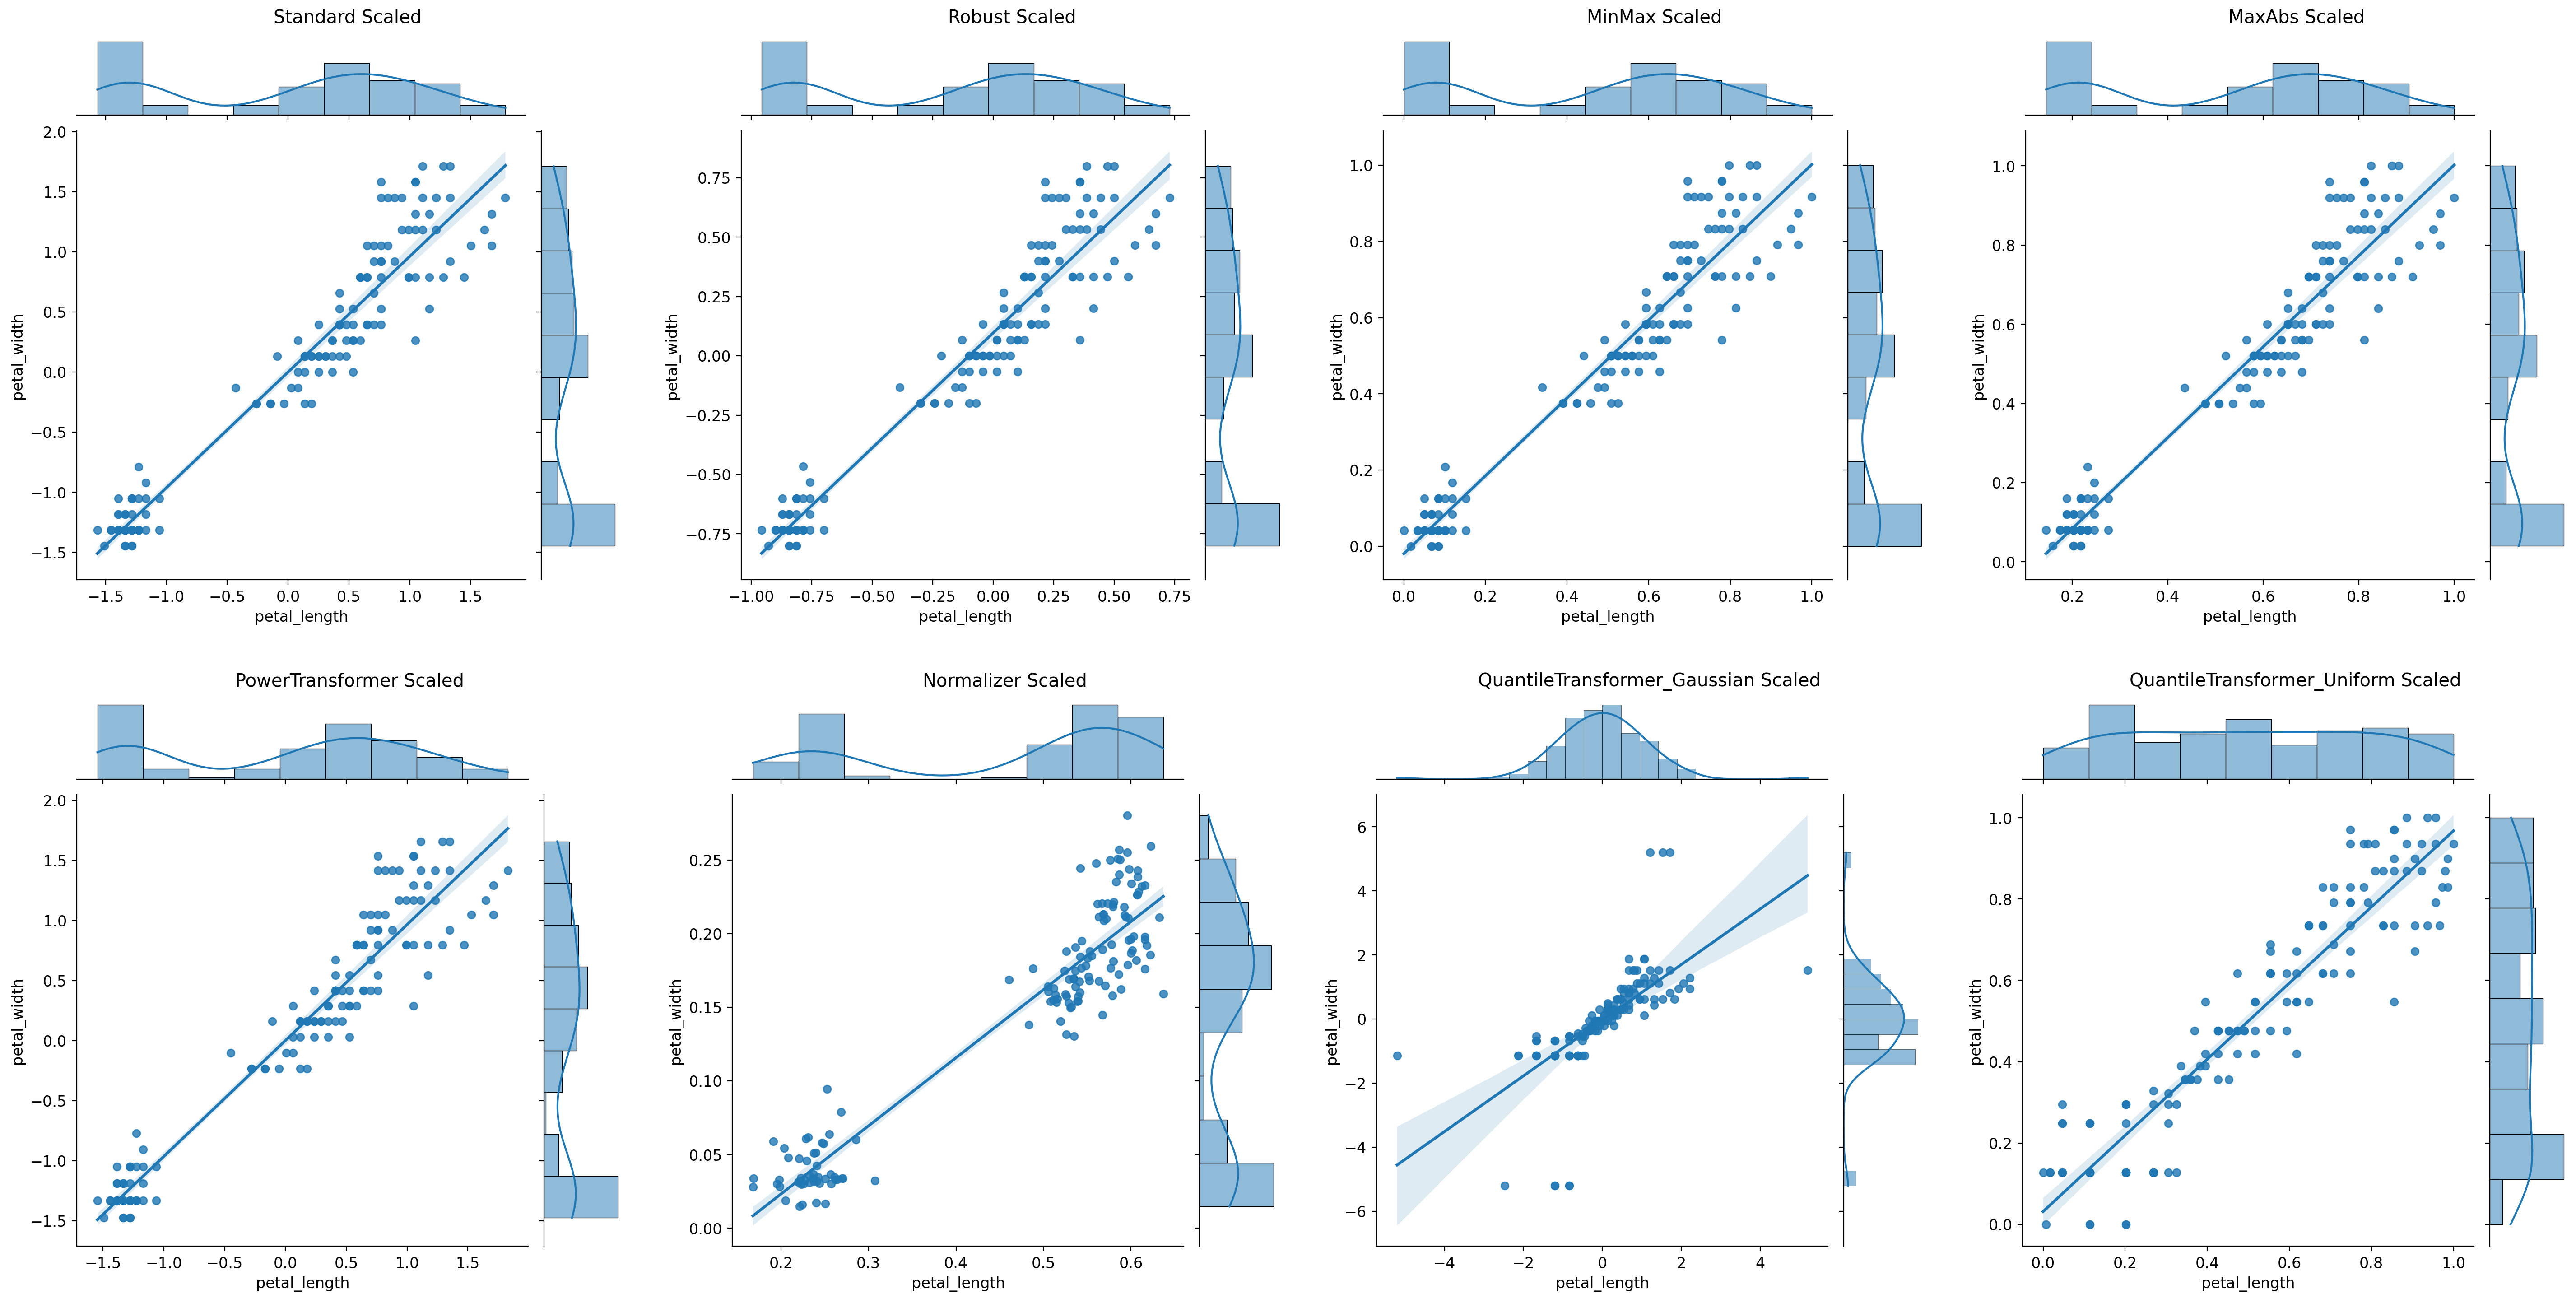
g1 = sns.jointplot(data = iris_standard, x = "petal_length", y = "petal_width", kind = "reg")
g1 = pw.load_seaborngrid(g1)
g1.set_suptitle("Standard Scaled")
g2 = sns.jointplot(data = iris_robust, x = "petal_length", y = "petal_width", kind = "reg")
g2 = pw.load_seaborngrid(g2)
g2.set_suptitle("Robust Scaled")
g3 = (g1|g2)
g3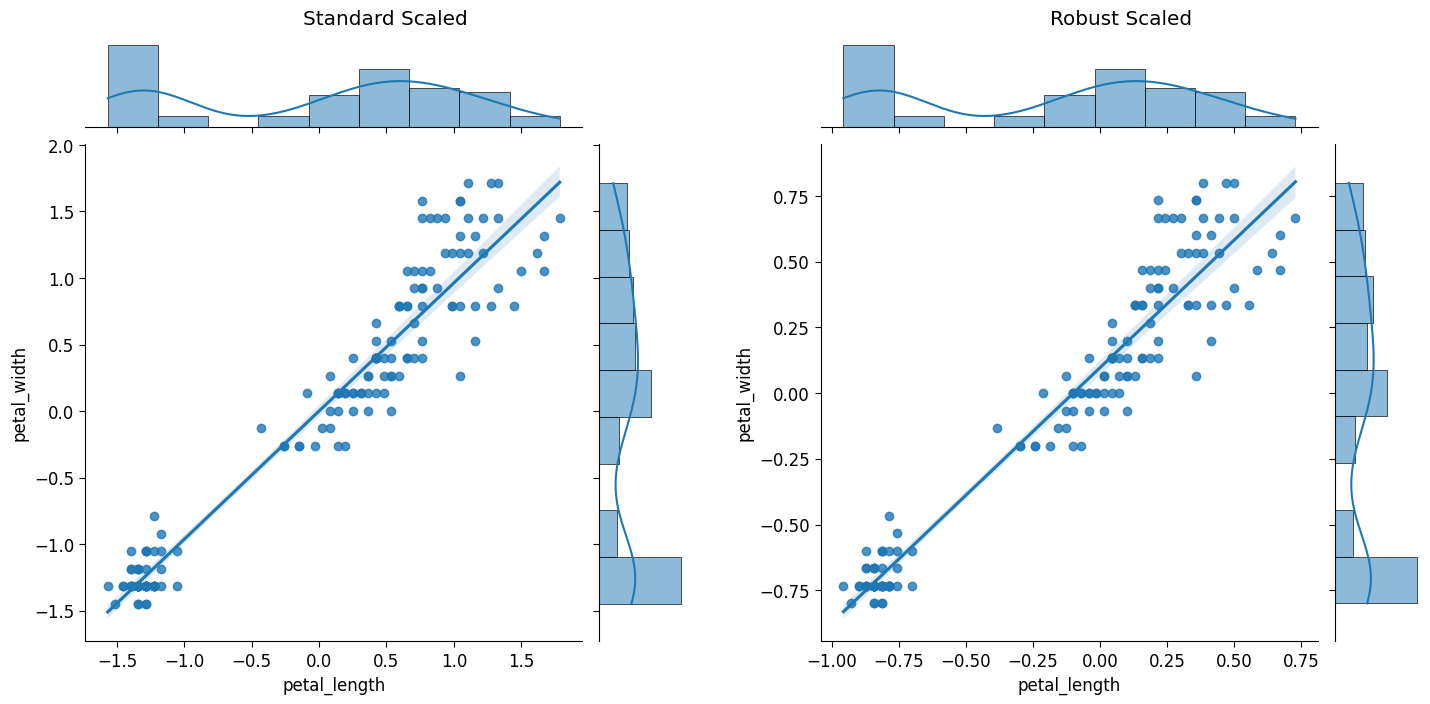
- 정규화(Normalization)
-
MinMaxScaler() : 범위가 [0,1]이 되도록 스케일링
-
MaxAbsScaler() : 양수는 [0,1], 음수는 [-1,0], 양음수는 [-1,1]이 되도록 스케일링
-
정규화 파이썬 예시
from sklearn.preprocessing import MinMaxScaler, MaxAbsScaler

#scaler 객체 생성
minmax_scaler = MinMaxScaler()
maxabs_scaler = MaxAbsScaler()

#데이터 변환
iris_minmax = pd.DataFrame(minmax_scaler.fit_transform(iris), columns=iris.columns)
iris_maxabs = pd.DataFrame(maxabs_scaler.fit_transform(iris), columns=iris.columns)

#결과 출력
print("MinMax Scaled : \n", iris_minmax.describe())
print()
print("MaxAbs Scaled : \n", iris_maxabs.describe())
MinMax Scaled :
sepal_length sepal_width petal_length petal_width
count 150.0000 150.0000 150.0000 150.0000
mean 0.4287 0.4406 0.4675 0.4581
std 0.2300 0.1816 0.2992 0.3176
min 0.0000 0.0000 0.0000 0.0000
25% 0.2222 0.3333 0.1017 0.0833
50% 0.4167 0.4167 0.5678 0.5000
75% 0.5833 0.5417 0.6949 0.7083
max 1.0000 1.0000 1.0000 1.0000
MaxAbs Scaled :
sepal_length sepal_width petal_length petal_width
count 150.0000 150.0000 150.0000 150.0000
mean 0.7397 0.6948 0.5446 0.4797
std 0.1048 0.0991 0.2558 0.3049
min 0.5443 0.4545 0.1449 0.0400
25% 0.6456 0.6364 0.2319 0.1200
50% 0.7342 0.6818 0.6304 0.5200
75% 0.8101 0.7500 0.7391 0.7200
max 1.0000 1.0000 1.0000 1.0000- 그래프 그리기
g1 = sns.jointplot(data = iris_standard, x = "petal_length", y = "petal_width", kind = "reg")
g1 = pw.load_seaborngrid(g1)
g1.set_suptitle("Standard Scaled")

g2 = sns.jointplot(data = iris_robust, x = "petal_length", y = "petal_width", kind = "reg")
g2 = pw.load_seaborngrid(g2)
g2.set_suptitle("Robust Scaled")

g3 = (g1|g2)
g3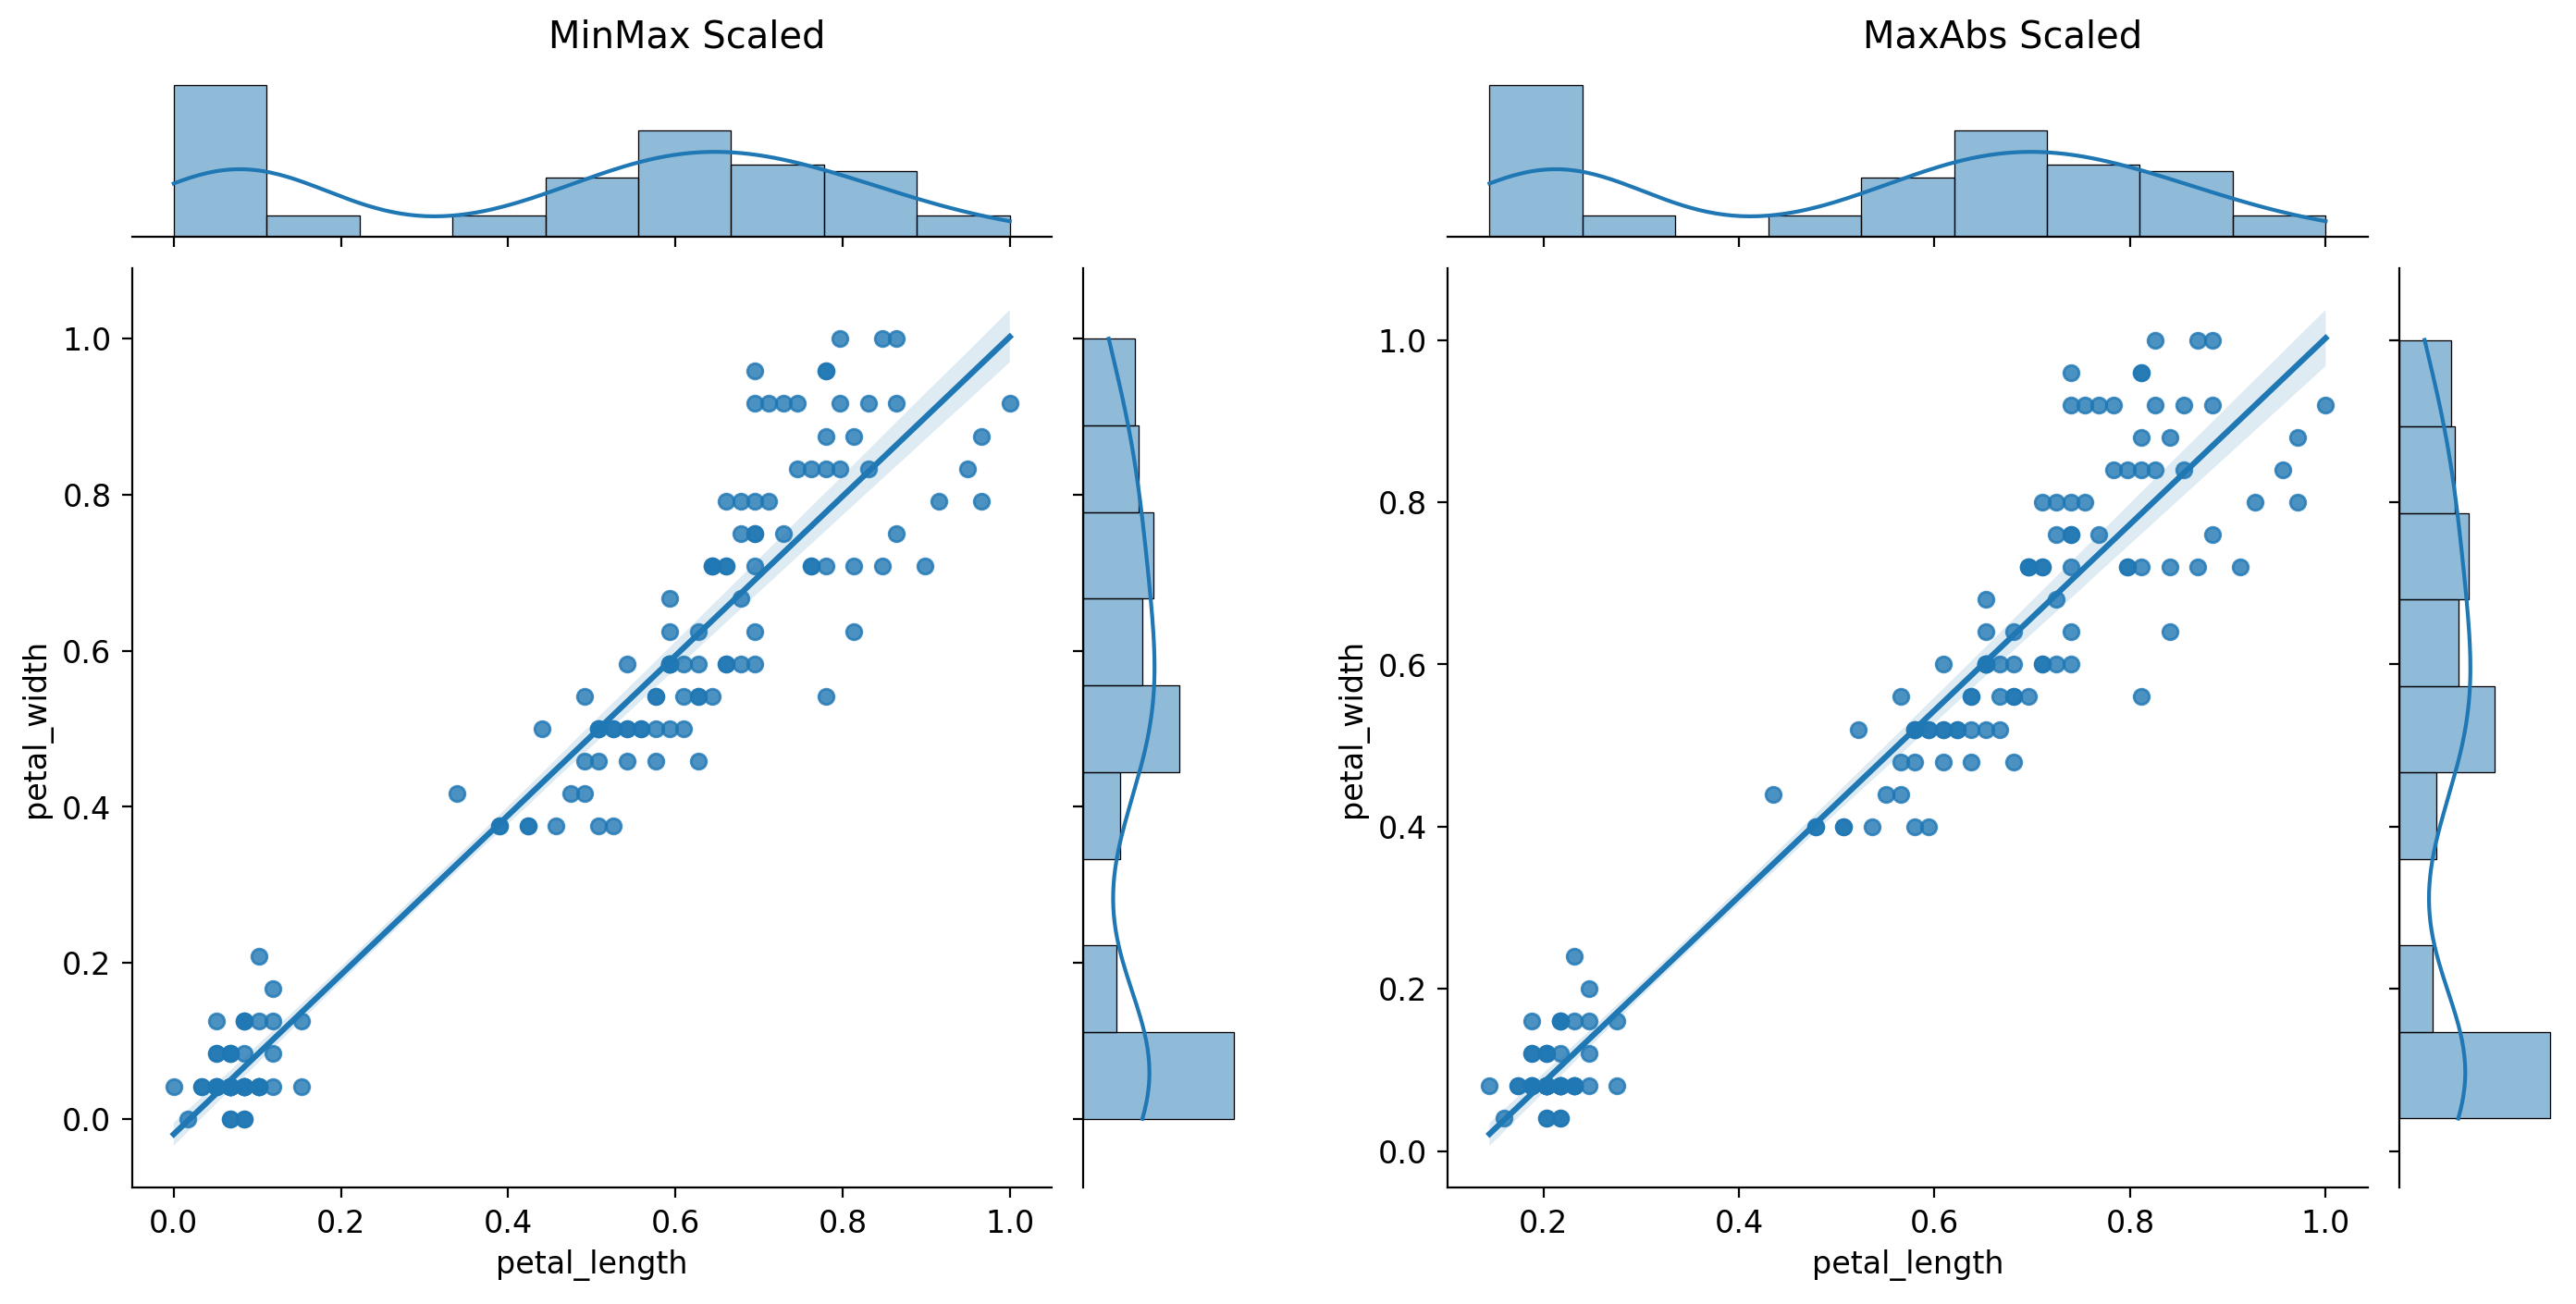
5) 변환(Transformation)
- PowerTransformer() : 정규분포화(Box-Cox변환, Yeo-Johnson 변환)
- QuantileTransformer() : 균일(Uniform) 또는 정규(Gaussian)분포로 변환
- Normalizer() : 한 행의 모든 피처들 사이의 유클리드 거리가 1이 되도록 변환
import numpy as np
from sklearn.preprocessing import PowerTransformer, Normalizer

#Scaler 객체 생성
power_scaler  = PowerTransformer()
normal_scaler = Normalizer()

#데이터 변환
iris_pow  = pd.DataFrame(power_scaler.fit_transform(iris), columns=iris.columns)
iris_norm = pd.DataFrame(normal_scaler.fit_transform(iris), columns=iris.columns)

#결과 출력
print("Power Scaled : \n", iris_pow.describe())
print()
print("Normalizer Scaled : \n", iris_norm.describe())
#각 행의 벡터 크기가 1이 되는지 확인
print("Eucledian Distance from 0 : \n", np.linalg.norm(iris_norm, axis = 1))
Power Scaled :
sepal_length sepal_width petal_length petal_width
count 150.0000 150.0000 150.0000 150.0000
mean 0.0000 -0.0000 -0.0000 0.0000
std 1.0034 1.0034 1.0034 1.0034
min -2.1378 -2.7591 -1.5456 -1.4768
25% -0.8957 -0.5615 -1.2244 -1.1896
50% 0.0264 -0.0819 0.3226 0.1597
75% 0.7222 0.5959 0.7598 0.7965
max 2.1770 2.7432 1.8288 1.6585
Normalizer Scaled :
sepal_length sepal_width petal_length petal_width
count 150.0000 150.0000 150.0000 150.0000
mean 0.7514 0.4052 0.4548 0.1411
std 0.0444 0.1056 0.1600 0.0780
min 0.6539 0.2384 0.1678 0.0147
25% 0.7153 0.3267 0.2509 0.0487
50% 0.7549 0.3544 0.5364 0.1641
75% 0.7869 0.5276 0.5800 0.1975
max 0.8609 0.6071 0.6370 0.2804
Eucledian Distance from 0 :
[1. 1. 1. 1. 1. 1. 1. 1. 1. 1. 1. 1. 1. 1. 1. 1. 1. 1. 1. 1. 1. 1. 1. 1.
1. 1. 1. 1. 1. 1. 1. 1. 1. 1. 1. 1. 1. 1. 1. 1. 1. 1. 1. 1. 1. 1. 1. 1.
1. 1. 1. 1. 1. 1. 1. 1. 1. 1. 1. 1. 1. 1. 1. 1. 1. 1. 1. 1. 1. 1. 1. 1.
1. 1. 1. 1. 1. 1. 1. 1. 1. 1. 1. 1. 1. 1. 1. 1. 1. 1. 1. 1. 1. 1. 1. 1.
1. 1. 1. 1. 1. 1. 1. 1. 1. 1. 1. 1. 1. 1. 1. 1. 1. 1. 1. 1. 1. 1. 1. 1.
1. 1. 1. 1. 1. 1. 1. 1. 1. 1. 1. 1. 1. 1. 1. 1. 1. 1. 1. 1. 1. 1. 1. 1.
1. 1. 1. 1. 1. 1.]- 그래프 그리기
g7 = sns.jointplot(data = iris_pow, x = "petal_length", y = "petal_width", kind = "reg")
g7 = pw.load_seaborngrid(g7)
g7.set_suptitle("PowerTransformer Scaled")

g8 = sns.jointplot(data = iris_norm, x = "petal_length", y = "petal_width", kind = "reg")
g8 = pw.load_seaborngrid(g8)
g8.set_suptitle("Normalizer Scaled")

g9 = (g7|g8)
g9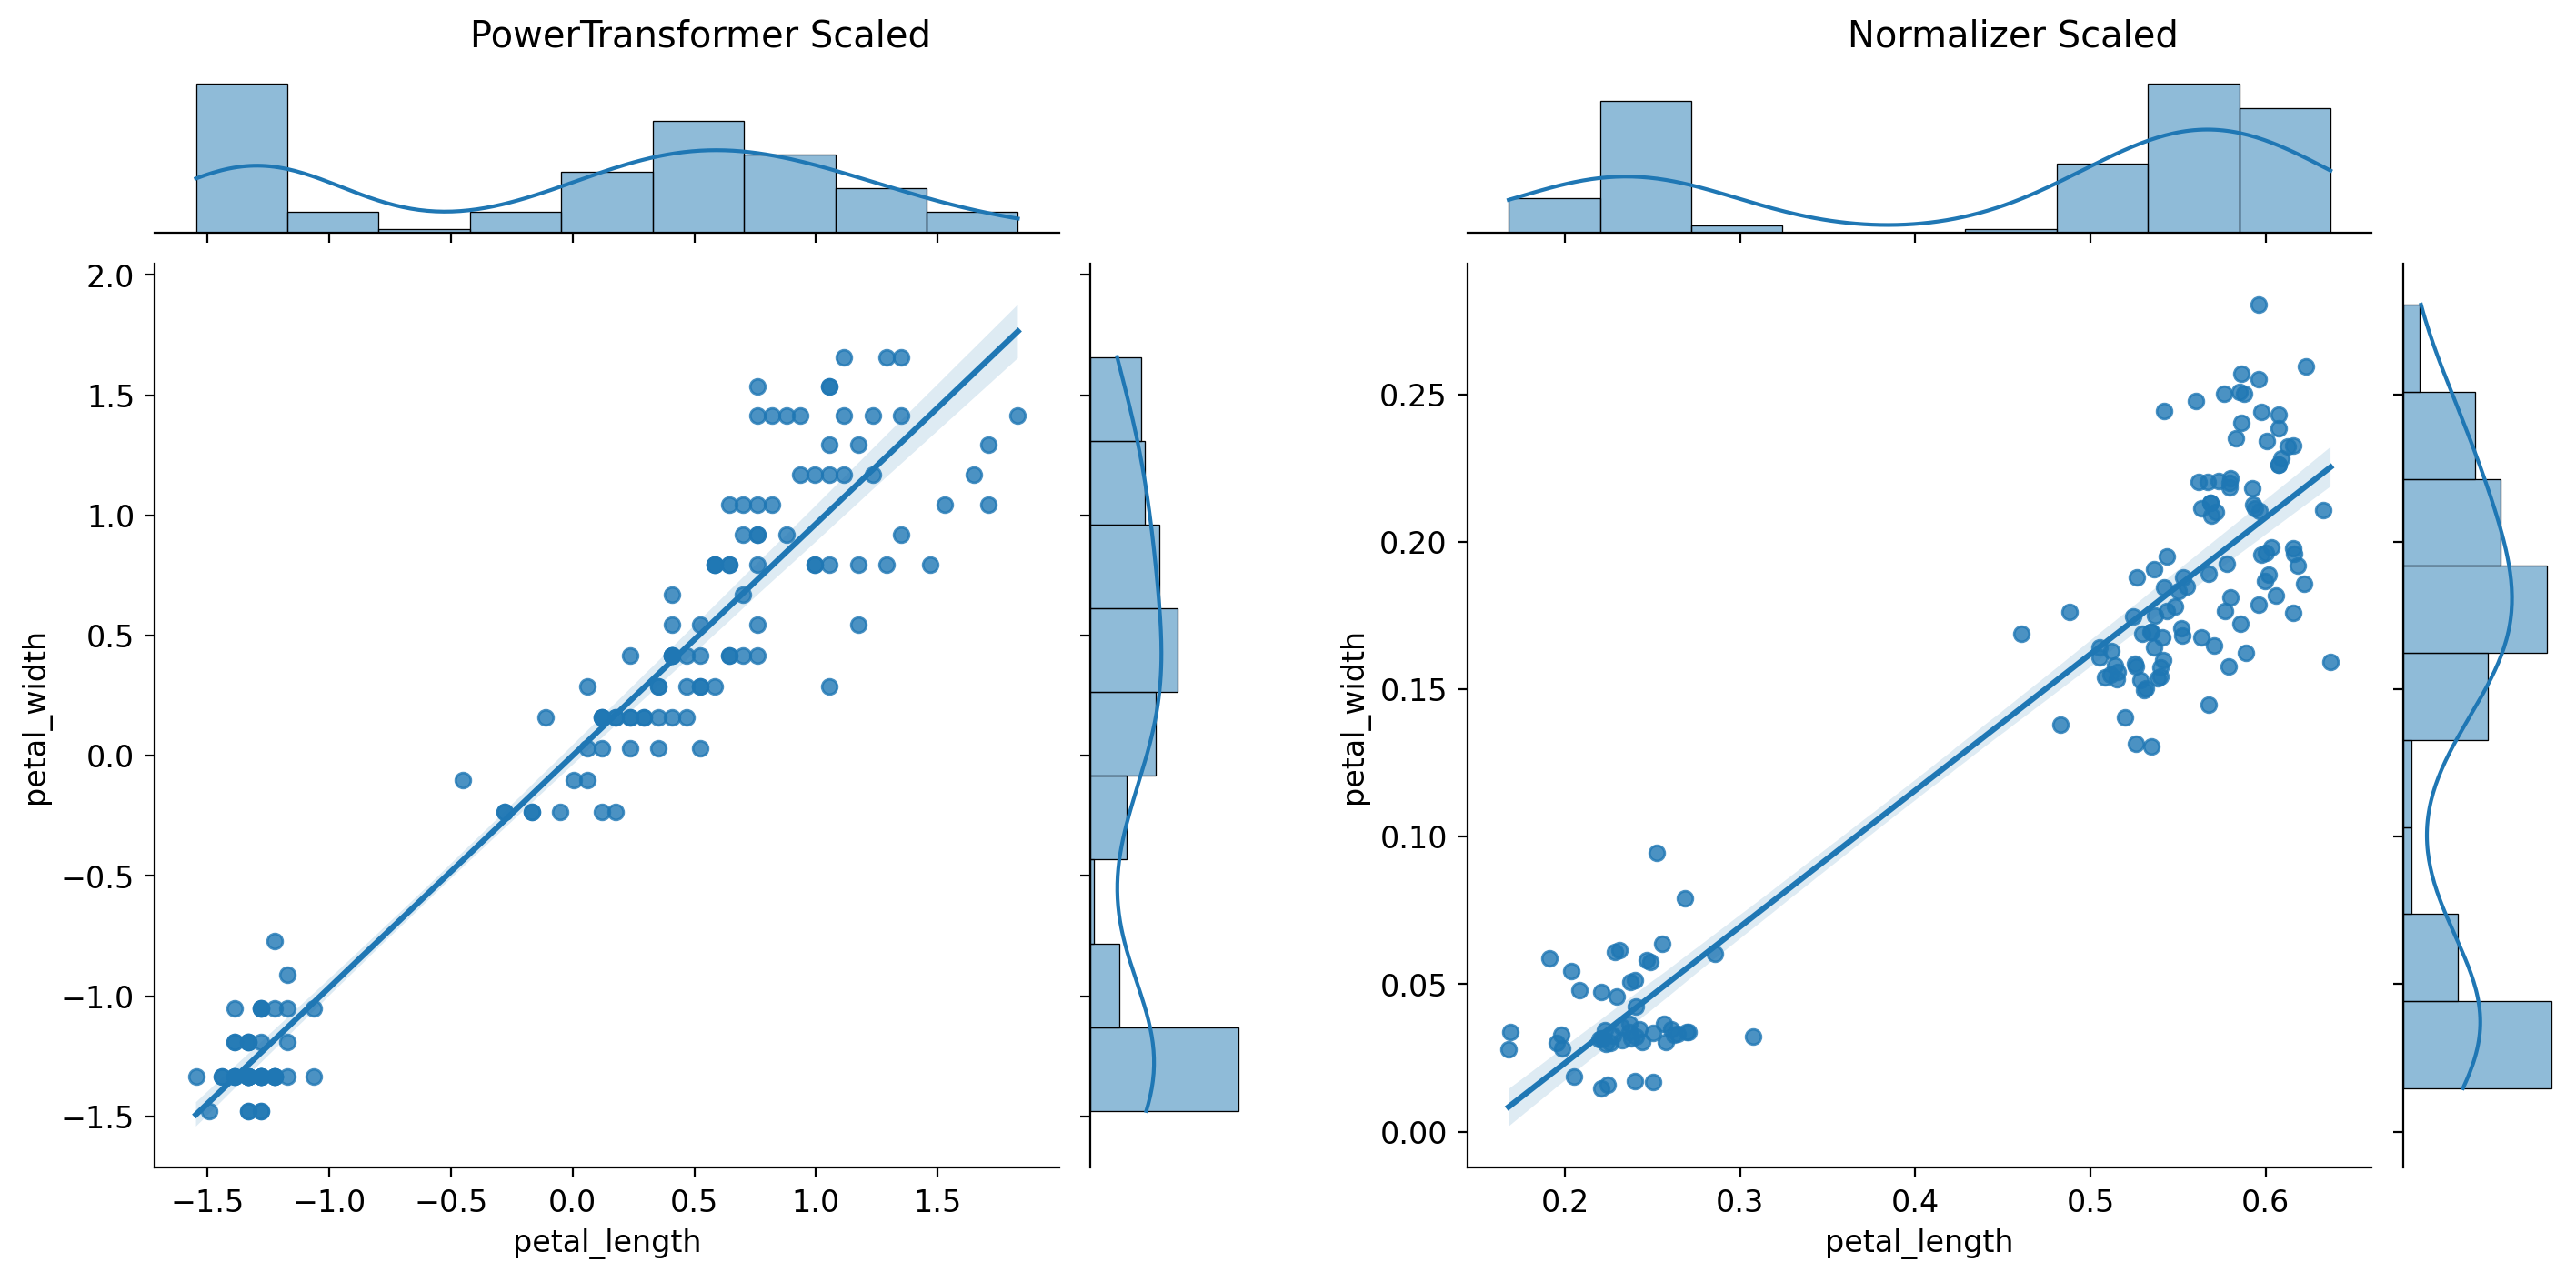
from sklearn.preprocessing import QuantileTransformer

#scaler객체 생성
gaussian_scaler = QuantileTransformer(output_distribution = 'normal')
uniform_scaler  = QuantileTransformer(output_distribution = 'uniform')

#데이터 변환
iris_gaussian = pd.DataFrame(gaussian_scaler.fit_transform(iris), columns = iris.columns)
iris_uniform  = pd.DataFrame(uniform_scaler.fit_transform(iris), columns = iris.columns)

#결과 출력
print("QuantileTransformer_Gaussian Scaled : \n", iris_gaussian.describe())
print()
print("QuantileTransformer_Uniform Scaled : \n", iris_uniform.describe())
QuantileTransformer_Gaussian Scaled :
sepal_length sepal_width petal_length petal_width
count 150.0000 150.0000 150.0000 150.0000
mean -0.0012 0.0014 0.0021 -0.0339
std 1.1311 1.1328 1.1331 1.4616
min -5.1993 -5.1993 -5.1993 -5.1993
25% -0.7011 -0.6175 -0.6175 -0.6798
50% 0.0252 -0.0842 0.0084 -0.0589
75% 0.6587 0.6277 0.6692 0.6277
max 5.1993 5.1993 5.1993 5.1993
QuantileTransformer_Uniform Scaled :
sepal_length sepal_width petal_length petal_width
count 150.0000 150.0000 150.0000 150.0000
mean 0.5002 0.5002 0.5004 0.5001
std 0.2914 0.2900 0.2914 0.2912
min 0.0000 0.0000 0.0000 0.0000
25% 0.2416 0.2685 0.2685 0.2483
50% 0.5101 0.4664 0.5034 0.4765
75% 0.7450 0.7349 0.7483 0.7349
max 1.0000 1.0000 1.0000 1.0000- 그래프 그리기
g10 = sns.jointplot(data = iris_gaussian, x = "petal_length", y = "petal_width", kind = "reg")
g10 = pw.load_seaborngrid(g10)
g10.set_suptitle("QuantileTransformer_Gaussian Scaled")

g11 = sns.jointplot(data = iris_uniform, x = "petal_length", y = "petal_width", kind = "reg")
g11 = pw.load_seaborngrid(g11)
g11.set_suptitle("QuantileTransformer_Uniform Scaled")

g12 = (g10|g11)
g12
- 그래프 합치기
(g1|g2|g4|g5)/(g7|g8|g10|g11)