[Paper Review] Development and validation of a deep learning algorithm for improving Gleason scoring of prostate cancer
Paper Review
Development and validation of a deep learning algorithm for improving Gleason scoring of prostate cancer
최근 맡아 진행중인 프로젝트와 가려는 방향이 비슷한 논문이다. nature npj digital medicine 논문으로 2019년에 accept 되어 311번 인용되었다. (이 논문은 꼭 리뷰 해야겠다 다짐했는데 지금에서야 ... 하게 되었다.)
Introduction
Prostate adenocarcinoma (cancer) 는 남성에게 2번째로 많이 발병되는 암종이다. 이 환자의 중증도를 stratify 하는 방법으로, prostate resection 이나 prostate biopsy 의 H&E image 를 보고 pathologist 가 morphologic feature 에 따라 gleason score 를 메겨 clinical treatment 를 정하거나 환자의 예후를 예측하는데 이용해 왔다. 하지만 이러한 방법은, pathologist 에 따라 subjective 한 scoring 이 잦고 (보고되어 왔고) 같은 환자에 대해 reproducibility 가 떨어진다는 문제가 있어왔다. 저자는 이러한 문제들을 해결하기 위해 deep learning 알고리즘을 이용한 더 세분화된 gleason score 를 propose 했고 이에 대해 validation 하는 연구를 진행했다.
Results
Overview of the deep learning system and data acquisition
two-stage deep learning system 을 활용하였다. 첫번째는, regional Gleason pattern classification, 그 뒤로 K-nearest-neighbor-based whole-slide Gleason Grade group classification 을 수행했다.
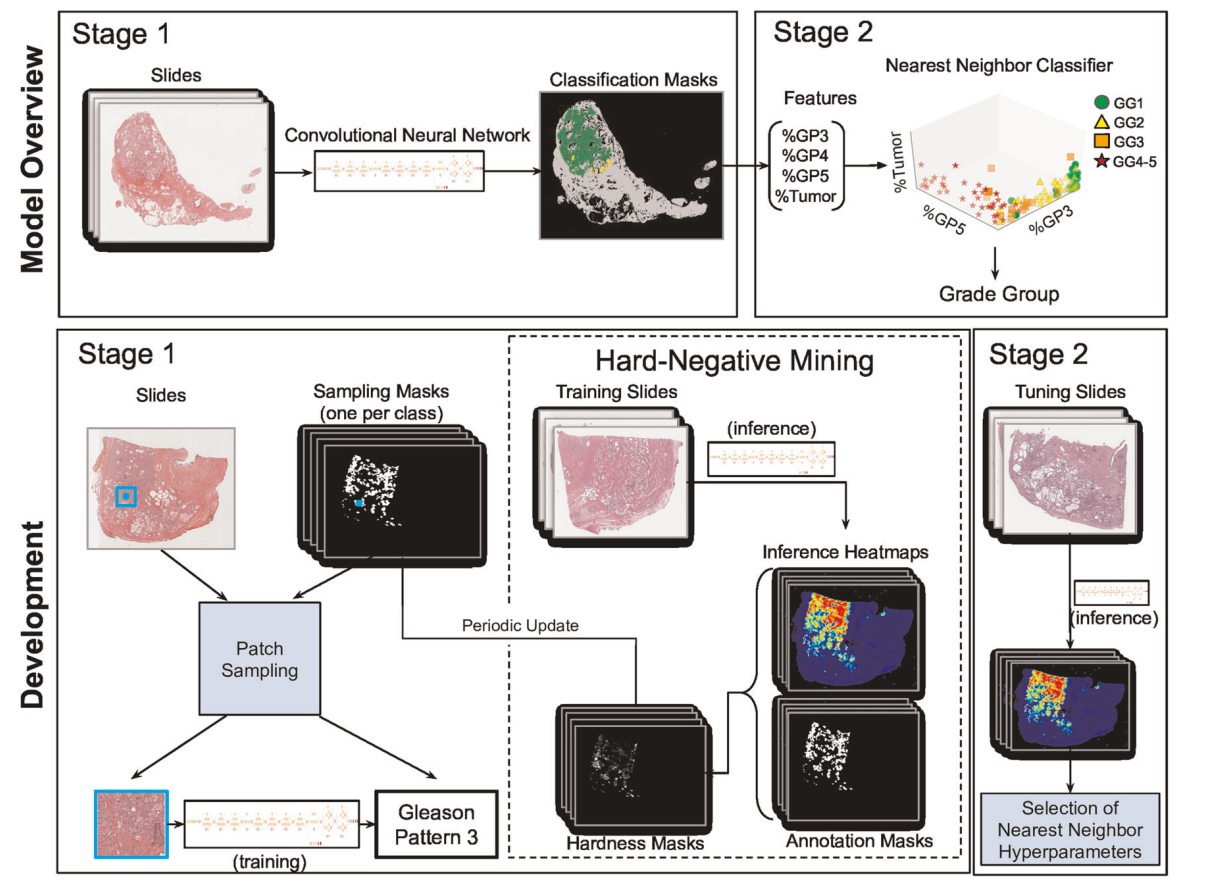
첫번째 과정은, pathologist 의 pixel-level annotation 을 기반의 지도학습으로 학습되었고, 총 912 장의 슬라이드로부터 112,000,000 장의 patch 가 사용되었다. validation set 은 3 source 로부터 331 patient 의 331 slide 가 이용되었다. (TCGA, Tertiary teaching hospital, Medical laboratory)
Comparision of DLS to pathologists on whole-slide Gleason scoring
Validation dataset 에 대하여, 두 그룹의 리뷰 (예측) 을 비교하였다.
- 29 pathologists in classifying each slide's Gleason Grade Group
- Deep learning system (DLS) performance
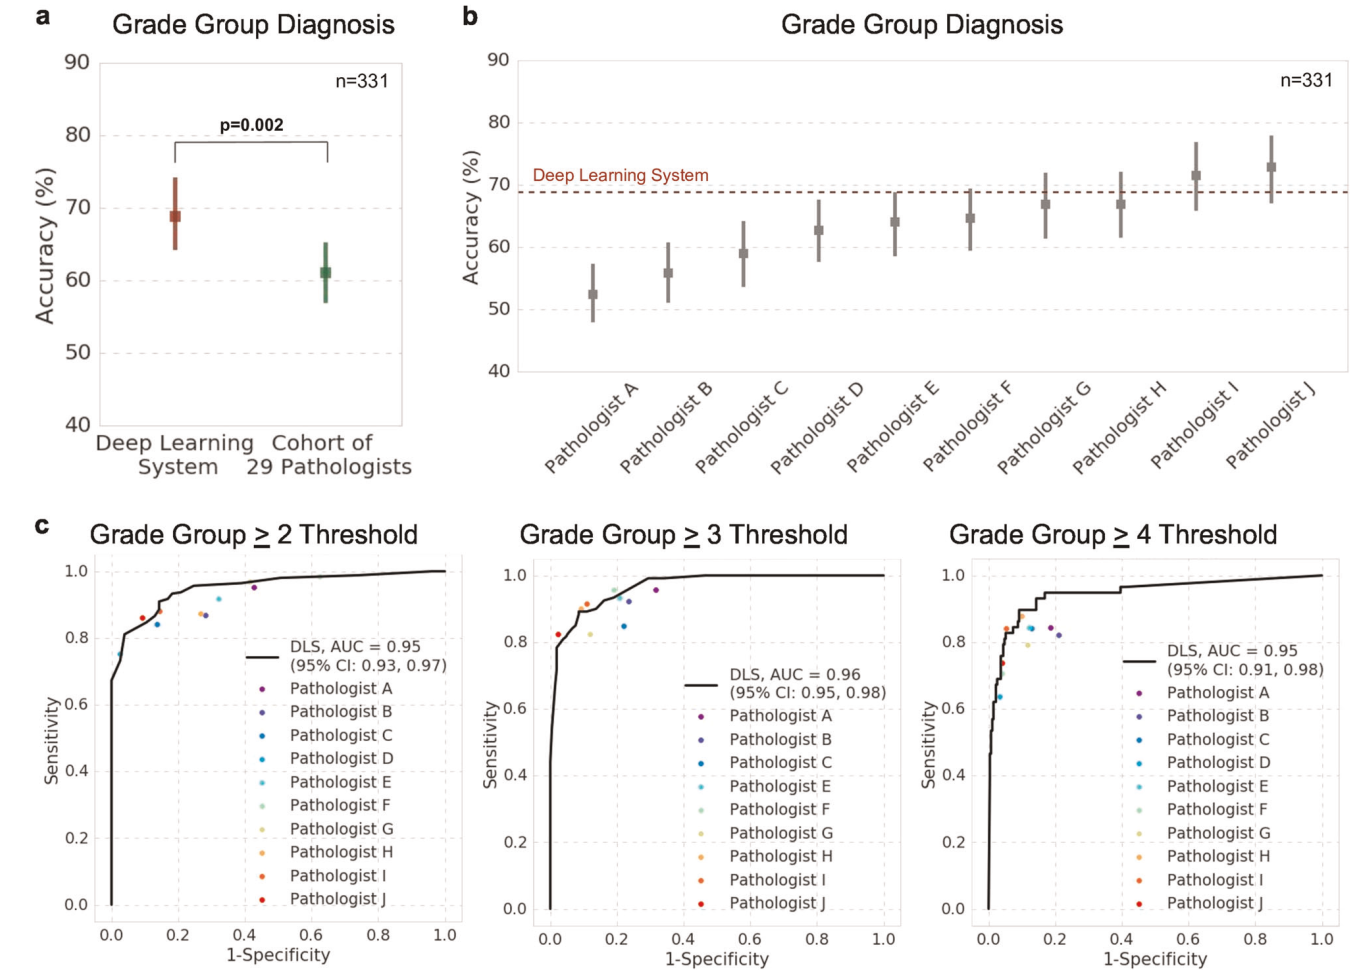
a 결과 DLS 0.7 acc > pathologist 0.61 acc 였다.
b 10명의 subgroup 을 뽑아, 각각 DLS 와 비교한 결과, 8명의 pathologist 가 DLS 보다 낮은 성능을 보였다.
추가로, GG >= 2, 3, 4 에 대해 decision threshold 를 관찰했다. DLS 는 AUC 값 0.95-0.96 을 보였고, 특히 Grade group >= 4 에서 10명의 pathologist 중 9명의 pathologist 보다 좋은 성능을 보였다.
Comparison of DLS to pathologists on GLeason pattern quantitation
ISUP와 CAP, WHO, recent publication 에서 권장되는 방법은 각 패턴이 슬라이드에서 차지하는 정확한 비율이 중요하다. 예를 들어, 5% 가 넘는지에 따른 추가 rule 이 존재한다. 이를 확인하기 위해, 미리 얻었던 pathologist의 pixel-level annotation 과 DLS score 를 비교하였다.
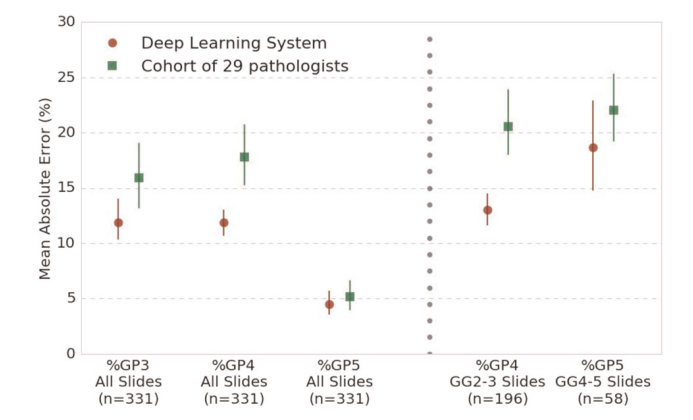
결과 GP5 의 비율에서는 근소한 차이를 보였으나, GP3, 4 에서는 significant 한 accuracy 차이를 보여주었다. 또한, 5% rule에 따라 grade group 이 바뀔 수 있는 일부 슬라이드만 subgroup 해서 같은 분석을 진행하였고, 이 validation set 에서도 acc 차이를 보였다.
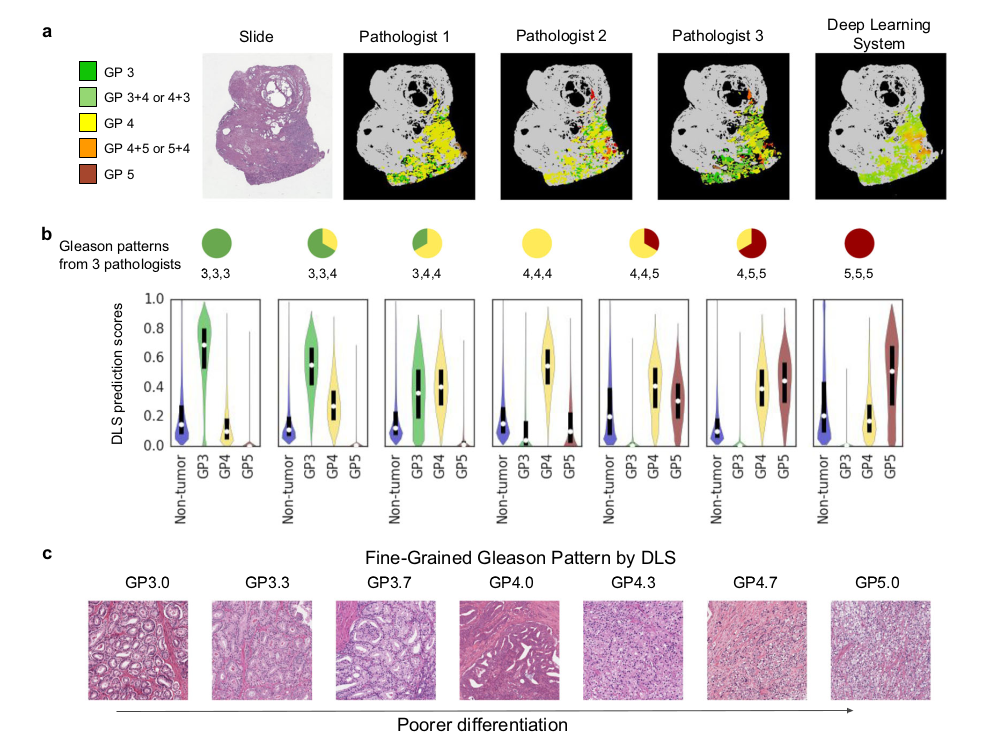
Insights from DLS region-level classifications
region-level classification of DLS 를 평가하기 위해 3명의 pathologist의 79장 슬라이드 annotation 과 DLS prediction 결과를 다각도로 분석하였다. DLS는 97%, 3 pathologist 는 88% concur 하였다.
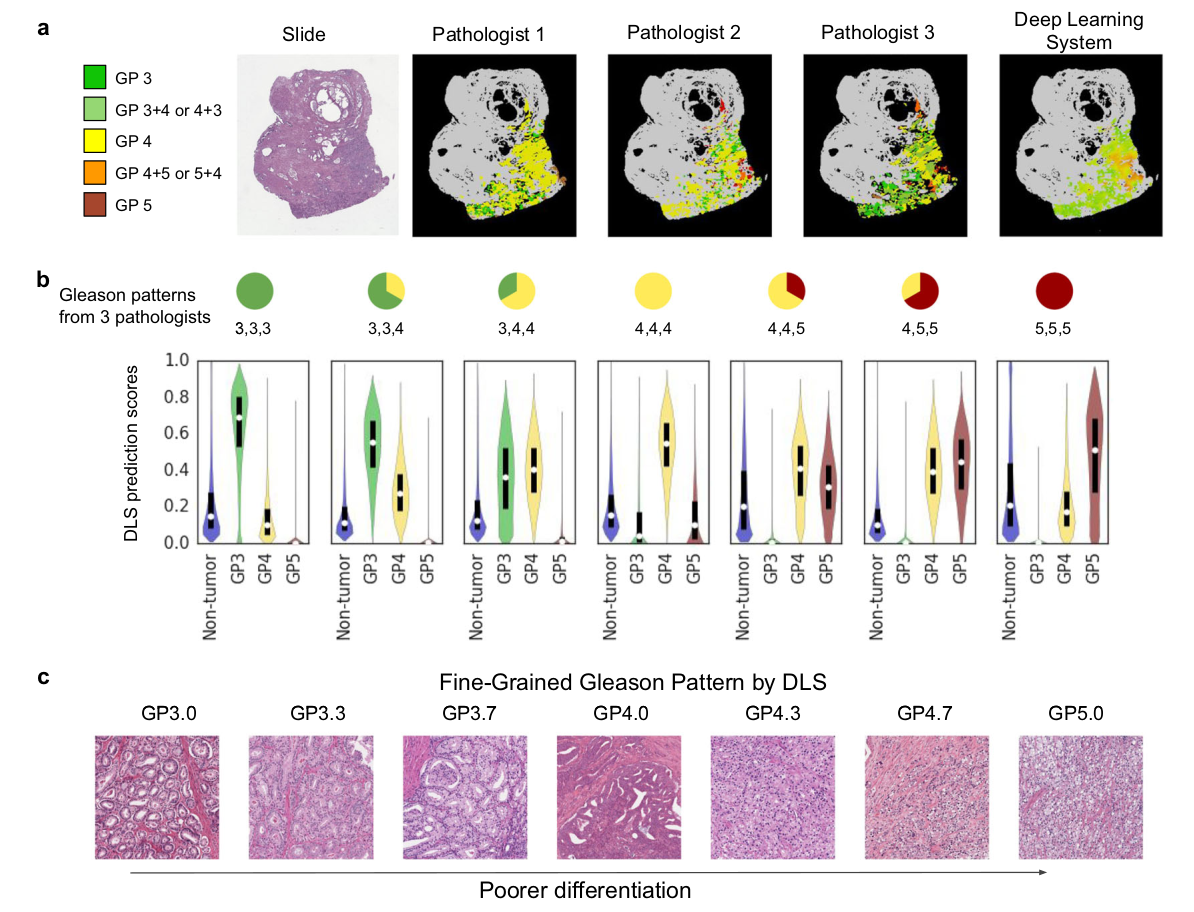
b 에서 DLS 의 confidence score (각 패턴 별 probability) 를 as a function of inter-pathologist aggreement 에 따라 나타내었다. pathologist 가 Gleason pattern 3 에서 concordant, gleason pattern 3과 4 사이에서 disconcordant, concordant on GP4 했던 tissue region 에 대해서, DLS의 prediction score 결과는 smooth 하게 바뀌었다. 즉 confidence score 가, pathologist 의 scoring 과정 중 ambiguous 했던 부분까지 반영했다는 것을 암시한다. 이러한 trend 가 3-4 뿐만 아니라 4-5 pattern 에서도 관찰되었다.
이를 fine-grained Gleason patterns (3.3이나 3.7과 같은) 로 분류하여 보여준 결과, spectrum 상에 well-to-poor differentiation 을 확인할 수 있었다.
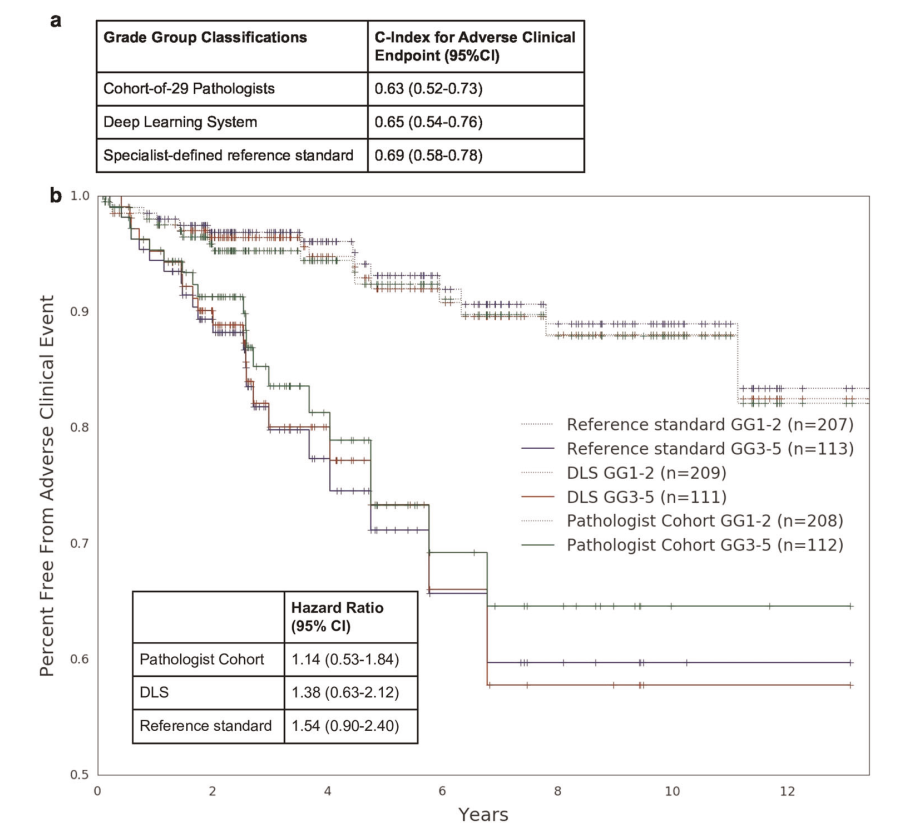
Measuring effectiveness of Gleason Scoring in risk stratification for disease progression
마지막으로 DLS 및 pathologist cohort 의 ability 를 확인하기 위해, 각 prediction 이 biochemical recurrence 또는 disease progression 이라는 이벤트에 대한 patient 의 위험도를, well-~ staratify 하는지 분석하였다.
c-index 상으로 확인했을 때, pathologist-provided grade group 은 in average c-index 0.63 을 기록했고, DLS-predicted grade group 은 in average c-index 0.65 를 기록하였다. Kaplan-Meier and hazard ratio analyses using a binary GG>=3 threshold 를 conduct 한 결과, 잘 나뉘는 것을 확인할 수 있었다.
추가 분석을 진행했고, 다음과 같은 결과를 관찰할 수 있었다.
- Cox model 을 써서 quantified Gleason patterns 의 prognostic ability 를 확인한 결과, DLS 0.697, 29 cohort 0.674 를 기록했다.
- Fine grained Gleason pattern 을 poc 하기 위해, GP3.5 를 추가하여 Cox model 로 확인한 결과, DLS 0.704, GP4.5 추가한 결과 0.702 로 향상.