esrally benchmark
현재 버전(8.17.4)과 새로 나온 버전(9.0.0)의 성능 테스트를 위한 rally 오픈 소스를 통해 benchmark를 실행할 수 있다.
개요
homebrew를 통해서pyenv설치pyenv설정 추가
echo 'export PYENV_ROOT="$HOME/.pyenv"' >> ~/.zshrc
echo 'export PATH="$PYENV_ROOT/bin:$PATH"' >> ~/.zshrc
echo 'eval "$(pyenv init --path)"' >> ~/.zshrc
source ~/.zshrc
pyenv install 3.10.12파이썬 버전 설치pyenv virtualenv 3.10.12 rally-env를 통해서3.10.12버전의 파이썬을 기반으로rally-env라는 이름의 가상 환경 생성pyenv activate rally-env가상 환경 실행 (활성화)pyenv local 3.10.12를 통해 해당 폴더 에서 pyenc가 3.10.12 버전을 사용하도록 설정
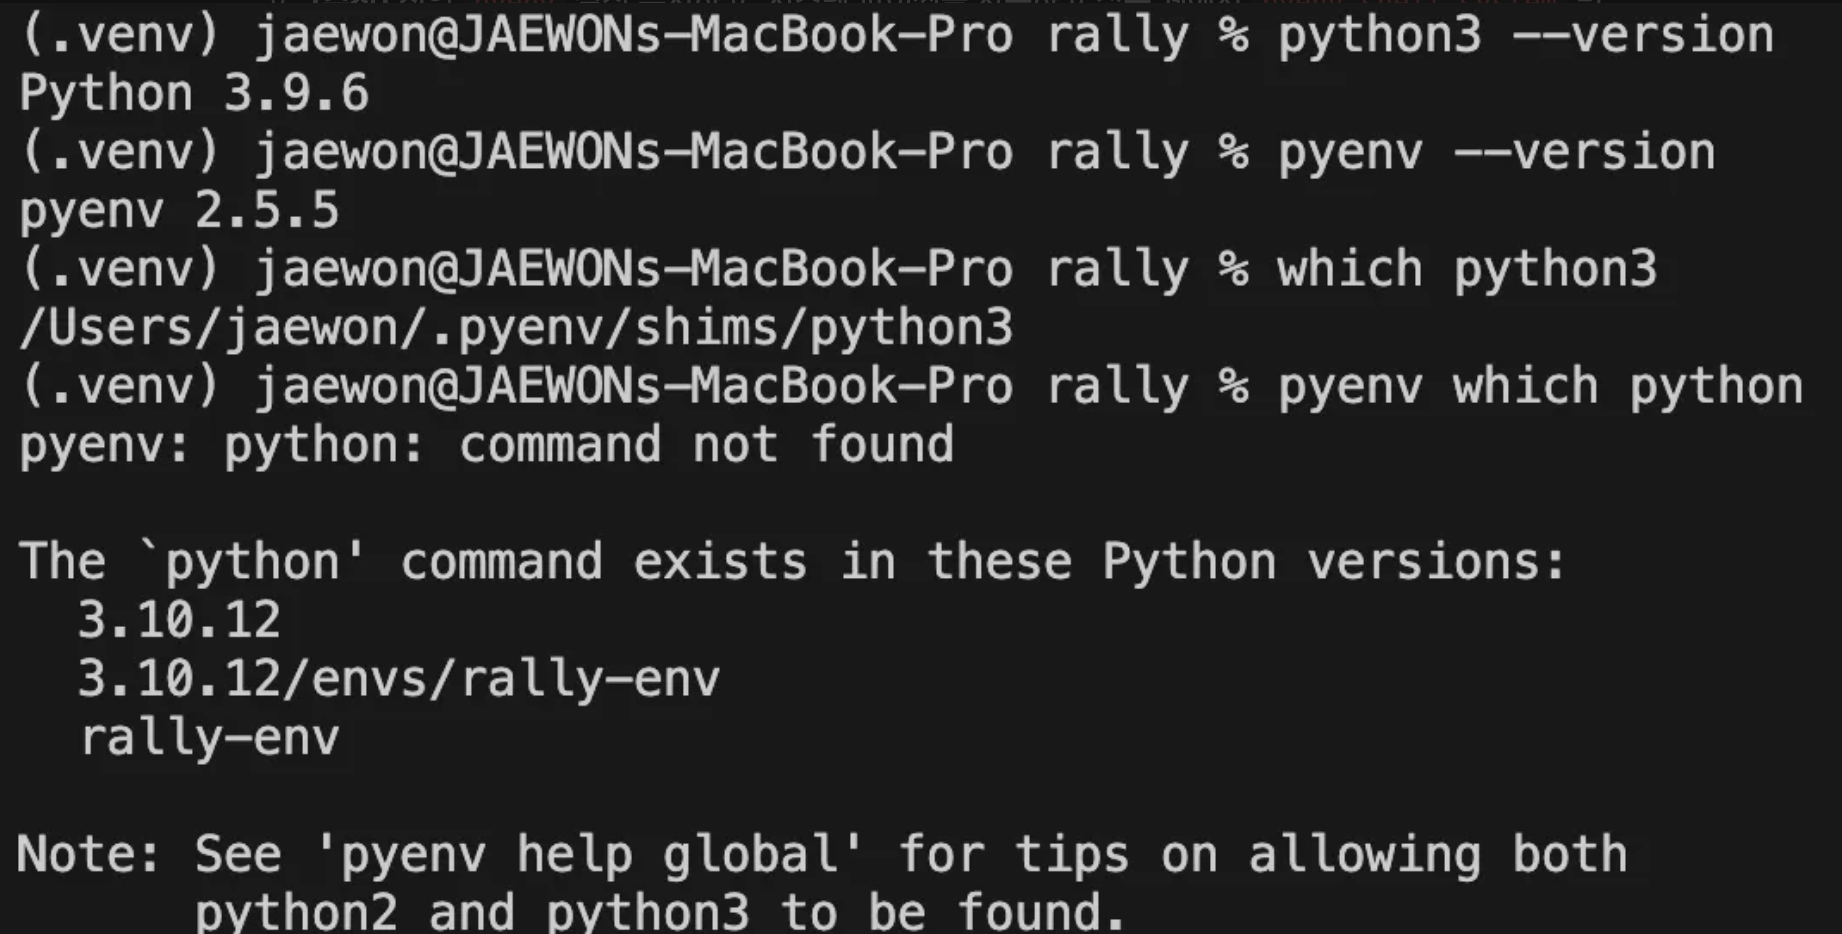
pyenv virtualenv 3.10.12 rally-env를 통해 프로젝트 폴더(rally)안에 파이썬 3.10.12 버전이 설치된것은 아님.- pyenv 전역 또는 로컬에 파이썬 3.10.12 버전이 설치된 것임(
ls /Users/jaewon/.pyenv/versions) - rally 프로젝트 폴더 안에 파이썬이 직접적으로 설치된 것은 아님. 가상환경은 논리적인 격리공간이며, 실제 파이썬 실행 파일은 pyenv 가 관리하는 특정 위치에 존재.
pyenv virtualenvs명령어를 통해 pyenv가 관리하는 모든 가상 환경의 목록을 보여줌
jaewon@JAEWONs-MacBook-Pro rally % pyenv virtualenvs

  3.10.12/envs/rally-env (created from /Users/jaewon/.pyenv/versions/3.10.12)
  rally-env (created from /Users/jaewon/.pyenv/versions/3.10.12)
pyenv 설치
- 다양한 버전의 파이썬을 관리하는 도구. 시스템에 여러 버전의 파이썬을 설치하고, 프로젝트별로 사용할 파이썬 버전을 전역적 또는 로컬하게 설정
- 공식 파이썬 배포판(CPython), Anaconda, PyPy 등 다양한 파이썬 구현체 및 특정 버전을 쉽게 설치
- 시스템 전체 또는 특정 프로젝트 디렉토리에서 사용할 파이썬 버전을 지정할 수 있음. python-version 파일을 통해 프로젝트별 설정을 관리
- 시스템 레벨에서 여러 파이썬 버전을 관리하며, 프로젝트별로 사용할 파이썬 버전을 선택하는 데 관여
.venv와의 관계 :pyenv를 통해 원하는 파이썬 버전을 설치한 후, 해당 파이썬 버전을 기반으로 .venv가상환경을 생성하는 것이 일반적인 워크플로우pyenv virtualenv 3.10.12 rally-envpyenv 를 사용하여 새로운 가상 환경을 생성virtualenv는pyenv****의 하위 명령어로, 가상 환경을 생성하고 관리하는 기능 수행
요약
rally폴더에서만 3.10.12 버전 사용:cd rally후pyenv local 3.10.12- 전역에서 시스템 파이썬 사용 (
which python3가 시스템 파이썬 가리키도록):- (비추천) 쉘 설정 파일에서
pyenv관련 설정 제거 (전역pyenv기능 상실) - (추천) 전역
pyenv설정 유지하고, 시스템 파이썬을 사용하고 싶은 쉘에서pyenv shell system명령어 실행 (임시적인 변경)
- (비추천) 쉘 설정 파일에서
- pyenv 를 사용하면 올바른 버전의 파이썬을 사용하는 데 드는 시간을 최소화하여, 프로젝트에 들이는 시간을 최대화
- 사용 상황
- 다양한 버전의 파이썬을 지원해야 하지만, 모든 버전을 쉽게 테스트 하는 방법을 확신하지 못할 때
- 다양한 버전의 파이썬을 지원해야 하지만, 모든 버전을 쉽게 테스트 하는 방법을 확신하지 못할 때
Rally benchmark 성능 테스트
vs code 에서 폴더(rally)에서 pyenv를 사용하여 rally-env 가상환경을 만들어 주었고, python3 3.10.12 버전을 사용한다.
Python 3.10.12
esrally 2.12.0
Rally 설정
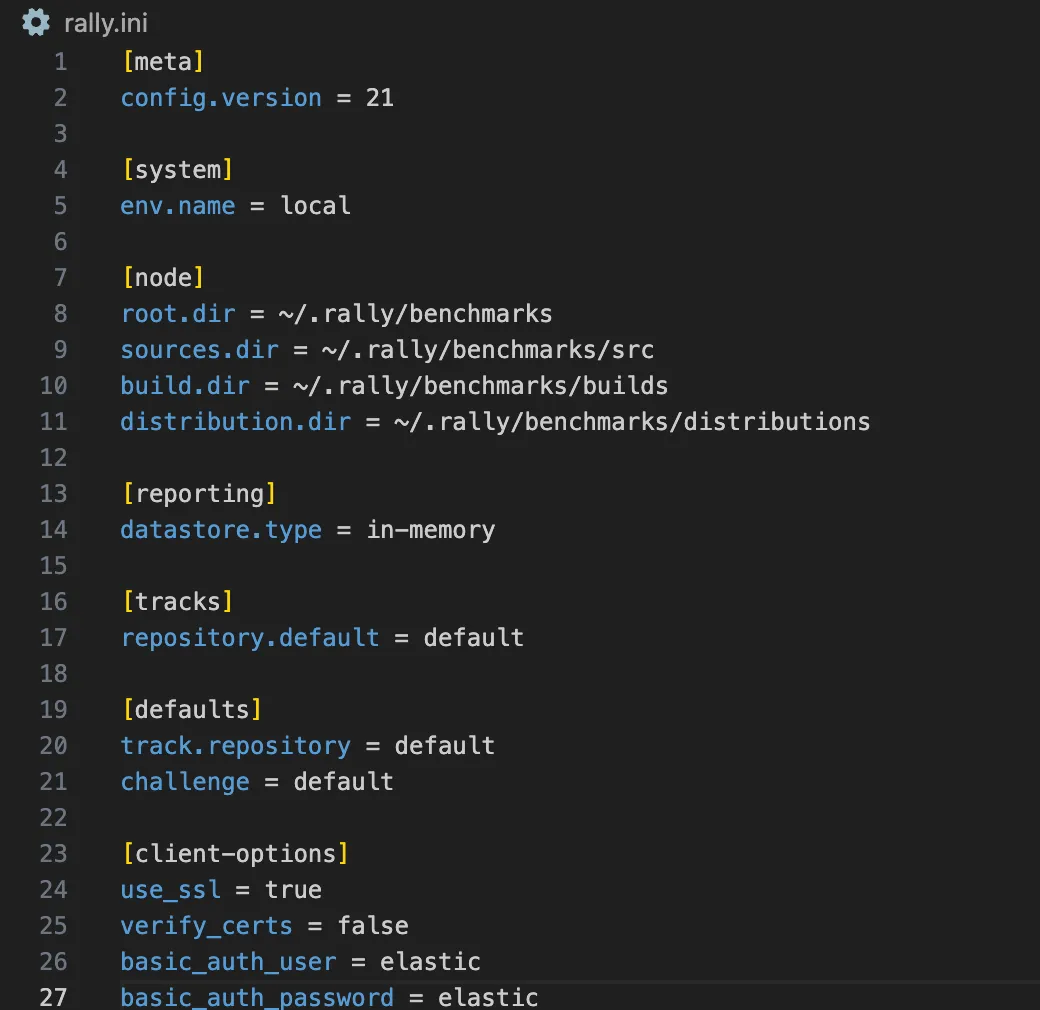
최신 버전에서는 esrally configure 명령어가 제거 되었기 때문에, rally.ini 파일을 수동으로 작성하거나, 피료시 esrally 명령어에 직접 —target-hosts, —pipline 등의 옵션을 넘겨주어야 한다.
- rally.ini (전반적인 환경 설정 관리)
# ~/.rally/rally.ini
[meta]
config.version = 21
[system]
env.name = local
[node]
root.dir = ~/.rally/benchmarks
sources.dir = ~/.rally/benchmarks/src
build.dir = ~/.rally/benchmarks/builds
distribution.dir = ~/.rally/benchmarks/distributions
[reporting]
datastore.type = in-memory
[tracks]
repository.default = default
[defaults]
track.repository = default
challenge = default
- **`—target-hosts`**
    - 런타임(실행 시) 정보가 아니라, Rally 의 환경 자체를 설명하는 역할
    - 테스트 할 대상만 바꿔서 실험할 수 있도록 유연하게 설계. 8.17.4 → 9.0.0 매번 변경
    - 테스트할 대상 클러스터만 지정.런타임에 옵션으로 직접 넘겨줌
    ```bash
    esrally race --track=nyc_taxis --target-hosts=192.168.219.159:9200 --pipeline=benchmark-only
    ```


## Cluster 실행 확인
> 159 서버에서 현재 elasticsearch 가 실행중이어야 함


## 성능 테스트 진행 (8.17.4 버전)
> 벤치마크용 데이터셋 + 쿼리 시나리오를 미리 만들어 놓은 것. Rally 가 제공하는 실제 사용 케이스 기반 테스트 환경. 트랙에는 **어떤 데이터를 / 어떤 쿼리로 / 몇 개의 샤드&레플리카로** 구성해서 자동 테스트할 지 정보가 담겨 있음.

### 트랙 목록 확인
```bash
esrally list tracks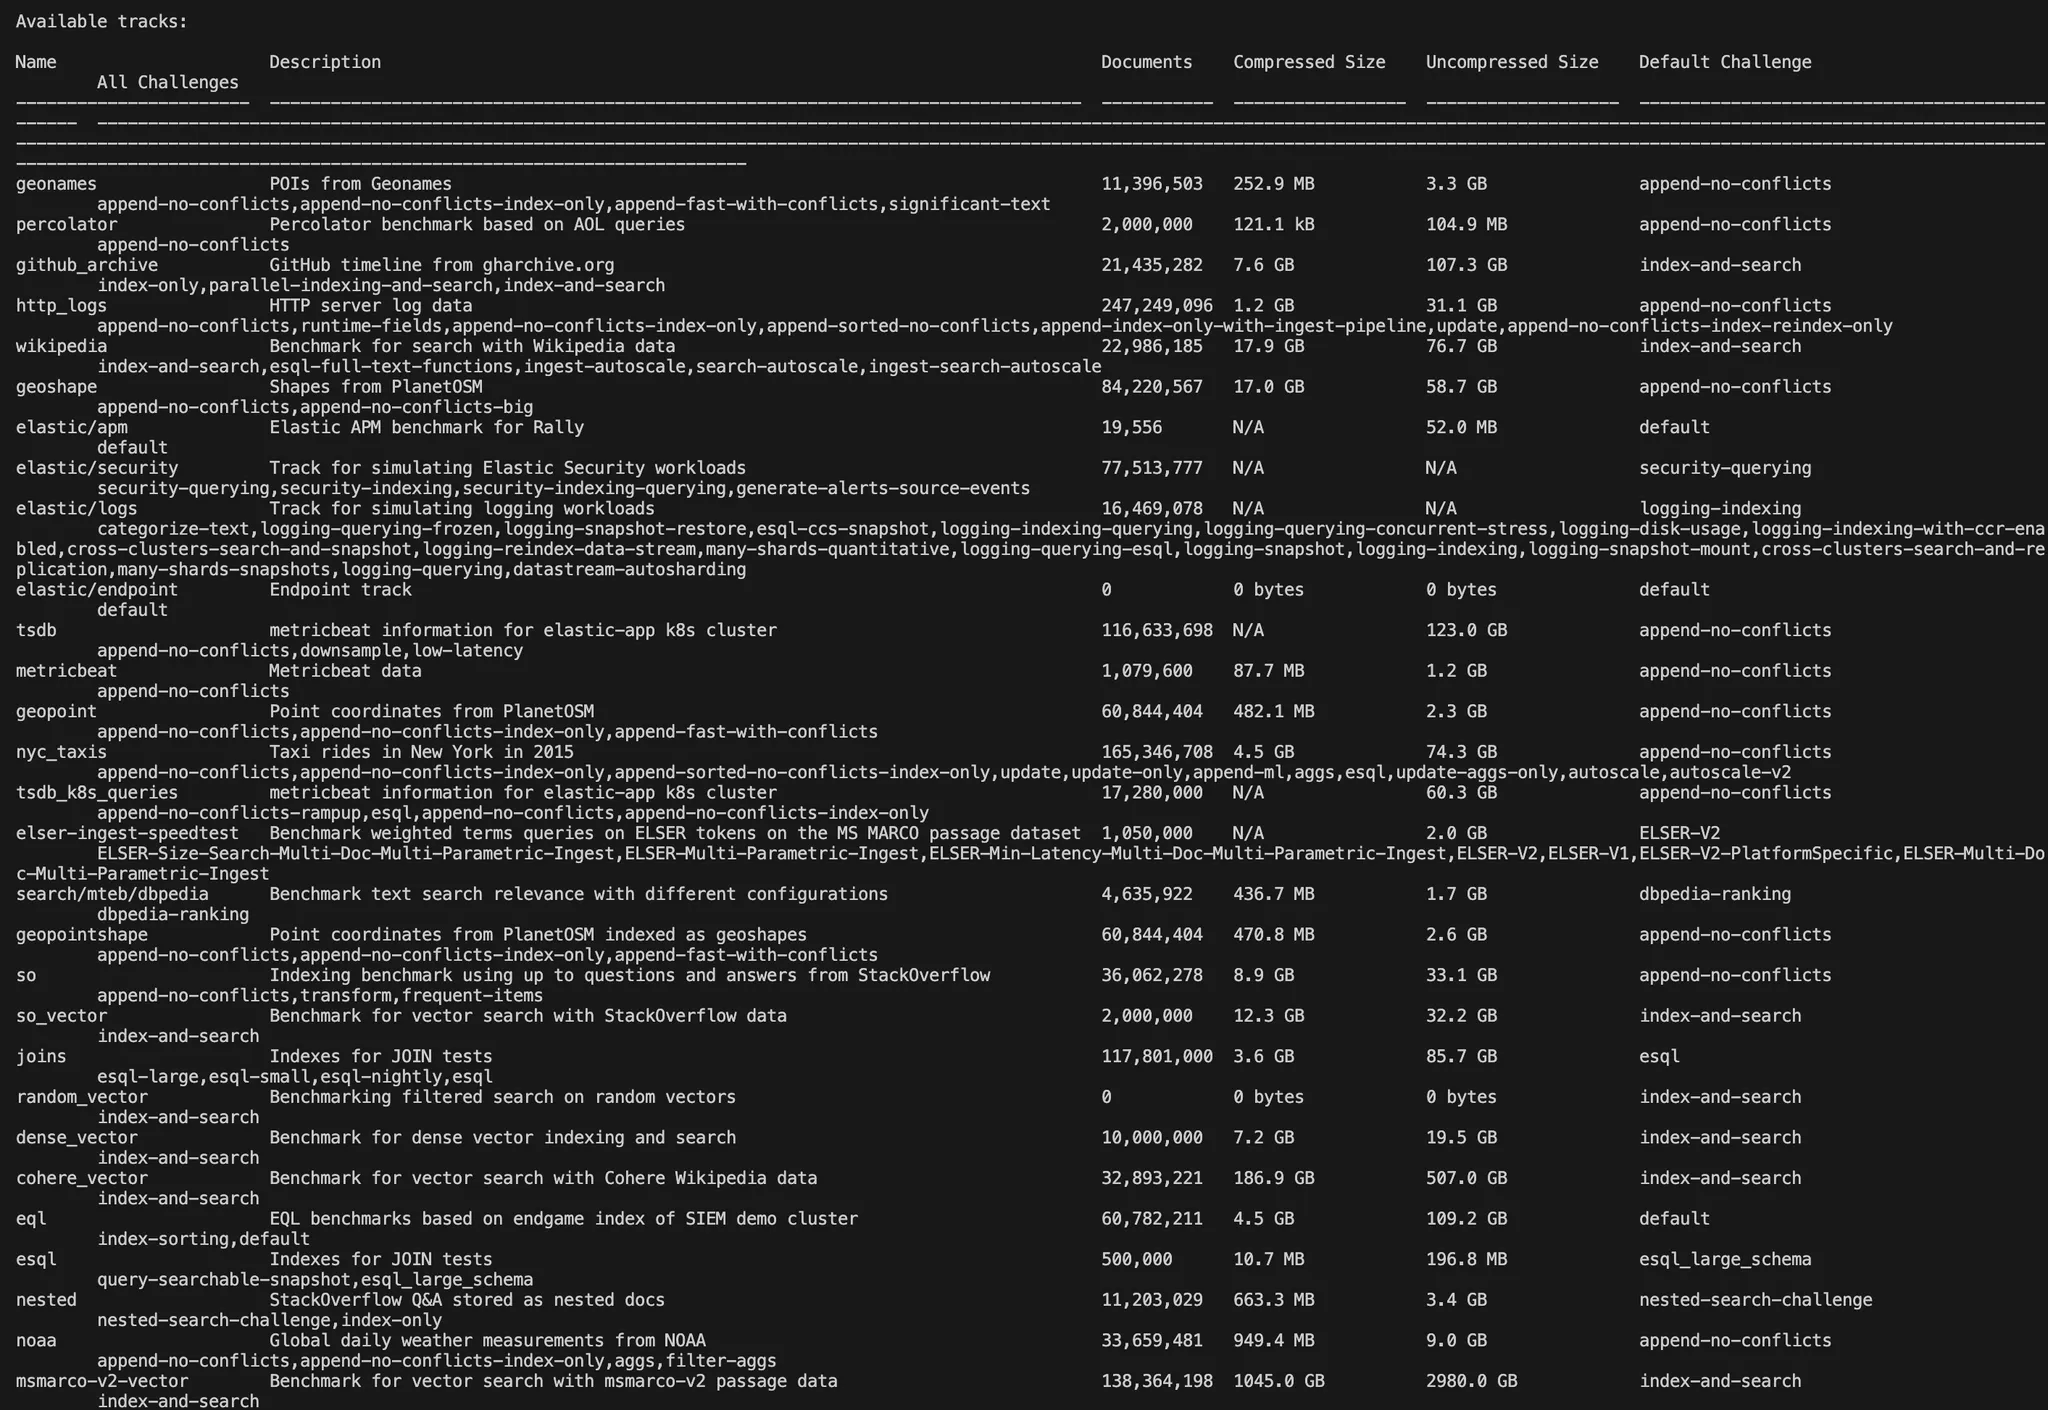
[INFO] SUCCESS (took 19 seconds)
원하는 트랙 선택해서 실행
- 인덱싱 처리량 + 검색 쿼리 성능 테스트
nyc_taxis: 뉴욕 택시 승하차 데이터(검색+인덱싱) / 74.3GB / 인덱싱+검색+aggswikipedia: 위키피디아 문서 검색 / 76.7GB / full-text search 중심, query-heavyhttp_logs: 서버 로그 인덱싱(append-heavy) / 31.1GB / 대량 로그 데이터geonames: POI 검색(경량 테스트용) / 3.3 GB / 빠른 인덱싱 + 검색 테스트, 소량
- Vector Search / Dense Vector 테스트
dense_vector: Dense vector indexing & search / 19.5GB / 벡터 필드 dense_vector 실험so_vector: StackOverflow vector search / 32.2GB / hybrid&semantic search 테스트
- Hybrid Search(BM25 & Vector or RRF 등)
msmarco-passage-ranking/ BM25 + semantic + hybrid search benchmark
⚠️주의
현재 서버(159)에서는 https만 열려있고 인증(username/password)이 필수인 상황. https:// 사용하기 위해 TLS/SSL 인증서를 확인하려고 하는데, 인증서가 CA에 의해 서명된 것이 아니고, 자체 서명(self-signed) 된 인증서이기 때문에 Rally → Elasticsearch 통신 시 SSL 검증 실패(CERTIFICATE_VERIFY_FAILED)
- 인증(basic_auth_user, basic_auth_password) 필요
- SSL 인증서 검증은 하지 않음(verify_certs:false) → 테스트 환경에서 ok
- rally.ini 에 미리 설정(client-options)해두면 매번 명령어에 넣지 않아도 됨
- client-options 설정 안할 시
esrally race --track=nyc_taxis --target-hosts=https://192.168.219.159:9200 --pipeline=benchmark-only --client-options="use_ssl:true,verify_certs:false,basic_auth_user:'elastic',basic_auth_password:'elastic'"- client-options 설정 시
esrally race --track=nyc_taxis --target-hosts=https://192.168.219.159:9200 --pipeline=benchmark-only✅ 명령어에서 --client-options를 주면 ini보다 우선실행. 그래서 Rally가 ini 설정을 무시했을 수도 있음. 결국엔 client-options 쓰고 안 쓰고 상관 없이 인자로 넘겨주는것만 작동한다. 첫번째 명령어가 답!!
[dense_vector 트랙 테스트]
- Elasticsearch Rally의 nyc_taxis 트랙을 사용해서 진행한 dense vector (KNN search 포함) 벤치마크 결과
------------------------------------------------------
_______ __ _____
/ ____(_)___ ____ _/ / / ___/_________ ________
/ /_ / / __ \/ __ `/ / \__ \/ ___/ __ \/ ___/ _ \
/ __/ / / / / / /_/ / / ___/ / /__/ /_/ / / / __/
/_/ /_/_/ /_/\__,_/_/ /____/\___/\____/_/ \___/
------------------------------------------------------
| Metric | Task | Value | Unit |
|---------------------------------------------------------------:|---------------------------------------------:|-----------------:|-------:|
| Cumulative indexing time of primary shards | | 34.7009 | min |
| Min cumulative indexing time across primary shards | | 0 | min |
| Median cumulative indexing time across primary shards | | 0 | min |
| Max cumulative indexing time across primary shards | | 17.995 | min |
| Cumulative indexing throttle time of primary shards | | 0 | min |
| Min cumulative indexing throttle time across primary shards | | 0 | min |
| Median cumulative indexing throttle time across primary shards | | 0 | min |
| Max cumulative indexing throttle time across primary shards | | 0 | min |
| Cumulative merge time of primary shards | | 47.5129 | min |
| Cumulative merge count of primary shards | | 62 | |
| Min cumulative merge time across primary shards | | 0 | min |
| Median cumulative merge time across primary shards | | 0 | min |
| Max cumulative merge time across primary shards | | 16.406 | min |
| Cumulative merge throttle time of primary shards | | 10.1759 | min |
| Min cumulative merge throttle time across primary shards | | 0 | min |
| Median cumulative merge throttle time across primary shards | | 0 | min |
| Max cumulative merge throttle time across primary shards | | 9.25237 | min |
| Cumulative refresh time of primary shards | | 0.54595 | min |
| Cumulative refresh count of primary shards | | 1520 | |
| Min cumulative refresh time across primary shards | | 0 | min |
| Median cumulative refresh time across primary shards | | 0 | min |
| Max cumulative refresh time across primary shards | | 0.2769 | min |
| Cumulative flush time of primary shards | | 4.09032 | min |
| Cumulative flush count of primary shards | | 556 | |
| Min cumulative flush time across primary shards | | 0 | min |
| Median cumulative flush time across primary shards | | 6.66667e-05 | min |
| Max cumulative flush time across primary shards | | 3.47187 | min |
| Total Young Gen GC time | | 26.172 | s |
| Total Young Gen GC count | | 300 | |
| Total Old Gen GC time | | 0 | s |
| Total Old Gen GC count | | 0 | |
| Dataset size | | 38.2582 | GB |
| Store size | | 38.2582 | GB |
| Translog size | | 2.40747e-06 | GB |
| Heap used for segments | | 0 | MB |
| Heap used for doc values | | 0 | MB |
| Heap used for terms | | 0 | MB |
| Heap used for norms | | 0 | MB |
| Heap used for points | | 0 | MB |
| Heap used for stored fields | | 0 | MB |
| Segment count | | 153 | |
| Total Ingest Pipeline count | | 0 | |
| Total Ingest Pipeline time | | 0 | s |
| Total Ingest Pipeline failed | | 0 | |
| Min Throughput | index-append | 1474.24 | docs/s |
| Mean Throughput | index-append | 1994.9 | docs/s |
| Median Throughput | index-append | 2042.34 | docs/s |
| Max Throughput | index-append | 2471.5 | docs/s |
| 50th percentile latency | index-append | 2077.09 | ms |
| 90th percentile latency | index-append | 2954.61 | ms |
| 99th percentile latency | index-append | 6684.82 | ms |
| 100th percentile latency | index-append | 8332.53 | ms |
| 50th percentile service time | index-append | 2077.09 | ms |
| 90th percentile service time | index-append | 2954.61 | ms |
| 99th percentile service time | index-append | 6684.82 | ms |
| 100th percentile service time | index-append | 8332.53 | ms |
| error rate | index-append | 0 | % |
| Min Throughput | refresh-after-index | 7.64 | ops/s |
| Mean Throughput | refresh-after-index | 7.64 | ops/s |
| Median Throughput | refresh-after-index | 7.64 | ops/s |
| Max Throughput | refresh-after-index | 7.64 | ops/s |
| 100th percentile latency | refresh-after-index | 129.67 | ms |
| 100th percentile service time | refresh-after-index | 129.67 | ms |
| error rate | refresh-after-index | 0 | % |
| Min Throughput | index-update-concurrent-with-searches | 2902.4 | docs/s |
| Mean Throughput | index-update-concurrent-with-searches | 3101.46 | docs/s |
| Median Throughput | index-update-concurrent-with-searches | 3057.32 | docs/s |
| Max Throughput | index-update-concurrent-with-searches | 3551.85 | docs/s |
| 50th percentile latency | index-update-concurrent-with-searches | 1710.44 | ms |
| 90th percentile latency | index-update-concurrent-with-searches | 2129.31 | ms |
| 100th percentile latency | index-update-concurrent-with-searches | 3180.33 | ms |
| 50th percentile service time | index-update-concurrent-with-searches | 1710.44 | ms |
| 90th percentile service time | index-update-concurrent-with-searches | 2129.31 | ms |
| 100th percentile service time | index-update-concurrent-with-searches | 3180.33 | ms |
| error rate | index-update-concurrent-with-searches | 0 | % |
| Min Throughput | knn-search-100-1000-concurrent-with-indexing | 10.81 | ops/s |
| Mean Throughput | knn-search-100-1000-concurrent-with-indexing | 12.92 | ops/s |
| Median Throughput | knn-search-100-1000-concurrent-with-indexing | 13.01 | ops/s |
| Max Throughput | knn-search-100-1000-concurrent-with-indexing | 13.32 | ops/s |
| 50th percentile latency | knn-search-100-1000-concurrent-with-indexing | 54.5488 | ms |
| 90th percentile latency | knn-search-100-1000-concurrent-with-indexing | 132.226 | ms |
| 99th percentile latency | knn-search-100-1000-concurrent-with-indexing | 368.523 | ms |
| 99.9th percentile latency | knn-search-100-1000-concurrent-with-indexing | 739.37 | ms |
| 100th percentile latency | knn-search-100-1000-concurrent-with-indexing | 1229.45 | ms |
| 50th percentile service time | knn-search-100-1000-concurrent-with-indexing | 54.5488 | ms |
| 90th percentile service time | knn-search-100-1000-concurrent-with-indexing | 132.226 | ms |
| 99th percentile service time | knn-search-100-1000-concurrent-with-indexing | 368.523 | ms |
| 99.9th percentile service time | knn-search-100-1000-concurrent-with-indexing | 739.37 | ms |
| 100th percentile service time | knn-search-100-1000-concurrent-with-indexing | 1229.45 | ms |
| error rate | knn-search-100-1000-concurrent-with-indexing | 0 | % |
| Min Throughput | refresh-after-update | 18.02 | ops/s |
| Mean Throughput | refresh-after-update | 18.02 | ops/s |
| Median Throughput | refresh-after-update | 18.02 | ops/s |
| Max Throughput | refresh-after-update | 18.02 | ops/s |
| 100th percentile latency | refresh-after-update | 53.678 | ms |
| 100th percentile service time | refresh-after-update | 53.678 | ms |
| error rate | refresh-after-update | 0 | % |
| Min Throughput | knn-search-10-100_multiple_segments | 28.41 | ops/s |
| Mean Throughput | knn-search-10-100_multiple_segments | 36.11 | ops/s |
| Median Throughput | knn-search-10-100_multiple_segments | 36.98 | ops/s |
| Max Throughput | knn-search-10-100_multiple_segments | 38.31 | ops/s |
| 50th percentile latency | knn-search-10-100_multiple_segments | 17.5961 | ms |
| 90th percentile latency | knn-search-10-100_multiple_segments | 25.4179 | ms |
| 99th percentile latency | knn-search-10-100_multiple_segments | 316.969 | ms |
| 99.9th percentile latency | knn-search-10-100_multiple_segments | 345.932 | ms |
| 100th percentile latency | knn-search-10-100_multiple_segments | 387.85 | ms |
| 50th percentile service time | knn-search-10-100_multiple_segments | 17.5961 | ms |
| 90th percentile service time | knn-search-10-100_multiple_segments | 25.4179 | ms |
| 99th percentile service time | knn-search-10-100_multiple_segments | 316.969 | ms |
| 99.9th percentile service time | knn-search-10-100_multiple_segments | 345.932 | ms |
| 100th percentile service time | knn-search-10-100_multiple_segments | 387.85 | ms |
| error rate | knn-search-10-100_multiple_segments | 0 | % |
| Min Throughput | knn-search-100-1000_multiple_segments | 23.56 | ops/s |
| Mean Throughput | knn-search-100-1000_multiple_segments | 25.99 | ops/s |
| Median Throughput | knn-search-100-1000_multiple_segments | 26.21 | ops/s |
| Max Throughput | knn-search-100-1000_multiple_segments | 27.6 | ops/s |
| 50th percentile latency | knn-search-100-1000_multiple_segments | 29.6561 | ms |
| 90th percentile latency | knn-search-100-1000_multiple_segments | 43.257 | ms |
| 99th percentile latency | knn-search-100-1000_multiple_segments | 342.285 | ms |
| 99.9th percentile latency | knn-search-100-1000_multiple_segments | 484.284 | ms |
| 100th percentile latency | knn-search-100-1000_multiple_segments | 588.48 | ms |
| 50th percentile service time | knn-search-100-1000_multiple_segments | 29.6561 | ms |
| 90th percentile service time | knn-search-100-1000_multiple_segments | 43.257 | ms |
| 99th percentile service time | knn-search-100-1000_multiple_segments | 342.285 | ms |
| 99.9th percentile service time | knn-search-100-1000_multiple_segments | 484.284 | ms |
| 100th percentile service time | knn-search-100-1000_multiple_segments | 588.48 | ms |
| error rate | knn-search-100-1000_multiple_segments | 0 | % |
| Min Throughput | force-merge | 0 | ops/s |
| Mean Throughput | force-merge | 0 | ops/s |
| Median Throughput | force-merge | 0 | ops/s |
| Max Throughput | force-merge | 0 | ops/s |
| 100th percentile latency | force-merge | 357184 | ms |
| 100th percentile service time | force-merge | 357184 | ms |
| error rate | force-merge | 0 | % |
| Min Throughput | knn-search-10-100 | 24.01 | ops/s |
| Mean Throughput | knn-search-10-100 | 30.07 | ops/s |
| Median Throughput | knn-search-10-100 | 30.17 | ops/s |
| Max Throughput | knn-search-10-100 | 33.76 | ops/s |
| 50th percentile latency | knn-search-10-100 | 14.9129 | ms |
| 90th percentile latency | knn-search-10-100 | 27.0525 | ms |
| 99th percentile latency | knn-search-10-100 | 347.794 | ms |
| 99.9th percentile latency | knn-search-10-100 | 564.353 | ms |
| 100th percentile latency | knn-search-10-100 | 653.526 | ms |
| 50th percentile service time | knn-search-10-100 | 14.9129 | ms |
| 90th percentile service time | knn-search-10-100 | 27.0525 | ms |
| 99th percentile service time | knn-search-10-100 | 347.794 | ms |
| 99.9th percentile service time | knn-search-10-100 | 564.353 | ms |
| 100th percentile service time | knn-search-10-100 | 653.526 | ms |
| error rate | knn-search-10-100 | 0 | % |
| Min Throughput | knn-search-100-1000 | 28.22 | ops/s |
| Mean Throughput | knn-search-100-1000 | 30.75 | ops/s |
| Median Throughput | knn-search-100-1000 | 31 | ops/s |
| Max Throughput | knn-search-100-1000 | 32.8 | ops/s |
| 50th percentile latency | knn-search-100-1000 | 21.5127 | ms |
| 90th percentile latency | knn-search-100-1000 | 31.7156 | ms |
| 99th percentile latency | knn-search-100-1000 | 327.866 | ms |
| 99.9th percentile latency | knn-search-100-1000 | 370.056 | ms |
| 100th percentile latency | knn-search-100-1000 | 384.448 | ms |
| 50th percentile service time | knn-search-100-1000 | 21.5127 | ms |
| 90th percentile service time | knn-search-100-1000 | 31.7156 | ms |
| 99th percentile service time | knn-search-100-1000 | 327.866 | ms |
| 99.9th percentile service time | knn-search-100-1000 | 370.056 | ms |
| 100th percentile service time | knn-search-100-1000 | 384.448 | ms |
| error rate | knn-search-100-1000 | 0 | % |
| Min Throughput | script-score-query | 4.14 | ops/s |
| Mean Throughput | script-score-query | 4.99 | ops/s |
| Median Throughput | script-score-query | 5.08 | ops/s |
| Max Throughput | script-score-query | 5.19 | ops/s |
| 50th percentile latency | script-score-query | 162.976 | ms |
| 90th percentile latency | script-score-query | 233.412 | ms |
| 99th percentile latency | script-score-query | 503.213 | ms |
| 99.9th percentile latency | script-score-query | 770.299 | ms |
| 100th percentile latency | script-score-query | 857.939 | ms |
| 50th percentile service time | script-score-query | 162.976 | ms |
| 90th percentile service time | script-score-query | 233.412 | ms |
| 99th percentile service time | script-score-query | 503.213 | ms |
| 99.9th percentile service time | script-score-query | 770.299 | ms |
| 100th percentile service time | script-score-query | 857.939 | ms |
| error rate | script-score-query | 0 | % |
----------------------------------
[INFO] SUCCESS (took 4170 seconds)
----------------------------------- ndexing Performance
- Mean throughput이 1994.9 docs/sec (초당 약 2000개 문서가 성공적으로 인덱싱 됨)
- 50th percentile (median latency) 2077ms (절반의 인덱싱 작업이 약 2초 안에 완료)
- 99th percentile latency (일부 작업 느림, long tail)
- Merge, Refresh, Flush Performance
- Merge throttle time (병합 작업이나 디스크 IO나 CPU 자원 때문에 속도가 제한된 구간이 있었음)
- Refresh 1520 times, Flush 556 times
- Garbage Collection
- Old Gen GC = 0 ( Memory no problem, good sign)
- Dataset & Storage
- Dataset size: 38.25GB → (대규모 인덱싱 시나리오)
- Segment count: 153 → 세그먼트가 많으면 검색 성능 저하 기능(적절한 merge 필요)
- Query Performance
- knn-search-100-1000 ( 평균 30 ops/sec 적당한 처리량)
- 50th percentile latency: 21.5ms (절반 이상의 KNN 검색 쿼리가 21ms 이하)
- knn-search-100-1000 ( 평균 30 ops/sec 적당한 처리량)
- Script Score Query (Script scoring)
- 5 ops/sec → Script Score는 KNN보다는 느림 (expected behavior)
- 50th percentile latency: 21.5ms (절반 이상의 KNN 검색 쿼리가 21ms 이하)
- Latency
- Index append (인덱싱):
- 50th percentile latency: 2초
- 99th percentile latency: 6.6초 → 느린 tail 구간 존재 (병목 가능)
- KNN Search:
- 평균 latency: 20~30ms (Good)
- 99th percentile latency: 300ms 이상 → 일부 느린 검색 구간 존재
- Index append (인덱싱):
요약
- 인덱싱 Throughput: 약 2000 docs/sec → 꽤 좋은 수치
- KNN Search Throughput: 30 ops/sec → 안정적
- 일부 인덱싱 작업에서 latency가 길어지는 구간이 있음 (merge throttle, long tail 존재)
GC는 문제 없음, Old GC zero → 메모리 관리 양호 - 검색 에러율 0%, 모든 시나리오 정상 수행 완료
실행되는 Rally 프로세스 존재
- Rally 는 동시에 한 번만 벤치마크를 실행할 수 있어서 다른 Rally 인스턴스가 살아있으면 막힘
- 백그라운드에서 Rally 프로세스가 남아 있는 경우
✅ 해결 방법 1 : 자동으로 프로세스 강제 종료esrally race --track=dense_vector \ --target-hosts=https://192.168.219.159:9200 \ --pipeline=benchmark-only \ --client-options="use_ssl:true,verify_certs:false,basic_auth_user:'elastic',basic_auth_password:'elastic'" \ --kill-running-processes✅ 해결 방법 2 : 수동으로 확인 후 Kill
ps -ef| grep esrally
성능 테스트 진행 (9.0.0 버전)
159 서버에서 기존 프로젝트 진행으로 인한 디스크 용량 문제로 인해, 157 서버에서 9.0.0 버전을 설치 후 진행.
트랙 목록 확인
이전 8.17.4 트랙목록 확인과 동일
원하는 트랙 선택 실행
- 8.17.4버전(159서버) 에서
dense_vector에 대한 테스트를 진행. - 9.0.0버전(157서버) 에서 역시
dense_vector에 대한 테스트 진행. dense_vector: Dense vector indexing & search / 19.5GB / 벡터 필드 dense_vector 실험
esrally race --track=dense_vector --target-hosts=https://192.168.219.157:9200 --pipeline=benchmark-only --client-options="use_ssl:true,verify_certs:false,basic_auth_user:elastic,basic_auth_password:elastic" --kill-running-processes[dense_vector 트랙 테스트]
- Elasticsearch Rally의 nyc_taxis 트랙을 사용해서 진행한 dense vector (KNN search 포함) 벤치마크 결과
------------------------------------------------------
_______ __ _____
/ ____(_)___ ____ _/ / / ___/_________ ________
/ /_ / / __ \/ __ `/ / \__ \/ ___/ __ \/ ___/ _ \
/ __/ / / / / / /_/ / / ___/ / /__/ /_/ / / / __/
/_/ /_/_/ /_/\__,_/_/ /____/\___/\____/_/ \___/
------------------------------------------------------
| Metric | Task | Value | Unit |
|---------------------------------------------------------------:|---------------------------------------------:|-----------------:|-------:|
| Cumulative indexing time of primary shards | | 20.5683 | min |
| Min cumulative indexing time across primary shards | | 10.2722 | min |
| Median cumulative indexing time across primary shards | | 10.2842 | min |
| Max cumulative indexing time across primary shards | | 10.2961 | min |
| Cumulative indexing throttle time of primary shards | | 0 | min |
| Min cumulative indexing throttle time across primary shards | | 0 | min |
| Median cumulative indexing throttle time across primary shards | | 0 | min |
| Max cumulative indexing throttle time across primary shards | | 0 | min |
| Cumulative merge time of primary shards | | 37.2185 | min |
| Cumulative merge count of primary shards | | 53 | |
| Min cumulative merge time across primary shards | | 18.3175 | min |
| Median cumulative merge time across primary shards | | 18.6092 | min |
| Max cumulative merge time across primary shards | | 18.901 | min |
| Cumulative merge throttle time of primary shards | | 0.79855 | min |
| Min cumulative merge throttle time across primary shards | | 0.373233 | min |
| Median cumulative merge throttle time across primary shards | | 0.399275 | min |
| Max cumulative merge throttle time across primary shards | | 0.425317 | min |
| Cumulative refresh time of primary shards | | 0.480433 | min |
| Cumulative refresh count of primary shards | | 530 | |
| Min cumulative refresh time across primary shards | | 0.221067 | min |
| Median cumulative refresh time across primary shards | | 0.240217 | min |
| Max cumulative refresh time across primary shards | | 0.259367 | min |
| Cumulative flush time of primary shards | | 0.415867 | min |
| Cumulative flush count of primary shards | | 40 | |
| Min cumulative flush time across primary shards | | 0.206633 | min |
| Median cumulative flush time across primary shards | | 0.207933 | min |
| Max cumulative flush time across primary shards | | 0.209233 | min |
| Total Young Gen GC time | | 10.651 | s |
| Total Young Gen GC count | | 97 | |
| Total Old Gen GC time | | 0 | s |
| Total Old Gen GC count | | 0 | |
| Dataset size | | 1.33342 | GB |
| Store size | | 1.33342 | GB |
| Translog size | | 1.02445e-07 | GB |
| Heap used for segments | | 0 | MB |
| Heap used for doc values | | 0 | MB |
| Heap used for terms | | 0 | MB |
| Heap used for norms | | 0 | MB |
| Heap used for points | | 0 | MB |
| Heap used for stored fields | | 0 | MB |
| Segment count | | 2 | |
| Total Ingest Pipeline count | | 0 | |
| Total Ingest Pipeline time | | 0 | s |
| Total Ingest Pipeline failed | | 0 | |
| Min Throughput | index-append | 2285.18 | docs/s |
| Mean Throughput | index-append | 2456.9 | docs/s |
| Median Throughput | index-append | 2413.82 | docs/s |
| Max Throughput | index-append | 2785.41 | docs/s |
| 50th percentile latency | index-append | 2135.43 | ms |
| 90th percentile latency | index-append | 2756.55 | ms |
| 99th percentile latency | index-append | 4511.9 | ms |
| 100th percentile latency | index-append | 7220.84 | ms |
| 50th percentile service time | index-append | 2135.43 | ms |
| 90th percentile service time | index-append | 2756.55 | ms |
| 99th percentile service time | index-append | 4511.9 | ms |
| 100th percentile service time | index-append | 7220.84 | ms |
| error rate | index-append | 0 | % |
| Min Throughput | refresh-after-index | 1.69 | ops/s |
| Mean Throughput | refresh-after-index | 1.69 | ops/s |
| Median Throughput | refresh-after-index | 1.69 | ops/s |
| Max Throughput | refresh-after-index | 1.69 | ops/s |
| 100th percentile latency | refresh-after-index | 591.272 | ms |
| 100th percentile service time | refresh-after-index | 591.272 | ms |
| error rate | refresh-after-index | 0 | % |
| Min Throughput | index-update-concurrent-with-searches | 1599.05 | docs/s |
| Mean Throughput | index-update-concurrent-with-searches | 1761.6 | docs/s |
| Median Throughput | index-update-concurrent-with-searches | 1766.36 | docs/s |
| Max Throughput | index-update-concurrent-with-searches | 1967.34 | docs/s |
| 50th percentile latency | index-update-concurrent-with-searches | 2620.98 | ms |
| 90th percentile latency | index-update-concurrent-with-searches | 3837.58 | ms |
| 100th percentile latency | index-update-concurrent-with-searches | 4803.82 | ms |
| 50th percentile service time | index-update-concurrent-with-searches | 2620.98 | ms |
| 90th percentile service time | index-update-concurrent-with-searches | 3837.58 | ms |
| 100th percentile service time | index-update-concurrent-with-searches | 4803.82 | ms |
| error rate | index-update-concurrent-with-searches | 0 | % |
| Min Throughput | knn-search-100-1000-concurrent-with-indexing | 4.91 | ops/s |
| Mean Throughput | knn-search-100-1000-concurrent-with-indexing | 5.86 | ops/s |
| Median Throughput | knn-search-100-1000-concurrent-with-indexing | 5.91 | ops/s |
| Max Throughput | knn-search-100-1000-concurrent-with-indexing | 6.38 | ops/s |
| 50th percentile latency | knn-search-100-1000-concurrent-with-indexing | 127.34 | ms |
| 90th percentile latency | knn-search-100-1000-concurrent-with-indexing | 294.263 | ms |
| 99th percentile latency | knn-search-100-1000-concurrent-with-indexing | 688.142 | ms |
| 99.9th percentile latency | knn-search-100-1000-concurrent-with-indexing | 1191.07 | ms |
| 100th percentile latency | knn-search-100-1000-concurrent-with-indexing | 1473.71 | ms |
| 50th percentile service time | knn-search-100-1000-concurrent-with-indexing | 127.34 | ms |
| 90th percentile service time | knn-search-100-1000-concurrent-with-indexing | 294.263 | ms |
| 99th percentile service time | knn-search-100-1000-concurrent-with-indexing | 688.142 | ms |
| 99.9th percentile service time | knn-search-100-1000-concurrent-with-indexing | 1191.07 | ms |
| 100th percentile service time | knn-search-100-1000-concurrent-with-indexing | 1473.71 | ms |
| error rate | knn-search-100-1000-concurrent-with-indexing | 0 | % |
| Min Throughput | refresh-after-update | 12.2 | ops/s |
| Mean Throughput | refresh-after-update | 12.2 | ops/s |
| Median Throughput | refresh-after-update | 12.2 | ops/s |
| Max Throughput | refresh-after-update | 12.2 | ops/s |
| 100th percentile latency | refresh-after-update | 80.3504 | ms |
| 100th percentile service time | refresh-after-update | 80.3504 | ms |
| error rate | refresh-after-update | 0 | % |
| Min Throughput | knn-search-10-100_multiple_segments | 20.59 | ops/s |
| Mean Throughput | knn-search-10-100_multiple_segments | 28.27 | ops/s |
| Median Throughput | knn-search-10-100_multiple_segments | 29.22 | ops/s |
| Max Throughput | knn-search-10-100_multiple_segments | 30.64 | ops/s |
| 50th percentile latency | knn-search-10-100_multiple_segments | 20.681 | ms |
| 90th percentile latency | knn-search-10-100_multiple_segments | 36.2467 | ms |
| 99th percentile latency | knn-search-10-100_multiple_segments | 332.51 | ms |
| 99.9th percentile latency | knn-search-10-100_multiple_segments | 373.194 | ms |
| 100th percentile latency | knn-search-10-100_multiple_segments | 414.434 | ms |
| 50th percentile service time | knn-search-10-100_multiple_segments | 20.681 | ms |
| 90th percentile service time | knn-search-10-100_multiple_segments | 36.2467 | ms |
| 99th percentile service time | knn-search-10-100_multiple_segments | 332.51 | ms |
| 99.9th percentile service time | knn-search-10-100_multiple_segments | 373.194 | ms |
| 100th percentile service time | knn-search-10-100_multiple_segments | 414.434 | ms |
| error rate | knn-search-10-100_multiple_segments | 0 | % |
| Min Throughput | knn-search-100-1000_multiple_segments | 18.68 | ops/s |
| Mean Throughput | knn-search-100-1000_multiple_segments | 19.35 | ops/s |
| Median Throughput | knn-search-100-1000_multiple_segments | 19.43 | ops/s |
| Max Throughput | knn-search-100-1000_multiple_segments | 19.89 | ops/s |
| 50th percentile latency | knn-search-100-1000_multiple_segments | 37.4816 | ms |
| 90th percentile latency | knn-search-100-1000_multiple_segments | 55.3641 | ms |
| 99th percentile latency | knn-search-100-1000_multiple_segments | 363.392 | ms |
| 99.9th percentile latency | knn-search-100-1000_multiple_segments | 391.91 | ms |
| 100th percentile latency | knn-search-100-1000_multiple_segments | 398.414 | ms |
| 50th percentile service time | knn-search-100-1000_multiple_segments | 37.4816 | ms |
| 90th percentile service time | knn-search-100-1000_multiple_segments | 55.3641 | ms |
| 99th percentile service time | knn-search-100-1000_multiple_segments | 363.392 | ms |
| 99.9th percentile service time | knn-search-100-1000_multiple_segments | 391.91 | ms |
| 100th percentile service time | knn-search-100-1000_multiple_segments | 398.414 | ms |
| error rate | knn-search-100-1000_multiple_segments | 0 | % |
| Min Throughput | force-merge | 0 | ops/s |
| Mean Throughput | force-merge | 0 | ops/s |
| Median Throughput | force-merge | 0 | ops/s |
| Max Throughput | force-merge | 0 | ops/s |
| 100th percentile latency | force-merge | 636516 | ms |
| 100th percentile service time | force-merge | 636516 | ms |
| error rate | force-merge | 0 | % |
| Min Throughput | knn-search-10-100 | 43.71 | ops/s |
| Mean Throughput | knn-search-10-100 | 50.54 | ops/s |
| Median Throughput | knn-search-10-100 | 50.3 | ops/s |
| Max Throughput | knn-search-10-100 | 55.49 | ops/s |
| 50th percentile latency | knn-search-10-100 | 13.3578 | ms |
| 90th percentile latency | knn-search-10-100 | 24.22 | ms |
| 99th percentile latency | knn-search-10-100 | 164.224 | ms |
| 99.9th percentile latency | knn-search-10-100 | 371.773 | ms |
| 100th percentile latency | knn-search-10-100 | 381.88 | ms |
| 50th percentile service time | knn-search-10-100 | 13.3578 | ms |
| 90th percentile service time | knn-search-10-100 | 24.22 | ms |
| 99th percentile service time | knn-search-10-100 | 164.224 | ms |
| 99.9th percentile service time | knn-search-10-100 | 371.773 | ms |
| 100th percentile service time | knn-search-10-100 | 381.88 | ms |
| error rate | knn-search-10-100 | 0 | % |
| Min Throughput | knn-search-100-1000 | 29.16 | ops/s |
| Mean Throughput | knn-search-100-1000 | 33.83 | ops/s |
| Median Throughput | knn-search-100-1000 | 34.49 | ops/s |
| Max Throughput | knn-search-100-1000 | 35.82 | ops/s |
| 50th percentile latency | knn-search-100-1000 | 18.1991 | ms |
| 90th percentile latency | knn-search-100-1000 | 29.4852 | ms |
| 99th percentile latency | knn-search-100-1000 | 298.588 | ms |
| 99.9th percentile latency | knn-search-100-1000 | 347.916 | ms |
| 100th percentile latency | knn-search-100-1000 | 375.315 | ms |
| 50th percentile service time | knn-search-100-1000 | 18.1991 | ms |
| 90th percentile service time | knn-search-100-1000 | 29.4852 | ms |
| 99th percentile service time | knn-search-100-1000 | 298.588 | ms |
| 99.9th percentile service time | knn-search-100-1000 | 347.916 | ms |
| 100th percentile service time | knn-search-100-1000 | 375.315 | ms |
| error rate | knn-search-100-1000 | 0 | % |
| Min Throughput | script-score-query | 6.04 | ops/s |
| Mean Throughput | script-score-query | 6.15 | ops/s |
| Median Throughput | script-score-query | 6.16 | ops/s |
| Max Throughput | script-score-query | 6.2 | ops/s |
| 50th percentile latency | script-score-query | 151.52 | ms |
| 90th percentile latency | script-score-query | 174.84 | ms |
| 99th percentile latency | script-score-query | 421.299 | ms |
| 99.9th percentile latency | script-score-query | 608.292 | ms |
| 100th percentile latency | script-score-query | 675.356 | ms |
| 50th percentile service time | script-score-query | 151.52 | ms |
| 90th percentile service time | script-score-query | 174.84 | ms |
| 99th percentile service time | script-score-query | 421.299 | ms |
| 99.9th percentile service time | script-score-query | 608.292 | ms |
| 100th percentile service time | script-score-query | 675.356 | ms |
| error rate | script-score-query | 0 | % |
----------------------------------
[INFO] SUCCESS (took 3755 seconds)
----------------------------------- Indexing Performance
- Mean throughput이 2456.9 docs/sec. (8.17.4 보다 23% 인덱싱 성능 개선)
- 50th percentile latency : 2135.4 ms
- 99th percentile latency : 4511.9 ms
- long-tail 병목 현상 여전하지만 throughput 자체는 더 높음
- Merge, Refresh, Flush Performance
- cumulative merge time : 37.2 min ( 2배 증가)
- Merge count : 54 → 세그먼트 병합 작업 빈도가 많앗음
- Refresh count : 530, flush : 40 (리소스 절약적)
- Garbage Collection
-
Young Gen GC Time : 10.65 sec / count : 96
-
Old GEN GC Time : 0 sec
→ Heap Pressure 없음. GC 상태 양호(8.17.4 와 동일)
-
- Dataset & Storage
-
Data Size : 1.33 GB
-
Store Size : 1.33 GB
-
Segment Count : 2
→ 8.17.4에서는 153개였던 세그먼트를 크게 줄였고, 이는 검색 성능에 긍정적
-
- Query Performance
- knn-search-100-1000-concurrent-with-indexing
- 50th percentile latency: 127.3 ms
- knn-search-100-1000-concurrent-with-indexing
- Script Score Query (Script scoring)
-
Mean Throughput: 6.15 ops/sec
-
50th percentile latency: 151.5 ms
→ script 기반 유사도는 여전히 느림 (예상된 결과)
-
8.17.4 vs 9.0.0 비교
| 항목 | Elasticsearch 8.17.4 | Elasticsearch 9.0.0 | 차이 요약 |
|---|---|---|---|
| 인덱싱 속도 (Mean Throughput) | 1994.9 docs/s | 2456.9 docs/s | +23% 향상 |
| KNN 평균 처리량 | 약 30 ops/s (100-1000) | 최대 50 ops/s (10-100) | 성능 향상 |
| 50th latency (인덱싱) | 2077ms | 2135ms | 비슷 |
| Merge Segment 수 | 153 | 2 | 병합 최적화 |
| GC (OldGen) | 0 | 0 | 안정적 |
| Dataset 사이즈 | 38.25 GB | 1.33 GB | 트랙 차이 |
| 검색 Tail Latency | 300ms 이상 (99%) | 300–700ms | 유지 |
- 9.0.0은 전체적으로 인덱싱 성능, 검색 처리량, 세그먼트 병합 등에서 개선이 있었고,
- 특히 dense_vector 트랙에서의 벡터 검색 처리량이 높아졌으며, knn-search, script_score 모두에서 평균 latency는 유사하면서 throughput은 향상되었어.
- 일부 검색 쿼리에서 여전히 tail latency 문제(>500ms)가 존재하므로 force merge, segment 조정, 메모리 튜닝 고려 필요.
트러블 슈팅
rally 테스트를 통한 메모리 소모가 너무 클 경우, 인덱스 정리를 해줘야함.
| Node | Shards | Disk Total | Disk Used | Disk Available | Disk % Used |
|---|---|---|---|---|---|
| node-1 | 0 | 43.9 GB | 43.1 GB | 802.4 MB | 98% |
| node-2 | 50 | 43.9 GB | 23.2 GB | 20.6 GB | 52% |
| node-3 | 50 | 43.9 GB | 35.7 GB | 8.1 GB | 81% |
- node-1 은 완전히 찼고 shard가 0개.(데이터가 없어도 메타데이터, shard 할당 실패, 로그 등으로 공간 소모 중)
- node-2, node-3 : 일부 shard 할당되어 있음.
→ node-1 이 flood stage에 걸렸고, 이미 read-only 상태